by
Ko To SANDERSON Research Economist
Agricultural Economics Research Unit and
A. To G & McARTHUR
Senior Lecturer in Rural Education Lincoln College
(University of Canterbury)
THE Unit was established in 1962 at Lincoln College with an annual grant from the Department of Scientific and Industrial Research. This general grant has been supplemented by grants from the Wool Research Organisation, the Nuffield Foundation and the New Zealand Forest Service for specific research projects. The Unit has on hand a long-term programme of research in the fields of agricultural marketing and agricultural production, resource economics, and the relationship between agriculture and the general economy. The results of these research studies will be published as Unit reports from time to time as projects are com-pleted. In addition, it is intended to produce other bulletins which may range from discussion papers outlining proposed studies to reprints of papers published or delivered elsewhere. All publica-tions will be available to the public on request.
Director
Professor B. P. Philpott, M.Com., M.A(Leeds), AR.A.N.Z.
Senior Research Officer
R. W. M. Johnson, M.Agr.Sc., B.Litt.(Oxon.)
Research Officers
R. H. Court, M.A, B.Sc. A R. Frampton, M.Agr.Sc. (On Leave)
Research Assistants
Miss M. J. Matheson, B.Sc. E. D. Parkes, B.Agr.Sc. N. W. Taylor, B.Agr.Sc. G. C. Scott, B.Com.
UNIVERSITY LECTURING STAFF ASSOCIATED WITH
THE UNIT'S RESEARCH PROJECTS:
J. D. Stewart, M.A, Ph.D.(Reading)
Professor of F arm Management
A T. G. McArthur, B.Sc.(Agr.) (Lond.), M.Agr.Sc.
Senior Lecturer in Rural Education
P. Hampton, Ph.D. (Ott.) , M.A
In line with the Agricultural Economics Research Unitns continued i.nterest in the economics of individual farm intensification, this publication sets out procedures for bringing automation to farm budgeting procedures. In New Zealand, the majority of farms are freehold and owner-occupied, and highly dependent on family labour. Farm intensification is necessary, not only to raise family incomep but also to counteract fluctuating prices and
generally ad~erse movements in the farmers u
terms of exchange. Ih the agricultural colleges and in the various extension services, i t is customary to explore the intensification or development problem by means of detailed forecast budgets. Publication No. 35 of the Research Unit is an example of these procedures. The number of farms which can be planned in detail by this method is strict.ly limited by the time involved 0 In the
present pUblicationp Messrs Sanderson and McArthur show
how these budgeting procedures can be speeded up by the use of electronic data processing.
The specific exa.mples used in the paper are drawn from the Northland area of the North Island. But with
suitable modifications the general principles of data process-ing described are applicable in a.ny farmprocess-ing areao If these procedures are generally adopted, the organisation of farm management centres or laboratories, with all the necessary data processing facilities, will be the next :to9ical
development. .
We are grateful to the Commercial Bank of Australia for financing the economic survey of Northland. This publication is a direct product of the investigating procedures used in that. survey <>
Lincoln College, October 1967
COMPU'IJER ME'I'HODiS FOR FARM DEVELOPMENT BUDGETS
1.0 INTRODUCTION
In recent years farm economists and extension workers have turned their attention to the usefulness of the computer
in farm planning and cont.rol {McArthur (1964)} Q Stewart and
Nuthall (1964) have explored the practical use of linear programming (for which a computer is essential) 9 and the
Universi ty of Canterbury Accountancy Department. and the
Farm Management Depart.ment at~ Lincoln College are now invest-igating the use of the computer for control budgeting by farmers. At Massey University Townsley and Schroder (1964) have published computer met.hods for calculating stock
reconciliations.
This bulletin explores a further use of the computer. I t will demonstrate how the computer can be used to calculate
forecast budgets for farm development. The whole purpose of the forecast budget is to predict the implications of a given development plan, and thus to explore the feasibility of such a plan for the individual farmer. Farm advisers already calculate forecast. budgets of this type, but because the
work is onerous and time-consuming, i t is only done in special cases, over a short time horizon, with one set of data.
This paper outlines the general approach to the budgeting problem, then i t describes the computer programs for dairy and sheep development budget:ing (with details provided in an
appendix} 0 1 Finally i t. d:.:Lsc'0~sses some development coefficients
for use in these programs.
1
2.0 DEVELOPMENT BUDGETING
2.1 The Context
The computer programs have been designed specifically for Northland farm advisory officers though they have a wider use than this. After walking round the farm with his client the experienced adviser draws up a target for stock increases over a number of years. From a knowledge of the farm and the district the adviser and his client decide upon the requirements for achieving this rate of increase. For instance most advisers have "rules of thumb" relating stock-ing numbers to fertiliser requirements (see section 3,
page 8). The farmer is usually able to estimate his labour requirements for the increased stock numbers. Estimates can also be made of the capital inputs required such as herringbone sheds for cows, improved handling facilities
for sheep, and other feed and labour-saving devices. The plan drawn up must be a balanced one. I t should include
the expansion of present farm facilities sufficient to handle the extra stock and this may require further water
reticulation, drainage schemes, tracks, airstrips and other necessary improvement.s. The plan should even include the capital cost of improvements to the farmer's house if this is likely to be necessary.
Once the adviser and the farmer have decided upon the physical requirements of the development plan, they must determine whether or not i t is financialYy feasible. At present the process involves repetitive calculation of -stock reconeiliations, cash budgets and mortgage and tax
payments fOl!" each year of development. Even with the use of an electric desk calculator this work can take the adviser many hours for each farm. Using the programs described in
this bulletin, the adviser can record the details of the planned development in a few minutes - the computer does the calculation in seconds. 1
1
The IBM 1130 calculates and prin t.S results for a 7 year sheep development plan in 35 seconds; the dairy
The adviser can write directly on to a card-punching sheet the relevant details of the development plan as out-lined in the appendices. These details are the planned dairy cows, ewes or breeding cows to be run in each year,
the fertiliser required for extra stock units and the requirements for capital items, labour and personal
drawings. Finally he records his estimates of expected prices for the farmer's products. The card-punching sheet would be posted to a computer centre, where the information would be punched on to computer cards, and processed on the computer to give a typed result sheet which would be returned to the adviser immediately.
The results would show stock numbers, stock purchases and sales, net income, tax payments and overdraft levels in each year. These projected results are set out clearly on a sheet. which also lists the main assumptions about development which the adviser has made - the lambing
percentage, development costs, prices, etc. Using manual budgeting, the assumptions made and the yearly results are spread through a number of budget working sheets: using this computer method, all the assumptions made and the projected results are concisely shown on the one sheet. The adviser will find this results sheet extremely valuable for follow-up discussions with the farmer and for credit negotiations with lending institutions. (The appendices explain in detail how these results sheets are to be
in terpreted. )
The adviser would have the projected results from farm development within 45 days of his visiting the farm -depending on postage times.
In writing the computer programs the authors have
adopted a stock orientated approach. This approach differs from the feed orientated method outlined by F~e~Bley, Tonkin and Johnson (1966) whose development budgeting procedure starts by increasing feed supply then raises stock numbers
to eat it. Their method is suitable in areas where there is no winter pasture g-rowth and farmers have to grow supplementary crops to feed their stock. The adviser can estimate the
winter feed provision from known data about the Yiel9Uof these supplementary crops. As there is no relevant information about seasonal grass growth in Northland, the feed orientated approach is unfeasible in this all-grass environment.
However, the adviser often knows the level of fertiliser that will provide at least enough feed for a given rate of stocking (Currie (1965)) 0 No doubt future research will
determine fertiliser programmes which more nearly approach the minimum cost at each stocking level.
The main purpose of the development budget is to estimate the outcomes of the plan to see if i t is feasible. The most important limitation to development in Northland is credit. Consequently the computer programs predict the level of over-draft, given the farmer's required cash drawings over the
future years. This overdraft prediction may give the farmer confidence to execute the plan he and the adviser have agreed on and may also remove doubt from the minds of lending agencies whose participation in the plan is often essential. In order
to overcome uncertainty associated with future prices the program can be re-run with pessimistic prices to see if i t still remains feasible under those conditions.
2.2 The Cope Approach
The mnemonic "COPE" is the code identification of the series of programs which the authors are developing to automate budgeting. Cope stands for Computer ~erdraft Projection
DIAGRAM 1 FLOW DIl-:"GRA~·1 OF' GEN.ERAL! ZED iO COPE" PROGRAM
. - - - 7 1 REA_D_'I~N_F~TJ"~I'
DATAl
[SWEEP
"rHROUGH
N YEARSI
i-[QLcu~A"I'f;=STOCK
RECONCILIA'I'IONUEPAY MOR'I'(iips
-N;i:D~DEBTJSJ
YES - - - . - . . . NO
ONES
[ CALCULNrB BUDGE'r
I
~-, -.-{#~. ~-~
[gLLCULA'1IJ;; TAX
~~-.~."...-..---~~-~-~~'-a
AcctiMULA.'l'ED OVERDRAF'r
OR A~JNUAL S VRP LUS
[YES_ I N O - - - l
' - - - Y E S - - - < : : . ~--NO~
The blocks in the diagram show the separate operations
in the calculation. The arrow from each block denotes
the next operation. An operation surrounded by a diamond
indicates a decision.
'I'he firs t opera tion reads in to the computer the
punch card data for the individual farm. Next this
information is printed out. so that the advijser has a
permanent record of bot.h data and results. '"Preliminary stock calculations" estimates the age structure of the existing flock in the sheep program - a step which was
not considered necessary for the dairy situation. The
next step "calculat.e present mortgage situation" determines the present indebt.edness from data about the initial
condi t.ions of the loan. l
"Sweep t.hrough N years" means that. the calculations down to the diamon/d. ~ '"Reached Nth year'?) are repeated for each year as indica ted by the return arrow which creates a loop.
within this loop, t.he first operation calculates the
stock reconciliat.ion for the particular type of farm. The
reconciliation updates the number of st.ock in each class
and calculates sales and purchases for the year. The
next. opera tion computes the repayment. of debts and mortgages and determines the in bares t for the year. I f the adviser arranged for a new mortgage in the particular year, the program loops to the left adding the new mortgage to the set of existing ones. "Calculate Budget" means mUltiply
the quantities of farm inputs and outputs by their prices, subtract depreciati.on and int.erest, add changes i.n stock values which in tot.al gives an. est.imat.e of assessable income for tax purposeso
Next. the program calculates t.ax according to the present New Zealand tax codeo 2 I t is possible to alter
this program i f the rules change" I n the penul t.ima te
1
Farmers seldom know their present mortgage liabilities but they can usually remember the amount and terms of
the in.it.ial mortgage 0
step in the loop, the program finds the farmer Us overdraft position assuming that any negative cash balance after meeting the needs of the plan and his cash drawings will be added to his overdraft. If the balance is positive the overdraft reduces, but once this is repaid there is a "surplus". This is the surplus over and above living expenses and only occurs .when the overdraft is zero.
More detailed information about using the COPE program is shown in Appendices A and B.
Essentially the COPE approach is to define a rate of farm development and a level of required living expenses and then to calculate the overdraft implications of such a plan. I t makes no attempt to optimize within the program and assumes that the farmer and the adviser have decided on their prioritieso I t can also use farm development
coefficients to simplify the budgeting.
3.0 TECHNICAL AND ECONOMIC COEFFICIENTS
Technical and economic coefficients are required by the COPE programs. Figures like 200 lb. of butterfat per acre and 300 lb. of butterfat per cow are examples of
technical coefficients, while ""repairs and maintenance per cow", is an example of an economic coefficient. All can be derived from past observations on the same farm and/or observations from similar farms.
The use of coefficients from cross-section surveys
as farm standards, has been criticised widely (Stewart (1962) and Candler and Sargent (1962»). By definition, a farm standard is a level of performance which the farmer should aim to reach. We agree that there is no one set of
However, a farmer who wishes to increase his stock numbers above his present level and who wants to know how much fertiliser he will need to achieve this, has only two sources of informa t.ion available to him:
(a) research results
and (b) the experience of other farmers who have already successfully carried out a similar increase in stock numbers.
The whole basis of extension and advisory services is the dissemination of t.his sort of information from research workers and innovating farmers to the general farming
community. In the absence of relevant research results, the authors believe that the next best coefficients for predicting requirements for development can be obtained by studying a group of recently developed farms. The coefficients so obtained from a large number of developing farms would be expected to be more accurate than the
figures which the individual adviser has derived from a smaller number of casual observations. Thus, the coefficients derived from a sample of developing farms will not tell another farmer the optimum stock increases he should aim for. Once he has decided on a desirable
rate of increase, the coefficients will indicate some
of the requirements which will support that rate of increase. These coefficients are a useful benchmark from which
individual advisers may in time derive a series of higher or lower figures for specific development conditions.
In this section we present technical and economic coefficients derived from fast developing sheep and dairy farms in Northland. These coefficients may be used in the COPE programs, to replace individual budgeting of each development si.tuation.
301 Northland F'arm Development Coefficients
The development. coefficients described below were derived from st.udy of a purposive sample of farmers in
The sample was selected from those farmers who had carried out development along lines recommended by advisers. The inputs used and results obtained by them should thus
provide a guide to other farmers embarking on the development strategies recommended at present. In fact the parameters derived describe indirectly the advice given in the past which has been successful and this is likely to be just
the advice which advisers are likely to giv.e to farmers embarking on development in the future.
Using the stock orientated approach to budgeting for pastoral development the most useful rules of thumb are
those which, on a per animal or per stock unit basis, describe the fertiliser required for feed provision and
the extra general costs incurred by the extra animals. The corresponding coefficients are "fertiliser per ewe equivalent" and "Costs per dairy cow in milk", "Costs per ewe" or possibly "Costs per breeding cow".
3.1.1 Fertiliser per ewe equivalent. This is the
quantity of fertiliser (in hundredweights) which farmers have used during the year in order to increase carrying
capacity by one ewe equivalent. I t applies purely to the addition of stock to existing pasture and in fact the fertiliser is probably used to grow more grass at critical times (such as in the early spring) rather
than purely increasing the total annual feed production. This figure does not include "capital" fertiliser used in breaking in new land,l neither is i t strictly the "maintenance" requirement for a stable stocking rate. I t contains an average or maintenance component and a marginal component t.o ensure feed provision for stock added. The figure derived from the Northland sample of developing farms supported a reasonably high rate of increase on most soil types in Northland
(stock numbers were doubled in an average of 6 years) .
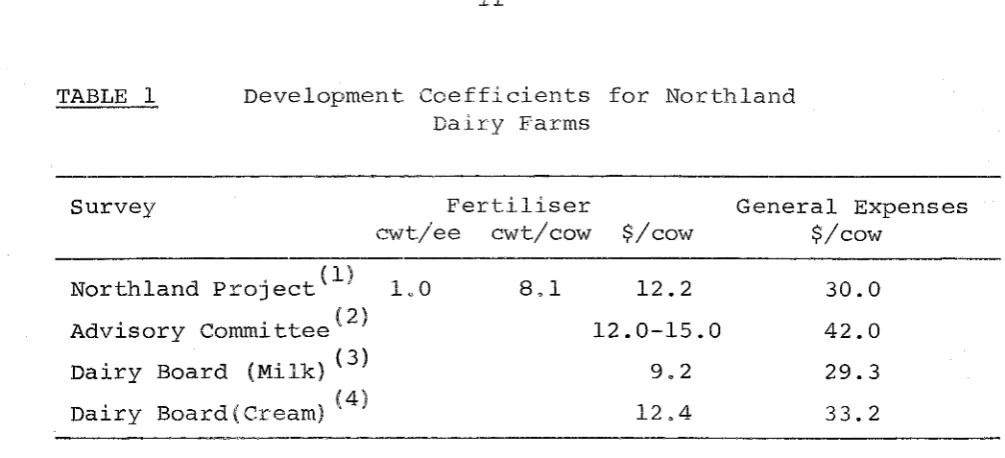
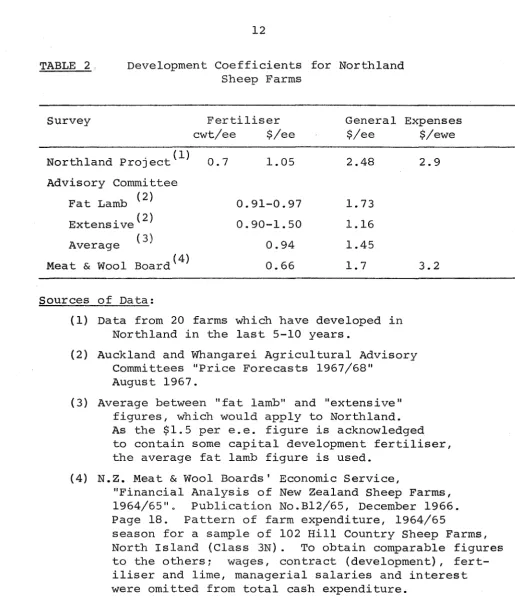
Tables 1 and 2 show the requirements of fertiliser per ewe equivalent derived for developing farms in Northland. Average figures from other surveys are included for comparison as is a figure suggested for use in budgeting, published by the Auckland and
Whangarei Agricultural Advisory Committees. As would be expected our "development farm coefficient" of 0.7 cwt/e.e. for sheep and 1.0 cwt/e.e. for dairy development is slightly higher than the average figures from other sources.
3.1.2 "General expenses per cow" and "General expenses per ewe" 0 TJhese expenses are the amount by
which general farm expenses have increased for each cow or ewe added. General farm expenses are here defined as administrative, animal health, contracting, shed expenses, feed, weed and pest control (except development), vehicles, repairs and maintenance, farm insurance, rates, land tax and sundry. They do not include the main farm expenses of fertiliser, stock purchases, wages of permanent employees, tax-deductible development expenses (fencing, airstrips, drainage
schemes), capital expenses, depreciation, interest or taxationo
Tables 1 and 2 show that there are only small differences between the Northland development coeffic-ients of $2.9/ewe and $3000 per dairy cow, and tpe average figures from other sources. The Advisory Committee's figures are generally higher which may reflect a more cautious approach to budgeting.
At this stage of analysis we have found no consistent differences between development. on different soil types, at different stages of development or for different rates of increase in stock carried. In fact most farm cases studied had parameters close to the average for the sample. l
1
TABLE 1 Development Coefficients for Northland Dairy Farms
Survey Fert.iliser
cwt/ee cwt/cow $/cow
General Expenses $/cow
hI d . (1) 1 0
Nort an ProJect Q
d . . t t (2) A vlsory Comml ·ee Dairy Board (Milk) (3)
(4) Dairy Board(Cream)
Sources of Data:;
8.1 12.2 12.0-15.0
9.2 12.4
(1) Data from 32 farms which have developed in Northland in the last 5-10 years.
30.0
42.0 29.3 33.2
(2) Auckland and Whangarei Agricultural Advisory Commi ttees. "Price Forecasts 1967/68". August 1967.
(3) Farm Economics Section, New Zealand Dairy Board.
"A Survey of the Economic Structure of
Factory Supply Dairy Farms in New Zealand in 1964/65", August 1967, page 33, Table 25 Income and Expenditure per Milk Supply Farm -by Region. ('The figures used are from a sample of 35 Nort.hland farms.)
TABLE 2.. Development Coefficients for Northland Sheep Farms
Survey Fertiliser General Expenses
cwt/ee $/ee $/ee Northland ProJect ' (1) 0.7 1.05 2.48 Advisory Committee
Fat Lamb (2) 0.91-0.97 1. 73
Extensive (2) 0.90-1.50 1.16
Average (3 } 0.94 1.45
Meat & Wool Board ( 4) 0.66 1.7
Sources of Data:
(1) Data from 20 farms which have developed in Northland in the last 5-10 years.
(2) Auckland and Whangarei Agricultural Advisory Committees "Price Forecasts 1967/68"
August 1967.
(3) Average between "fat lamb" and "extensive" figures, which would apply to Northland.
$/ewe 2.9
3.2
As the $1.5 per e.e. figure is acknowledged to contain some capital development fertiliser, the average fat lamb figure is used.
(4) N.Z. Meat & Wool Boards' Economic Service,
"Financial Analysis of New Zealand Sheep Farms, 1964/65"0 Publication No.B12/65, December 1966. Page 18. Pattern of farm expenditure, 1964/65
In summary our data derived from fast developing dairy farms did not differ greatly from the parameters derived from the Dairy Board"s cross-section of Northland butterfat farms. The fertiliser usage in 1964/65 on the cross-section of
Northland milk supply farms were much lower. Values for general expenses were similar from all sources. Our figure for fertiliser weights per ewe equivalent on fast developing sheep farms was considerably higher than the Meat and Wool Boards' figure. The use of their figure for developing farmers would be misleading, as i t is an average of the cross section of farms surveyed by them.
3.2 Development Coefficients in Budgeting
The development coefficients described in the previous section are useful to save time on each farm, and increase the accuracy of present budgeting methods.
The fertiliser requirement per ewe equivalent describes an important technical relationship. The logic behind the use of this is to help ensure that the extra feed grown by additional fertiliser is eaten by extra stock. Quite often extra feed grown by putting on more manure is wasted because there are not enough stock on hand to convert i t all to meat and wool or milk.
There is a danger however, that through repeated use, the coefficients (1.0 cwt and 0.7 cwt per ewe equivalent for cows and sheep respectively) may become accepted as the "true" or "optimal" rates of fertiliser. These levels have been used by farmers who have made substantial increases in output in Northland. Lower levels of use might have given as good results, and we hope that scientist.s will continue to search for fertiliser levels which give an improved economic outcome.
Errors from using the coefficients for "general farm expenses" per cow and per ewe of $30.00 and $3.00 respectively will be small. The estimated general expenses using these parameters only differs by
±
20% from the actual generalcoefficients will give an error of only 6% to the estimate of total outgoings.
I t is intended that the development coefficients
should be treated by advisers and farmers as a guide rather than a rule and that advisers will, from continuing
experience, develop a more accurate series of coefficients for different stocking rates, rates of increase and soil types, for their areas.
3.3 COPEDa Use of Development Coefficients
The COPE programs give the adviser considerable flexibility in his method of estimating farm expenses. He can either make maximum use of the coefficients derived
from developing farms or he can make individual estimates for each farm. The latter takes him longer.
A number of expenses must be calculated by the adviser and written on to the card-punching sheet (see Appendix Au page 19 and Appendix B, page 31). These expenses are capital items (non tax-deductible), wages of permanent employees and the farmerDs personal cash drawings.
Other expenses are alwa2§~ calculated by the program, working from basic informat,ion the adviser has supplied. The program calculates st.ock purchases from the target number of stock, lambing percentage etc., and calculates interest, depreciation, taxation and mortgage repayment for each year from mortgage information, tax exemptions etc., described by the adviser.
Finally there are some expenses which can either be calculated by the pr~~r~mJ or may be estimated for each year by the advJse£ and entered separately on the card-punching sheet.. These expenses are fertiliser,
This quick method of including farm expenses in the program requires
(1) the fertiliser requirement to be expressed in hundredweights per ewe equivalent
(see section 3.1.1);
(2) general farm expenses to be expressed in $ per ewe or $ per dairy cow (see section 3.1.2);
(3) the extra development expenses incurred in each year to be calculated separately and entered in the relevant row in the card punching
sheet (see Diagrams 2 and 3, pages19 and 31 ). The slower method requires that
(a) the total tons of fertiliser required for each year be calculated and costed, and this cost added to the extra development expenses for that year;
(the fertiliser per ewe equivalent space would be left blank on the card-punching sheet); (b) the specific direct costs per animal of shearing,
dipping, shed expenses, is to be estimated and shown in the spaces marked "$ per ewe",
"$ per hgt" or $ per cow"'. Remaining general farm expenses like repairs and maintenance must be calculated for each year and added to the extra development expenses;
(c) the actual extra development expenses must be calculated separately as in the quick method, but in this slower method these expenses must be added to the fertiliser costs and the "fixed" component of g'eneral farm expenses described in points (a) and (b) above. This total figure is then written in the tax-deductible extra development expenses row on the card-punching sheet.
SUMMARY
This paper presents the COPE system for automating the budgeting procedures for Sheep and Dairy farms in Northland. The system follows the budgeting techniques already used by advisers. The computer's capacity,
however, enables us to expand and refine existing practical procedures. This automated system projects the outcome of a previously defined development plan to determine if i t is financially feasible.
REFERENCES
CANDLER, W.V. and Do SARGENT: Farm standards and the theory of production economics.
J. agric. Eeon. 15(2) : 282-290. December 1962. COOP, I.Eo : A review of the ewe equivalent system.
NoZoJ1.agricoS£i. 1, (3) 1965.
CURRIE, JeD.: An intensive farm advisory service for New Zealand. Unpublished Diploma in Agricultural Science Thesis. Lincoln College, 1965.
FRENGLEY, GoAoGo, RoH.Bo T'01i1<IN, RoW.Mo JOHNSON Programming farm development,
Pub1s agric.EconoRes.Unit, Lincoln Co11. no.35, p.17, 1966.
HICKEY, F. : Death and reproductive values of sheep in relation to flock culling and selection.
N.Z.J1. agrico Res. 3 : 332, 1960. McARTHUR, A.ToG. : The computer and farming,
Agric. Bull. Canterbury N.Z. no.437, March 1966. ,STEWART, J.D. : Developments in farm management analysis.
Agrico Bull. Canterbury, N.Z. no. 397, August 1962. Programming a Canterbury mixed farm,
Pub1s agric.Eeon.Res.Unit, Lincoln Co11. no. 7, 1964. TOWNSLEY, ROBERT and WoRo SCHRODER: A Note on breeding
F~PPENDIX Ae
COPE DAIRY DEVELOPMENT (VERSION 1)
A.l GENERAL
The program has been written for t.he simplest dairy farm situation - the farm on tanker collection with no income from pigs or any other major source except the sale of cull cows and bobby calves. l The adviser and the farmer must agree on a target number of cows for the farm in the
future. 'I'his is not a difficult. prediction to make in
Nort.hland. This targ·et. figure is the critical determinant
in the st.ock rE~conciliat.iono
I f the cows and heifers surviving from t.he previous year are insufficient t~o bring the herd up to the target
figure, the needed cows are bought.. The program calculates
the number of calves which need to be reared to give the target herd .size two years hence. I f this number is
beyond the capacity of t.he herd to produce rearable heifer calves, t.hen just the maximum number of rearable heifer calves are reared. 'I'his .is an artificial constraint as a farmer can usually buy neighbours' surplus bobby calves. Nevertheless as there must. be some constraint to the number
of calves reared this seems an acceptable one. The program
calculates the residual bobby calves for sale and the cull cows.
A.2 INFORMA.'I'ION REQUIR.ED BY 'rEB PROGRAM
Diagram 2 shows a card~punching sheet. overprinted for COPE Dairy Development 1 and filled in with example data. 'l'he overprinting makes sure that the digits go into the correct columns to be read by the comput.er. Figures must be kept up against t.he overprinted decimal points with, of course, one digit per column., The meaning of t.he headings on the sheet in Diag-ram 2 are defined below"
1
DAIRY DEVELOPMENT
COPD1
($i'
q M 114"'ls" r. A.T.G.~AmUIL 1'11-{7
P.' I !I •• ra eIIeoH
'._BIIOW
I heifeMl I calvas Ib'fat Ficelcull price Icow price I Xl/COW lewi" /ee.1 fert/tonlu~ena Id.proc·ft. 1.9.41,.,.. ivalu./ih.\i 0 i .., 400' i s " ' i" o· :1 0 ~". 7 o· 3 0 • i . 0 3 O· J <; i Eo. '" :,-O. tOO. 1 . ~
YUR
I
firstI
seeondI
third : fourthI
fifthI
sixthI
seventhI
.i9ftthI
ninth _I
tenth PRO P 0 SEDe
0 W S X MAS I; 0 . ., 0 . 1j' 0 . S' -:.- • 'i 0 . <j ~ • t I:) I:) •FAT PElt
eo
W (F ACT 0 R Y) 200 i 't 0 . 2. 5"0 • .z ~-0 • .2.?S". 30 0 : j O o.EXTRA DIVIL EXPENSES 12' 6 ',)-0 . c· 1. 30 . i SO. o. o·
CAPITAL IXPENSES o· 1 7 0 0 · 3 0 0 · c· 700' b.~o· o·
WAG E S o·
o·
c;. o· o· o· o·NEW /~OItTGA'E RAISED o· o. o· o· o· o· o·
RATE OF INTEREST '0 '0 · 0 · 0 · 0 · 0 - 0
TERM C F tU w MORT&A8E o· o· o· Q. o· o· o·
1
1.
I.D
LIVING aX'INSILI REel. 1hOO' 1 6 0 0 ' 1 b o o . 1600. 1 6 0 0 ' 1 6 0 0 . 1 6 0 0 . . . .
initio' mort. 11 int.rote I term IYl"S9<1ne!initiai mort2.i in+ rote I term IlIl'SSOIIe initiol mort 3 1 int.fate lterm I~rs 9011.
IXlflTING TAILE MORTS. 4-000' 'Ob ~S". 1· . . ' . . . ,
Ilti.tin, debf
11
info rca+' Il"ep .. ~m.n+/!lr lO'ltistin, Jolrt21
into rCl+eI
re pO!Jmenf/gr uisting delrf31 jnt. rlBieI
repayment/llr.EXISTING DIllS 200' .
to
so· . . . . .S.v.cow/ .. v.h.if.I •. v.c.Ive ... c_r. •.
heiflcws+ 1
cullI
wstI
dthI
pdep ItdepI
bobIss>(rn I
tif
t2 t3I
titI
t5I
t6 30· 20· 1 0 · . · 5 3 · 5 95 '15 ' 8 2 ·03 ' 9 5 ' 1 , , · 0 2 0 8 ·015 -251000· ·015 ·Ot25 · tt ., INSf NIII reflo 'odr. ,
Ref: (101): This can be. any 4 digit numbers ·to provide a reference for the job.
Years a 'hd: (7)
This means years ahead the farmer wishes to budget. Ten years ahead is the limit of this program.
Cows: (40)
This tells the computer the number of cows on hand now. The program assumes that the farmer's balance date is the 31st March - the most common practice amongst dairy farms. "Cows" refer to the number of cows on hand at the 31st March. Users need either to estimate the number at the 31st March or give the number that were on hand then if March is over.
Heifers: (15)
Here is recorded the number of heifers on hand at the 31st March. They will be about 18 months old and will be due to calve in the spring for the first time.
Calves: (16)
This records the number of calves on hand. Fat price: (0.30)
This is the estimated payout factory for the years ahead. is recorded in decimals of a Cull price: (36)
price by the dairy In the example i t dollar.
This gives an estimate of the price of all cows sold to the works. The program, as set up, assumes a 15% culling rate.
Cow price: PO)
XS/Cow: (30)
This means "expenses" per cow, expressed in dollars. These "expenses" are those normally shown on the profit and loss account such as shed expenses, repairs and maintenance and so on. However, they exclude the major items of wages, fertiliser,
interest and depreciation which are estimated separately. Section 3 of this bulletin deals with this, and the next figure, in detail. Cwt/EE : ( 1 . 0 )
This means hundredweights of fertiliser per ewe equivalent.
Fert./ton: (30)
Records fertiliser cost (not lime) per ton spread on the ground.
Exemptions: (1916)
These are the taxation exemptions - personal exemptions and those for his wife and children. He can add insurance premiums and charitable donat.ions and school fees. The program assumes that these exemptions will be constant over the years.
Depree: (450)
This is the amount of ordinary depreciation taken from a recent balance sheet. The program uses estimating procedures for depreciation over future years.
Q'draft: (100)
Here is recorded the present level of the overdraft. If the farm has a credit balance with the bank or the stock firm the figure should have a minus sign c in front of it.
Val./lb: (1.4)
This is the value of the farm as a going concern per lb. of butter fat produced, expressed in dollars. This is another frequently used rule of thumb.
Proposed Cows Xmas: (60, 70, 80, 85, 90, 95, 100)
This is t.he number of cows the farmer wants to milk at Christmas in the first, second and third years etc. This row of figures is t.he key to the program. The
'cows at Christmas time' is used because this is the dairy industryBs census time.
Fat per Cow (Factory): (200,190,250,250,275,300,300) This is self-expla.natory.
Extra Devel. Expenses: (126, 650, 0, 130, 150, 010)
'I'hese are non-recurring maj or items of expendi ture which can be claimed against taxation.
Capital Expenses: (O, 1700, 300, 0, 700, 480, 0) 'I'hese are the expenses which cannot be claimed against taxation.
Wages: (0, 0,0, 0, 0, 0, 0)
Like the above two items, these will vary from situation to situation. Like fertiliser they usually make up a substantial share of farm costs and hence the separate row for them.
New Mortgages Raised: Rate of Interest:
Term of New Mortgages:
These' t.hree rows contain zeros in the example given in Diagram 2 because no new mortgages were raised to cover development and capital expenses. These rows are useful, when after a first computer run, the overdraft level is outside the level. the lending institution is prepared to meet and i t becomes necessary to raise a long term development
loan to cover development costs. Living Expenses Required:
Present T3.ble Morts: (4000. .06 25a .1)
In this row there is room for details of up to three mortgages which the farmer may have on his property. As few farmers know the present level of the out-standing mortgage, all that needs to be put in is the initial mortgage, the interest rate, the term of the mortgage, and the number of years gone
(the number of years the mortgage has been in operation) . The program works out the annual
charges and the present level of the mortgage. Debts: (200. .10 50.)
There is room for three debts. An equal amount is repaid each year. Debts which do not have to be repaid can be entered here by placing a zero in "repay/year".
The last two rows contain overprinted constant data which includes 'book values' for stock, and several other constants for the stock reconciliation together with some taxati.on parameters. (See Appendix A.5 for Fortran
statement listingo)
The completed card-punching sheet should be sent to a computer bureau where all the figures on the sheet will be punched on to computer cards. This input information will be fed into a computer along with the COPE Dairy program. The COPE program instructs the computer how to do the budget calculations, on the individual farm informat-ion. The computer then prints out the important figures obtained from each year's budget.
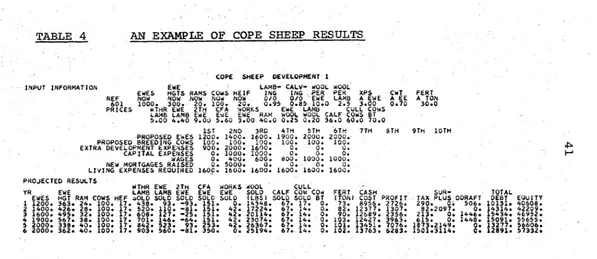
A.3 RESULTS FROM THE COMPUTER
COPE DAIRY DEVELOPMENT 1
INPUT INFORMATION REF COWS HEIF CALF PAY XSA CWT FERT NOW NOW NOW OUT COW A EE A TON 101 40. 15. 16. 0.300 30.00 1.00 30.00
1ST 2ND 3RD 4TH 5TH 6TH 7TH 8TH 9TH 10TH
PROPOSED COWS 60. 70. 80. 85. 90. 95. 100. EXTRA DEV EXPENSES 126. 650. O. 130. 150. O. O.
CAPITAL EXPENSES O. 1700. 300. O. 700. 480. O.
WAGES O. O. O. O. O. O. O.
NEW MORTGAGE RAISED O. O. O. O. O. O. O.
LIVING EXPENSES REQ 1600. 1600. 1600. - 1600. 1600. 1600. 1600. PROJECTED RESULTS
YR COW HEFR CALF FAT BTCOW FER'r COS T PROFIT TAX SURPLUS ODRAFT DEBT EQUITY
1 60. 15. 24. 12000. 18. 28. 4440. 34. O. O. 2055. 6055. 10744. N
,j::> 2 70. 22. 24. 13300. 10. 34. 6575.,-367. O. . O. 5788. 9656. 8963 .
important purchases - fertiliser and cows - the total out-goings of the farmer, and probably most important, the level of overdraft required in each year to carry out the proposed plan.
The headings of the main tabulation of the year-by-year results are now explained in detail (the values are in dollars) •
YR:
COW: HEFR:
CALF: FAT: BT COW:
FERT: COST:
means year.
This gives the lIproposed cowsll
which eventuated. This gives the number of heifers in herd, at the end of the first, second, third year of development. These are the survivors of the calves from the
previous year.
This gives the number of calves to be reared.
This is estimated total pounds of butterfat produced. This means number of cows bought-in each year.
I f the farm has insufficient heifer replacements to give him his proposed cows for a year, then the program assumes he buys them. In this example
the cows are bought for the first three years. This shows the tons of fertiliser used each year. $ This includes all cash expenses including buying
stock, capital expenses, interest and mortgage repayment and taxation, i.e. total cash costs. PROFIT: $ This is the profit as assessed by the Inland
Revenue Department.
TAX: $ This is a function of profit and exemptions. SURPLUS:$ There is no surplus cash until the overdraft
has been eliminated.
DEBT: $ This is the sum of all the farmer's debts at the end of each year including his overdraft, mortgages and other debts.
EQUITY: $ Valuing the farm as a going concern on the basis of its butterfat output and subtracting the debts gives the equity which the farmer owns. This is only a general indication of equity changeso
A.4 VARIATIONS FOR USE OF COPE DAIRY 1.
This program was primarily designed for the farm owner who is thinking about a development plan and wonders if i t
is feasible. The program can also be used by those wishing to buy farms. If they own no stock they can write zeros in the first row under the appropriate stock headings. A share milker bringing his herd horth can enter them
appropriately here too. The capital cost of the farm must go under capital expenses and his positive cash
position needs entering or a negative value in the overdraft box.
The program can also be usep by farmers who wish to buy more land. This cost must be entered in 'capital expenses I and values will need to be inserted in the '. new
mortgage I row if one is necessary.
I I Joe
"; I Foro(
*Ll ST ALL
*U~E wU~O I~TEG~KS *TRMSFEk TRACE
*ARITH~ETIC TRACE
* lOes C CARD .1132PH l,nEN. 01;,'::. TYf'!::i,t( I TLK I
C CUP~ UAI~Y U~VE~uPMtNT 1
o r."'U;S I U;, A C 5 tl" I • G C3.? I .0 C3. 3 I • F C IS I • )lAS C 15 I ,RtlAf' C 15 I .R C HI .. U)' OI,'!E"SIJ,l ,lUJKC1?I.TcRMC1SI.CAf'11SI.Ct.tPCI51.v.A(,tC1S)
CO~~!O~ AS,EXE~;,TAX,~SXM,Tl,T2,T3,T4,T5,r6,T·7.i~Sl.~52
lUO "t:AI)CZol I· N(ULlt.,,<.A C 1.11 .AIZol I .AUol I .f'f<.Cf';<'''f'''.XS.C~T .P,<f. H::XE", .DEf' .UO. V
1 FOllHA T C 14.16 .3C'5.0 .C'5.3 .2C'S. [) ,F,.O .2F 5 .1.Z F5.0 .F6.0 .F4.l I ,<=),+1
KEADCZ.ZI CAC I.JI .J=Z.,'<I 2 FUH~ATCZJX,lUF6.01
"C:AI)CZ.ZI CC'IJI.J=Z.NI I<EA()C2.Z1 cxXSIJI.J=Z.NI KtADCZ.LJ CCAPC JI .J=Z.,\j1 HEALlCZ.ZI C.AGtCJI.J=z.NI "EA[JCZ.ZI CktCAPCJI.J=Z,,'<1 j,EA[JCZ031 C,lUUKCJI.J=Z,," 3 FOR~ATC20x.1UF6.41
,lEADCZ.ZI CTtKf.1CJI .J=Z.NI I<EADCh21 ClEtPC JI tJ=Z,,'<I ,lEADCZ.41 CCGCI,JI.J=1.4Io1=1t31 4 FOR~ATC20X,3CF7.U.F5.3.2F4.UII
,<EIID C 2.5 I C CD C I. J I, J= 1031 oJ = 103) 5 FORMATC20X.3CF7.U.F5.3.F8.UI I
REAU(~,6) V(,V~I,vCA,X,Y,C~~T,CULL'W~T,OTh.~ut~.SDl~,dJ8,SSXM.Tl,
lT2.T3.T4.T5.T6
6 FOHMAT(3F400,2F3o0,5f4.l,F4.1,F~.O,F5e3,F~.2,F~.CtF5.3 ,f6.4,F4.21 ~EAlJ C2,1I TI.NS1", ... 2,RATIO,ODK
FO~~ATCF).U.LIZ,F4.2.F5.31
','./<1 Tc C 3.8)
FOk~ATC27X.Z6HCOPE DAIRY DtVLLOPMtNT I I I
"RlTEC3,9) 9 FUI"',A T C I J
lXS A (.,) "RlTU3.6JI
(l~Pt.;T
Ft.r~ T I )
j ,,< FOi,,"lA T I J,~ ~EF CUwS Ht.IF CALF
60 FOkMATC34X,41HNO. NUW ~U~ uUT CU. AEt A TUN) ·,I-<ITE13.611 NCOI)E.AC 1.1I.AC2oll,AC3oll. f'f<.XS,C"T.f'RF 61 FO~~ATC29X,14.3F5.0.2X,F7.3.2F6.Z.F7.21
,,:,{JTEC3.62) 62 FOR~ArC22X.57H1ST
1 10Tli I
2ND (!RlT"C3,631 CAC 1.JI .J=Z.,,,,
31,D 4TH
63 FOkMATC7x.13HP~uPO ... ED C0WS,10F6.01 '"rHTEC3,641 CXX51JI .J=2,,~1
,y.'H
64 FOR~ATC2X.18HtXTRA DEV tXf'lNSES.10F6.01 ""ITEC3.651 CCAPCJI.J=2.,,1
65 FOR~ATC4X.16HCAPITAl EXPtNSlS. 10F6.0) ~HITEC3.661 C.AGECJI.J=2.NI
06 FORMATCI5X.5HWAGES.10F6.UI WRITEC3.671 CkECAPCJI.J=2.NI
67 FORMATC1X.19HNEW MORTGAGE RAISED lOF6.UI
6fH 7TH
f'AY
eTH 9TH
C
C
e
C
\;RITEC3.681 tcEEPCJ) .J=2.N)
68 FORMATIIX.19HLIVING EXPENSES RE~.10F6.0/)
WRITEC3.521
52 FOR~ATI'0 PROJECTED ~ESUlTS'1
I'IRITEI3.501
50 FORMATClx.79HYR CO ... HEf" CALF FAT tlTCO" F.tkT COST PI-(UFlT
l~PLUS OOHAFT DEdT ~QUITYI
PRESENT MORT~AGE SITUATluN 00301=103
IF CGC It! 1130.30.31 31 ,,<T=GCI031
,~G"G C 1.41
FAC T = C 1. +G I I .21 ) **NT
~ C I .5 I =G C 1 tl 1 I C CF ACT-I. II C 6 C 1 .2 ) *F ACT I j
D033J=1.NG T=G C 1.11 *G C 1 • 21 33 GCltl)=GClo1l+T-6CI.51 30 CO,\.r I,WE
D070 I =1 010 D071K=1.5 71 "C I.KI=U. 70 corn I,~UE
"tl=O ,~ORE=N+2 DOI0J=N •. '10Ht: 10 AC1.JI=ACl.NI
SWEEP THROUGH N YEARS STOCK RECONCILIATION DOllNOW=2 .r~
LAS T-=NO',y-l NEXT=NOl/+l NBO=NOW+2
AC4.NO.I=CACl.NOW)-~ST*CAC2.lA5TI+AC1.lASTI I )/W~T
IFIAI4.NOWII12tlZ.13 12 AC4.NUwl=0.
A15.NOWI=Cl.-DTHI*CAIl.LASTI+ACZ.LASTII-AI1.NOW) GO TO 14
13 AI5.NOWI=CAC1.LAST)+AC2.LASTI+AC4.NOWI I*CULl 14 AI3,NO"I=CAC1,NBOI-AC1.NEXTI*"'STI/C"ST*C"STI
CLIM=AC1.NO",,*RATIO IF C A C :;. "leN) -C II [-.\1 15 • 15 016 16 AC3.NOW)=CLIM
15 AC2.NO~I=AC3.LASTI*CwST
EE=CAll.NOWI+ACZ.NOWII*X+AC3.NOWI*Y
STK=IAC1.NOWI-AC1.LAST)I*VC+CACZ.NOWI-ACZ.LAST)I*VH S TK =S TK+ C A C 3; ,~O,,) -A C 3 .LAS T I ) *VCA
MORTGAGE REPAYMENT PAY:O.
HEST=O. DOl71=103
IFIGII.11-1.117,17.18 18 T=GII.11*GCli21
REST=REST+T
G I ! ,.1 ) =G C I .11 + T -G [I .5) PAY=PAY+GC!.5)-T
TAX SU
C)
1'",
17 (ONT UiUE
C DEBT REPAYMENT 00191=1.3
IF !D I I 01 ) -1. ) 19.19.20
20 T=DI/.l)*011.2) KEST=REST+T
01 / .11 =0 11.1) -0 I I .3) PAY=PAY+O( /.3 I 19 (CIloTPlUE
IFIRECAPINOWI )72.72.73 73 ,';T = TEk~~ I NOw I
FACT= 11 •• ROUK I NO'vI I) **NT
BACK=HECAPI~O~I/I IFACT-l.)/IHOOK(NOW)*FA~T)) Kfl=KB+l
~IKR.I)=HECAP(NOWI
~IKH.~I.CUOK(NU.)
telKB.31=BACK 72 IFIK~)74.74.75 75 00761=1.K~
T=RII.ll*iCII.21 I,ES T=kES r+T
~11.l)=RII.ll+T-RII .3) 76 PAY,=f.>AY+ICII.31-T
74 SPEC=O.
C CASH BUDGET
~O~5=EE*C.T/20. ,
COST=A 14 .:W ... ) *'Wk+TUI~S*f.>ICF+AI 1 .NOW I *XS'+XX'S INOw) +WAGE 1 NO .. ) FAT=FINO~).A11.NOw)
ElUO=FAT*i>:h 1 I All .:,O'~ ) *i<A T 10*2. ) -A 13 .iW,,) I *BOB+A 15 .NOW ) *CPR-COS T' DEP=Di:Y*f.>OEi>
IFICAi>I"U~;) 131.81.82 82 DEP=D~P+CAPINO~)*Il.-PDtP)
SPfC=CAP(NO~.)*~OEP 81 AS=~UD+SrK-DEP-SPEC-KEST
CALL eTAXI
CASH=ElUD-TAX-CAPINO~)-PAY-kEST+KECAPINU~) UD=UD*Il.+ODHI+CEEPINOWI-CASH
IFIODI41.41.42 41 SUClP=-OD
(1)=0.
GO TO 45 47 SUHP=J. 45 DEBT=GD
DO 90 1=1.3
90 DEBT=GII.ll+OII.II+~EBT IFIKB)91.91.92
92 00 93 l=itKB 93 DEBT=DE5T+RII.1) 91 ASSET=FAT*V-D~AT
l..=j\~O~\
L.L=NQ'.'-1
C05T=COST+kEST+PAY+CAPI~OWI+TAX
WRITEI!,51) LL.Al1,L).AI2.L).AI3.L).FAT,AI4.LI.TONS,C05T.AS.TAX~
1SURP,OD.DEBT.A55ET
51 FOR~ATIlX.12.F5.0,F4.0,F4.0.F7.0.2F5.0,F7.0.2F6.0.4F7.0)
11 CONT INUE
CALL OATSW( l4.JOFFJ GO TU(100.139t,JOFF 139 CAL.L. EXIT
ENO
I I FOR *LIST ALL
*ONE WORO INTEGERS
*r~A"'SFER TRACE *ARITHMETIC TRACE
SUBROUTINE CTAXl
COMMON AS, EX~M. TAX. SSXM.Tl.T2.T3.T4.T5.Tb,t7.NS1.N52
IFIAS-SSXMII.1.2 "
TAXeO. ,<ETURN
2 SS'= I AS-SSXM) * Tl
T=AS-EXEi~
IFITil3.l3.l4 13 TAX=SS
~ETUili',
14 rAx=T*T2 T=T-T3 IFIT)3d.4
4 00 5 1=1,NS1 TAX=T*T4+TAX T=T-200. IFIT)3.3.5
5 CONTINUE DO , l=l.NS2 TAX=T*T5+TAX TzT-200. IFIT)3,.3'.,
b CONTINUE 3
REB=TAX"T6-IFI"tS-T1)7.8..a
6 REA=T7 ' 7 TAX=TAX+SS-REB
RETURN ENO
tv
APPENDIX B.
COPE SHEEP DEVELOPMENT (VERSION 1)
B.l THE APPLICABLE SITUATION
This version of the COPE program is applicable to sheep with cattle development, with a basically "breeding replacements" stock policy. As with the dairy program, the ¢l.evelopment plan can include buying the farm. Stock. expansion during development can be brought about by
increasing ewe numbers or breeding cow numbers or both. This program will not handle cash cropping.
B.2 THE SHEEP RECONCILIATION
The sheep reconciliation can manage a variety of breeding policies using the different culling values. I t also adjusts the farmer's figures for "average lambing
'Yo"
and "average death rates" by employing standard figures to calculate these parameters for each age class of ewes
(Hickey, 1960).
In order to achieve the target number of ewes, the program allows for deaths and sales of cull ewes from each age group. I t then brings the farmer's two-tooths into the flock. If the target is more than reached, the extra two-tooths are sold. If not, the program buys two-tooths in that year.
B.3 THE CATTLE RECONCILIATION
The target breeding cow numbers are reached by keeping up to a maximum of 80% of all heifer calves. If still more cows are required, they are bought. All steer calves and at least 20% of heifer calves are sold in their first year.
in Northland.
This is the most common practice
B.4 INFORMATION REQUIRED BY THE SHEEP PROGRAM
Diagram 3 shows a card punching sheet overprinted for COPE Sheep Development 1, and filled in with data for a sheep farm example. As with the Dairy sheet, the overprinting is intended to help the adviser quickly become familiar with data requirements of the program. Figures should be kept hard up to the overprinted decimal point and further decimal points should not be added. A full definition of the headings on the sheet follows. Ref: (601)
This can be any 4 digit number to reference the job. Years ahead: (6)
1 The number of years of development. Ewes Now: (1000)
This tells the computer the number of ewes on hand now. In fact this will be the ewes put to the ram last March.
Ewe hgts now: (300)
This is the number of ewe lambs kept at the last ewe lamb culling.
Rams: (20)
1
This figure is the rams on hand.
I t is advisable to include information for the next year after development has been completed to allow the plan to achieve a measure of stability. The proposed ewes and proposed breeding cows entered for that year would be
~.~~~-
.'" -
~'~J'~'~~~
'<; :., llfil7FD 'c':: . . . . : - , \0;.;> bCCR;?:nci)$.HElPJIVntfMfNT:PROGAAr"WE N:·.-C.O.PU- .($)
,;- /., ";,
7~-r"~':"';'-';
.,,,o.;{,,,.j •. '.' ,0,.. 'V lIAR.'fl~3
.. ..
fi'~.ciciftd···
t .
:O'thiJ;r·-rfouiftt"· -:
r~
fith-' -,J~ii'fh---:"'" Jiiiwiifh~ni'-hf .~;-
[-'ftin
'~'--:"r"-'
'.,.
'0' 0 • . . • • • • 6 . . _ •
w' •. ... .. , •
A';';"" • .; 'A'; J L " ; ' ; ' . •A;';"'!" .;;.,
:f"::~T,tH{"~.!::
...:: ....
~::.::,,:
..
t ... h;t •.•
·:;·HL1~
~~:.~~;, .• ·~:T;~A.,D.~.Yii. o • • Il~·P .N~ IS
_CA~.kt:~··I:~.'i N$&~.·~ -- . " . .
'~"'WAell' .': ~Ci'ggjg:·; ,i'~+~::
_.i.. ____ :_L
t.
• . ' • j
.-... -.--
---, 0
""fUWMOITI4GI RA. SiC
'····~~~E
.,.F· IN.T rllllS;' '.. TI
RM
0~
' ...a... ...
R TG U • . '"~·.i:·~~;i·~~~~·Q~:=;~~i~~~''''~",J~·:.:''t3~5~I~.:=·
;:.":.=': ... .
Le·v
'N~ . i ) ( ' I tU 15 It!Q.· l.. 6 00;· i6 0''0:·1.600' f 600" 1'(,0 0;;'" i~b":o~~''':''o,-,-~,~,,,,,,,';''':~' . , .. ~.:'0'.
r' ' .. >rj'.~".. . . ' ... ' . . . ~ f..nffiGI 8I10;+;i' int.rofe
i
-fef' .. m '!In.gofte inltiG! mill+' 2 fint. m,Te ". _to e ..._.m.firs.,...
initio.m .
.vu.
I ill .. t. ... NtQ Iterm 1161'S. 9o"e§N-. ~ ~:f IN. 'f it I I, I M @ !ItT S 1
°
0 0 0 • • 06z
S" • :i. -~ • • . 0 • • • •.. ~1,,· . . . . . . . :Ili:tfi", d.bf-
if
illt.I'Clf. f~.gMI~iI!(nn';!i1I" •. existil'l,de,"!1
info ... f@ I;'Po,"ut~i~~ ~lCistil'l9-M3
hwfo.Pde f»PG~m~+I,,.
m~I'-'fHH& 9 1 1 ' f i
o·
. 0 ·o·
. . •
. "
.
.
.
~®;.,.. ~f/~
I
/$",,& 0/$Iw.
Wshffl'@.'-Ii Mdft e. h~ .. ~"I
.~ el4~ It.Il!I.i~E!\!IIeh'O@!I_e 'Weell'-~ lI.illol'$/!l1/' f~ ~. ~lv;~ %cow
J4It.1
coW.uOldI. .
~°Q2 .oC~S". 0'4 .03 .'OS- ' 0 3 . S 1.0 00 2 , . S - 30~O.02. (),o:'i"$"" o.p2.0.1..s:- .. '
: . . . . . ew~ lell'lil
t
Piiill, Hfa ·r..i$~I'I' 6thf
pill in, f.rn irillil'l, S !If'1 f'ilil'l,6!1f'J
rili",· 1,rI
pisi",a,rl
visin, 9 !Ii" Il'isil'l, ·U),,...:Jf·~;;h:·=~.::.~;~::~ ::~)
::: '" . :; ....••..
}::·.);·;.:j:ic-~·:i~~~~~;~·~;:-·!~b.~;~:::;~~
...
:.--1·-.·· ..
", - R . .'-f
w+",.
- '111' ewe~.
temPt rZ+L ft ewec.~
f. ". ewe 6I
work. . .O~II'
om... 0·rM.WO$,ofka";_.f~.CIi!_S·
. t&. "...
;__·I~UJr'··.".leo.·"":
.~ ... W8J~..
... " ... _ f.f-·-.""·" "" '" -... -._-:--. " _,, ___ ... '':'.'_ ... ' ,1',,1
e
I' S-~ 0tl
4"I
J.'
0f
~'.f1 Ls·
qr
*0' O~. 2.S-~o';'&~,C:'I:3'~.~~· .. §P~2;:-j,Q~Q:i_~.,._o._~.";,,_,,:'-:'_'',,1 "s . ./ClWe )t1l.1"!. lCs./eow c: ./e .•.
f-rt
.tton.,xemp+i_uM,NC'n." - i . .
...,...,:.~o.--...
'O';:...-i-.::...:,~-....,...,..;-:o-:-: .. ..-,-.--:---.'.---, ...~~'i:~:~~:~~:
~"-F ~"""'i)'
" - - ' 0 ',fl·
4i' ,,-
5 -t ..
&.,",. -",.
O·£ft)"OL3-()~"0!--'"
..._r_.~
..
:t·
Z·O·•I ·:--
O'1S"--'lS- '1000 \Cows Now: (100)
This number of breeding cows were put to the bull recently.
Heifers: (20)
This is the number of heifers kept from last year's crop of calves.
Proposed Ewes: (1200, 1400, 1600, 1900, 2000, 2000)
This series is the number of breeding ewes which the farmer aims to put to the ram after the first, second, third etc., year of development.
Proposed Breeding Cows: (100, 100, 100, 100, 100, 100) This is the number of breeding cows intended to be put to the bull in succeeding years.
Extra Devel. Expenses: (900, 2000, 1600, 0, 0, 0)
These are tax-deductible development expenses. (Main items of expense are fertiliser and wages and these are entered separately in this example. Annually recurring expenses such as repairs and maintenance, accounting, insurance, contracting charges, etc., are included in a figure for "expenses per ewe".l) These expenses would include breaking in new land, fencing, drainage schemes, airstrip etc.
Capital Expenses: (0, 1000, 1000, 0, 0, 0)
These expenses cannot be claimed for taxation, e.g.· new buildings, machinery and plant.
Wages: (0, 400, 600, 800, 1000, 1000)
This row shows the wages which the farmer expects to pay to his per~anent labour, as distinct from contract shearing labour.
New mortgage raised: 0. Rate of interest: .0 Term of new mortgage: 0.
5000. 0. 0. .05.0 .0 25. 0. 0.
0.
.0 0.
0.
.0
0. 1 For
~n expla~ati6n ofalter~ative
methods of includingThese three rows allow the farmer to specify new· mor:j:gages which he intends to raise to cover some of the larger development and capital expenses. Before proceeding with a development plan, the farmer and adviser should make sure that in fact these mortgages will become available when
required. (The results from a COPE analysis will be useful in approaches to lending institutions.) Living Expenses Req.: (1600,1600,1600,1600,1600,1600)
In effect, this is the minimum level of cash drawings. which the farmer is willing and able to tolerate.
Existing Table Morts: (10000. .06 25. 1.)
In this row there is room for details of up to three mortgages which the farmer may already have on his property. The actual information here is a table mortgage of $10,000 at an interest rate of 6% for 25 years. I t has already run one year.
Exis ting' debts: (0. .0 0.)
These will be debts like hire purchase agreements. Ram Ratio: (.02)
The number of rams as a fraction of the number of ewes. (2% or 1 ram for every 50 ewes'.)
Lamb %: (.95)
The average lambing percentage recorded in the past, ioe.
Lambing percentage
=
lambs tailed ewes put to ram e.g.W.lamb shorn: (0.4)
950 lambs tailed
1000 ewes to ram = 0.95
e. lamb dth: (.03)
This is the fraction of ewe lambs which die between tailing and culling. In this case 97% of the ewe lambs tailed survived through the summer to culling. (This is often a very small loss.)
e. hgt. dth: (.05)
This records the expected average deaths of
ewe hoggets between ewe lamb culling (or shearing) and two-tooth culling. Usually the second
figure is available from the two-tooth shearing tally. This is purely a figure for deaths and does not include two-tooths culled.
Ewe dea th : (. 03)
Average death rate of breeding ewes on this farm. I t should include all ewes which are removed from the breeding flock, but not sold, i.e. deaths and "dog tuckers". This figure above is 3% or .03.
Lambings per ewe: (5)
This figure is the maximum number of lambings which a farmer can get out of a ewe (on average) and still sell i t as a "c.f.a." ewe. This is purely used to distinguish between ewes which will be sold at the price for "c.f.a." ewes
sold to other farmers and the lower priced "works" ewes. In this case the farmer can get 5 lambings out of his ewes and sell as
"c. f. a. 's" . I f he kept them all for 6 lambings he would have to sell most of them to the works.
(Note that there is no decimal point required.) Wool/ewe: (10.0)
Average lb. weight of wool per ewe per year. Wool/lamb: (2.5)
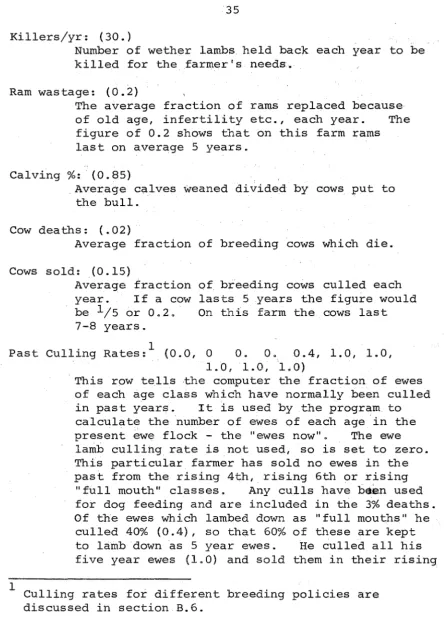
Killers/yr: (30.)
Number of wether lambs held back each year to be killed for the farmer's needs.
Ram wastage: (0.2)
The average fraction of rams replaced because of old age, infertility etc., each year. The figure of 0.2 shows that on this farm rams last on average 5 years.
Calving %: (0.85)
. Average calves weaned divided by cows put to the bull.
Cow deaths: (.02)
Average fraction of breeding cows which die. Cows sold: (0.15)
Average fraction year. If a cow be 115 or 0.20' 7-8 years.
q£ breeding cows culled each lasts 5 years the figure would On this farm the cows last
1
Past Culling Rates: (0.0, 0
o.
O. 0.4, 1.0, 1.0,1
1.0, 1.0, 1.0)
This row tells ,the computer the fraction of ewes of each age class which have normally been culled in past years. It is used by the program to calculate the number of ewes of each age in the present ewe flock - the "ewes now". The ewe lamb culling rate is not used, so is set to zero. This particular farmer has sold no ewes in the past from the rising 4th, rising 6th or rising
"full mouth" classes. Any culls have
hElEm
used for dog feeding and are included in the 3% deaths. Of the ewes which lambed down as "full mouths" heculled 40% (0.4), so that 60% of these are kept to lamb down as 5 year ewes. He culled all his five year ewes (1.0) and sold them in their rising
6 year season. Note the program requires that culling rates for all further age classes should be put in at a value of 1.D.
Minimum Culling (Dev.): (0.2, O. O. 1. L
O. 0.4, 0.6, 1 . 1 . )
This row has been included to allow the farmer to cull less heavily while he is rapidly expanding his flock. The figures used are the minimum
culling rates acceptable to the farmer during development.
In this example the farmer had decided to increase as fast as possible by keeping ewe lambs. Thus he allows himself to cull only the worst 1/5 (0.2) of his ewe lambs. As before he culls no rising 4th, rising 6th, or rising full mouths, and culls 40% of his rising 5 yr. ewes. During development he is willing to keep 40% of his rising 6 yr. ewes
to lamb down as 6 yr. old ewes, thus culling is 0.6. He culls all 6 yr. old ewes and sells them as rising 7 yr. ewes to the works.
These rates are used by the program to calculate the cull ewes of each age class sold during the years of development until the second-to-last and last years.
Culling after Dev.: (0.6, O. O. O . . 4, 1. 1. 1. 1. 1.) This row allows the farmer to return to a more
vigorous culling program after the initial, rapid expansion is complete:" These culling
rates are used in the last two years of the program and so should return the flock to a fairly stable position in the last year. In the example the farmer has decided to heavily cull his ewe lambs after development, keeping only 40% for replace-ments. In fact over the years even a "stable" farmer will vary this culling rate to reduce the number of two-tooths bought or to regulate the number of two-tooths sold. A figure of 0.6 represents a fairly heavy culling.
The farmer's ewe culling policy in this case
Price:
These are all expressed in dollars and are estimates of average prices this, farmer would expect over the next six years. They are all expressed at "farm gate" prices with corresponding adjustments for cartage.
wthr lamb: (5.0)
The price the farmer would expect for fat lambs sold to the works or for wether hoggets sold during the winter is usually about the same. ewe lamb: (4.4)
Expected price for store or fat ewe lambs. 2 th ewe: ( 9 . 0 )
The price which the farmer would normally have to pay for bought two-tooths, or would receive for ones he sold.
c . f . a. ewe: ( 5 . 6 )
An average price for ewes sold at the yards as breeding ewes.
works ewe: (3.0)
The price for old ewes sold to the works. ram: (40.0)
The .price paid for rams bought. The program assumes that old 'rams are used for feeding dogs. ewe woo I : ( 0 . 2 5 )
This is a "net" figure for an average, expected price for wool. The one used here is 30 pence per lb. which would be optimistic for next year but would be a reasonable average over a longer period, in the authors I opinion.·
lamb wool: (0 .. 20)