https://doi.org/10.5194/amt-12-2579-2019 © Author(s) 2019. This work is distributed under the Creative Commons Attribution 4.0 License.
Potential improvements in global carbon flux estimates
from a network of laser heterodyne radiometer
measurements of column carbon dioxide
Paul I. Palmer1,2, Emily L. Wilson3, Geronimo L. Villanueva3, Giuliano Liuzzi3,4, Liang Feng1, Anthony J. DiGregorio3,5, Jianping Mao3,6, Lesley Ott3, and Bryan Duncan3
1National Centre for Earth Observation, University of Edinburgh, Edinburgh, UK 2School of GeoSciences, University of Edinburgh, Edinburgh, UK
3NASA Goddard Space Flight Center, 8800 Greenbelt Road, Greenbelt, MD 20771, USA
4Department of Physics, American University, 4400 Massachusetts Avenue NW, Washington, DC 20016, USA 5Science Systems and Applications, Inc., Lanham, MD 20706, USA
6Earth System Science Interdisciplinary Center, University of Maryland, College Park, MD 20740, USA Correspondence:Paul I. Palmer ([email protected])
Received: 7 March 2018 – Discussion started: 3 April 2018
Revised: 25 March 2019 – Accepted: 6 April 2019 – Published: 2 May 2019
Abstract. We present observing system simulation experi-ments (OSSEs) to evaluate the impact of a proposed network of ground-based miniaturized laser heterodyne radiometer (mini-LHR) instruments that measure atmospheric column-averaged carbon dioxide (XCO2) with a 1 ppm precision. A particular strength of this passive measurement approach is its insensitivity to clouds and aerosols due to its direct sun pointing and narrow field of view (0.2◦). Developed at the
NASA Goddard Space Flight Center (GSFC), these portable, low-cost mini-LHR instruments were designed to operate in tandem with the sun photometers used by the AErosol RObotic NETwork (AERONET). This partnership allows us to leverage the existing framework of AERONET’s global ground network of more than 500 sites as well as provid-ing simultaneous measurements of aerosols that are known to be a major source of error in retrievals of XCO2from pas-sive nadir-viewing satellite observations. We show, using the global 3-D GEOS-Chem chemistry transport model, that a deployment of 50 mini-LHRs at strategic (but not optimized) AERONET sites significantly improves our knowledge of global and regional land-based CO2 fluxes. This improve-ment varies seasonally and ranges 58 %–81 % over southern lands, 47 %–76 % over tropical lands, 71 %–92 % over north-ern lands, and 64 %–91 % globally. We also show significant added value from combining mini-LHR instruments with the existing ground-based NOAA flask network. Collectively,
these data result in improved a posteriori CO2flux estimates on spatial scales of∼10 km2, especially over North America and Europe, where the ground-based networks are densest. Our studies suggest that the mini-LHR network could also play a substantive role in reducing carbon flux uncertainty in Arctic and tropical systems by filling in geographical gaps in measurements left by ground-based networks and space-based observations. A realized network would also provide necessary data for the quinquennial global stocktakes that form part of the Paris Agreement.
1 Introduction
in observing greenhouse gases from space, any uncharacter-ized systematic errors can compromise the accuracy of their data (Wunch et al., 2017) and limit the utility of such data sets for inferring surface flux distributions (Basu et al., 2013). Ground-based networks of accurate and precise XCO2 mea-surements such as Total Carbon Column Observing Network (TCCON) (Wunch et al., 2017) therefore play an important role in helping to validate these space-borne missions. We describe how we can improve knowledge of the carbon cycle by establishing a network of low-cost, portable mini-LHR (miniaturized laser heterodyne radiometer) instruments that measure XCO2to fill in gaps left by existing column ground-based networks and space-borne observations. These instru-ments can be quickly deployed (to be collecting data within a few hours) and can run autonomously in the field with little or no maintenance over a period of months or years.
Ground-based, broad spectral column measurements of XCO2 from the TCCON FTS network have been used to minimize regional systematic errors and serve as a gold stan-dard to validate satellite measurements. In 2010, the TC-CON FTS instruments reported an accuracy of∼1 ppm due to bias errors from uncertainties in spectroscopic parameters (Wunch et al., 2010). They resolved this limitation at five of their sites by tying their column-averaged dry-air mole frac-tions to the World Meteorological Organization (WMO) in situ trace gas measurement scales using aircraft profiles and indicated that they planned to eventually perform similar cal-ibrations at the remainder of their sites. While TCCON prod-ucts are well characterized, the majority of the 32 TCCON sites are in the Northern Hemisphere, leaving important mon-itoring gaps in regions where our knowledge of the drivers of carbon cycling is uncertain (Shuur et al., 2008; Commane et al., 2017; Saunois et al., 2016; Le Quéré et al., 2016).
The NASA mini-LHRs are designed to be deployed in tandem with AErosol RObotic NETwork (AERONET) sun photometers (Holben et al., 1998), taking advantage of their sun trackers. This partnership provides a pathway for es-tablishing a global network of mini-LHRs by leveraging AERONET’s network of over 500 sites and offers a simulta-neous measure of aerosol optical depth (AOD) that is a nec-essary input for satellite retrievals (Butz et al., 2009). Simi-lar to TCCON, mini-LHRs can collect data during breaks in cloud coverage, thereby offering the potential for new data products in formerly under-represented regions such as the Amazon Basin, southern Asian monsoon areas, and the Arc-tic. These vulnerable geographic regions are not well covered by OCO-2 and GOSAT. Here, using numerical experiments, we simulate a strategic (but not optimized) deployment of 50 mini-LHR instruments to AERONET sites and evaluate how this increase in measurement density impacts knowl-edge of regional and global carbon fluxes.
2 Mini-LHR instrument configuration
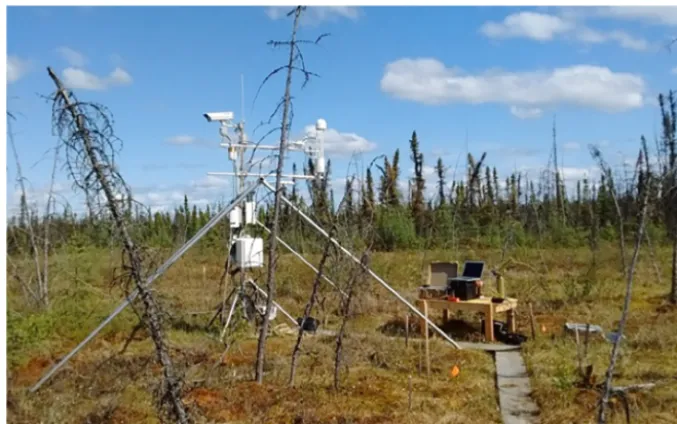
The mini-LHR is a ground-based, passive, sun-viewing in-strument that observes trace gases in the atmospheric col-umn. It has been under development at the NASA God-dard Space Flight Center (GSFC) since 2009 (Melroy et al., 2015; Clarke et al., 2014; Wilson et al., 2014; Wilson and McLinden, 2012), and while earlier versions exclusively measured XCO2, the current version observes both XCO2 and XCH4. Current challenges associated with our under-standing of emissions of CH4(Wolf et al., 2017) will result in a different network design. The mini-LHR has been tested at altitudes ranging from sea level to 3400 m and in climates that include tropical, subtropical, and temperate zones, ex-tending to just below the Arctic Circle, and has shown con-sistent precisions of 1 ppm in XCO2and 10 ppb in XCH4for hourly data products. Figure 1 shows a mini-LHR monitor-ing XCO2and XCH4over thawing permafrost at a remote site in the Bonanza Creek Research Forest near Fairbanks, Alaska. The goal of these field tests was to both improve the quality of the data product as well as to test the durability of commercial components that were intended for indoor lab use.
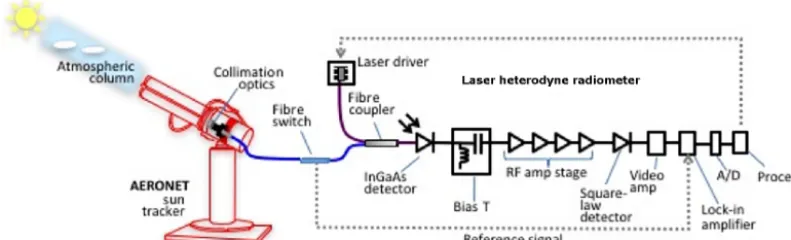
The mini-LHR measures XCO2by scanning the CO2 ab-sorption feature near 1.61 µm. Figure 2 shows the current configuration of the system, and Table 1 lists key system parameters. Sunlight is collected with a fibre-coupled, 0.2◦ field-of-view collimator that is non-invasively connected to an AERONET sun tracker. Once collected, sunlight is mod-ulated with a fibre switch, superimposed with infrared laser light from a distributive feedback laser in a single-mode fibre coupler, and then mixed in a fast photoreceiver and InGaAs detector to produce an radio frequency (RF) beat signal. The RF receiver separates RF and direct current (DC) out-puts, and the RF signal is amplified, filtered, and then de-tected with a square-law detector. The resulting signal is measured with a lock-in amplifier referenced to the fibre switch frequency as the laser scans across an absorption fea-ture. A microprocessor controls the laser scanning and data collection. The mini-LHR has spectral sampling resolution of ∼0.013 cm−1, which is 15 times higher than GOSAT (∼0.2 cm−1), 20 times higher than OCO-2 (∼0.3 cm−1), and slightly higher than TCCON (∼0.02 cm−1). Individ-ual scans of the CO2feature are collected at 2 min intervals throughout the day during sunlight hours when clouds are not present and averaged into hourly data products.
3 Data processing and retrieval
Figure 1.The mini-LHR (right) is portable and can be deployed to remote locations where larger TCCON installations are not possible due to the fragile ground conditions. Shown here are the mini-LHR monitors XCO2and XCH4alongside an eddy-covariance tower (left) in a collapse-scar bog permafrost site in Alaska.
Table 1.Parameters used to calculate mini-LHR averaging kernels for the Bonanza Creek site. The molecules analysed in the 72-layer atmosphere included H2O, CO2, O3, N2O, CO, CH4, O2, and N2, and the level of variability was 0.05.
Parameter Value Units
Instrument lower wavelength 1.61137 µm
Instrument upper wavelength 1.641165 µm
Instrument resolution at FWHM 0.000003 µm
Instrument’s data SNR 500 d
A priori variance 5 %
Zenith angle range 0-60 ◦
Latitude 64+42.055/60.0 ◦N
Longitude 360−(148+18.763/60.0) ◦E
Date and time of observations to extract MERRA values 30/05/2016, 19:15 UT dd/mm/yyyy, hh:mm
the mini-LHR observes in the atmosphere) and (2) fitting the simulation to the data to extract the abundance of XCO2.
We simulate the spectra using the Planetary Spectrum Generator (PSG), which is an online tool developed at NASA–GSFC (Villanueva et al., 2015, 2016) for synthesiz-ing Earth and planetary spectra (atmospheres and surfaces) for a broad range of wavelengths (0.1 µm to 100 mm, span-ning UV to radio wavelengths) from any observatory, orbiter, or lander. This is achieved by combining several state-of-the-art radiative transfer models, spectroscopic databases, and planetary databases. The PSG code includes refraction of sunlight through the atmosphere as well as a computation-ally efficient scattering package that incorporates the latest radiative transfer numerical methods (Villanueva et al., 2015; Smith et al., 2009) and is parameterized for LTE (local ther-modynamic equilibrium) calculations. While scattering is not required for direct sun-viewing measurements, the scattering
package contains a treatment of aerosols; the extinction por-tion of this treatment is needed to properly model the con-tinuum shape. The PSG is operated remotely by employ-ing a versatile online application program interface (API). The API operates by sending a configuration file to the PSG servers. Upon reception of the configuration file, the PSG computes and returns the spectra.
Figure 2.Schematic of a mini-LHR. Sunlight is collected with collection optics that are non-invasively connected to the AERONET sun tracker. Sunlight is then modulated with a fibre switch, superimposed with infrared laser light from a distributive feedback laser in a single-mode fibre coupler, and mixed in a fast photoreceiver and InGaAs detector to produce a radio frequency (RF) beat signal. In the RF receiver (custom), a bias tee separates RF and DC outputs. The RF signal passes through a gain stage and is then detected with a square-law detector. The signal is measured with a lock-in amplifier that is referenced to the modulation frequency as the laser scans across an absorption feature. A microprocessor controls the laser scanning and data collection.
database, which is the latest atmospheric reanalysis of the modern satellite era produced by NASA’s Global Model-ing and Assimilation Office. MERRA has incorporated in-formation from hundreds of orbiters and ground stations since 1980 and provides global three-dimensional analyses of atmospheric parameters (e.g. temperature, abundance pro-files, and aerosols). Specifically, our retrieval works with the M2I3NVASM component, which provides assimilated mete-orological fields (pressure, temperature, water vapour, ozone, and water ice clouds) from the surface to∼80 km (72 lay-ers), with a cadence of 180 min and spatial resolution of ∼0.5◦ (576×361). The values are further refined tempo-rally and spatially to a resolution of better than 1 km, em-ploying the USGS-GTOPO30 topographic maps and con-sidering a hydrostatic equilibrated atmosphere within every bin. Our code computes temperature (T) and pressure (P) abundances for Earth by first selecting a set of six stan-dard profiles based on season and latitude: “Tropical”, “Midlatitude-Summer”, “Midlatitude-Winter”, “Subarctic-Summer”, “Subarctic-Winter”, and “US-Standard” (Ander-son et al., 1986). These profiles provide abundances for a myriad of species and basic temperature and pressure pro-files. The code then extractsP,T, O3, H2O, and water ice abundances from the MERRA-2 database for this location and time. The MERRA-2 grid is described on a coarse grid, and it does not contain fine elevation information; therefore the GTOPO30 topography database (∼1 km resolution) is also used to derive the exact elevation of the mini-LHR site location. The information from MERRA-2 at a particular ge-olocation is then refined in elevation, e.g. using scale heights, using this high-resolution topographic map.
Our code generates an initial configuration file that estab-lishes the location, date, and time of the measurement. Using this configuration file, the code calls the PSG–API, and this returns all of the geometry parameters (air mass, phase angle,
etc.) and an a priori vertical profile based on the date and lo-cation. Then, using this configuration file, the program goes into the fitting routine that calls the PSG–API to calculate spectra by fitting the CO2 abundance using an optimal es-timation approach. The fit perturbs the CO2abundance and obtains a fit based on the Levenberg–Marquardt algorithm, which is an iterative least-squares curve-fitting procedure.
Calibration and validation of mini-LHR data
Mini-LHR instruments periodically undergo a calibration– validation procedure at NASA–GSFC to track performance and establish documented traceability of column data prod-ucts. In particular, we calculate and report measurement pre-cision, measurement error, and measurement bias, as defined by the Vocabulaire International de Métrologie (VIM; Meau-res, 2012).
We estimate measurement precision (standard devi-ation) by routine laboratory calibrations. In the cal-ibration procedure, the mini-LHR instrument scans a NIST (National Institute of Standards and Technology) traceable atmospheric mixture of gases (NIST Trace-able Reference Material Program for Gas Standards, https://doi.org/10.6028/NIST.SP.260-126rev2013) in a 36 m Herriot absorption cell. The NIST traceable atmospheric mixture of gases fulfils the criteria of a measurement stan-dard with a negligible measurement uncertainty. The calibra-tion gas standards are specified in the Code of Federal Reg-ulations (CFR) to calibrate instruments used to monitor reg-ulated emissions. The standard deviation of the points in the scan provides an estimate of precision, while regular calibra-tions track any measurement bias (systematic measurement error).
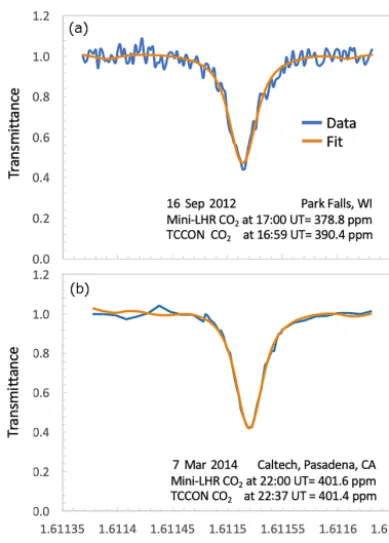
Figure 3.Side-by-side comparisons of mini-LHR and TCCON in-struments(a)at Park Falls on 16 September 2012 and(b)at Caltech on 7 March 2014. Mini-LHR data are shown in blue with the PSG retrieval fit in orange. The 2012 data are the average of three scans collected over the period of an hour, and the 2014 data are the aver-age of five scans collected over the period of a half hour. The result-ing XCO2value for the mini-LHR and the nearest corresponding value for TCCON are shown in the inset.
Park Falls, Wisconsin, in 2012 and at Caltech in Pasadena, California, in 2014. Sample scans from these comparisons are shown in Fig. 3 with fits from the PSG retrieval. Data from 2014 showed a significant improvement in agreement with the TCCON CO2 measurements because it was pos-sible to collect more scans within a shorter timeframe; the 2012 data are the average of three scans collected over the pe-riod of 1 h and the 2014 data are the average of five scans col-lected over the period of a half hour. A longer-duration side-by-side comparison is planned with the TCCON located at the NASA Armstrong Flight Research Center (AFRC). In ad-dition to laboratory calibrations, potential bias between mini-LHR instruments will also be addressed by regularly compar-ing a “standard” mini-LHR that is co-located at the NASA– AFRC TCCON with all other mini-LHR instruments. TC-CON FTS instruments measure column CH4and CO2at the same wavelengths but at lower resolution than the mini-LHR. While TCCON has a well-documented history of characteri-zation, we refer to this as an “estimate” of measurement error due to differences in resolution and because there are known biases between TCCON sites (1 % for CO2 at US sites and 1.1±0.2 % at European sites; Wunch et al., 2010).
For passive satellite observations, scattering from clouds and aerosols is known to be a significant source of retrieval error for XCO2 (Mao and Kawa, 2004; Aben et al., 2007; Uchino et al., 2012; Yoshida et al., 2013). This is primarily because these are nadir-pointing instruments that view sun-light reflected on a portion of ground that is illuminated by direct sunlight as well as scattered sunlight from clouds and aerosols. In contrast, ground-passive measurements have a narrow field of view (FOV) and point directly at the sun. The TCCON at Park Falls, Wisconsin, for example, has an FOV of∼0.14◦, and mini-LHRs have an FOV of ∼0.2◦ (compared to the sun which has a field of view of∼0.5◦). Because the FOVs of these instruments are narrower than those of the sun, their light collection optics do not accept the scattered light outside of this FOV. Consequently, the mini-LHR and TCCON are mainly impacted by extinction, resulting in lower levels of sunlight reaching these ground instruments and lower signal-to-noise levels. Solar intensity variations that impact TCCON are corrected by dividing the interferograms by the unmodulated DC signal (Keppel-Aleks et al., 2007). For the mini-LHR, transmittance scans are cor-rected for extinction by dividing scans by a fitted baseline that tracks fluctuations in solar irradiance.
4 Theoretical potential of network to improve knowledge of regional carbon fluxes
We use numerical experiments to provide an upper limit on the theoretical potential of the proposed network on reduc-ing the uncertainty of regional carbon flux estimates. The ap-proach we take is to define a closed-loop experiment, often called observing system simulation experiments (OSSEs), in which we define the true atmospheric state using a global 3-D model of atmospheric chemistry and transport driven by true surface fluxes. This true atmospheric state is then sam-pled as it would be by the mini-LHRs (e.g. time, location, and vertical sensitivity). We then generate a complementary set of model values that are generated from an independent surface flux inventory, including differences in the magnitude and distribution of fluxes; we use this independent inventory as our a priori for the OSSEs. We infer the a posteriori fluxes from measurements using an ensemble Kalman filter.
biomass burning emissions from the Global Fire Emission Database (GFEDv3; van der Werf et al., 2010).
Currently, it is common practice to assume that most of the uncertainty in atmospheric CO2 stems from natural fluxes, so other sources are typically assumed to be well described by existing inventories (e.g. Gurney et al., 2003). While this practice is slowly being challenged by the community, we re-tain these assumptions for the purpose of our theoretical cal-culations. To define our true atmospheric state, we use three-hourly land biosphere fluxes from the ORCHIDEE land sur-face model (Krinner et al., 2005); in a separate model cal-culation, to define our a priori state, we use three-hourly land biosphere fluxes from CASA (Olsen and Randerson, 2004). Figure 4 shows that there are significant seasonal dif-ferences in the magnitudes and distributions of ORCHIDEE and CASA land biosphere CO2fluxes so that our OSSE pro-vides a rigorous test of the theoretical data.
For the purposes of inter-comparability of impacts of dif-ferent data, we have ignored any source of systematic error in the different measurements or the transport model that links a priori information to 4-D atmospheric mole fractions of CO2. Even sub-parts-per-million levels of uncharacterized systematic error in atmospheric measurements will signifi-cantly compromise our ability to infer unbiased regional CO2 flux estimates.
Our retrieval simulation requires a matrix of averaging kernels (A) that describes the sensitivity of the retrieved state vectorxˆ (in this case, a vector describing the vertical profile of CO2 described overnatmospheric layers) to the “true” state vectorx, for different values of solar zenith angle throughout the day. Using the standard convention, upper-case and lower-upper-case emboldened variables denote a matrix and vector, respectively, and superscripts−1 andT denote matrix inverse and transpose operations, respectively. The averaging kernel is calculated as (Rodgers, 2000; Liuzzi et al., 2016)
A=∂xˆ ∂x =
S−a1+KTS−1K
−1
KTS−1K, (1) whereSais the a priori error covariance matrix (sizen×n), Sis the measurement error covariance matrix (sizem×m,
wheremdenotes the length of the radiance vector), andKis the matrix of weighting functions that describes the deriva-tive of the radiance with respect to a change in the CO2 profile (sizem×n). The matrix of averaging kernel is used here to describe the instrument sensitivity to changes in CO2 so that we can simulate mini-LHR XCO2column measure-ments in GEOS-Chem. For simplicity, we assume thatSaand S are diagonal and represent the square of the background
variability of CO2 concentration in each atmospheric layer and the square of the instrument noise, respectively.
The sum of the rows of A corresponds to summing the retrieval sensitivities to the CO2 in each atmosphere layer and describes the sensitivity of the atmospheric column to a change in atmospheric CO2in the vertical profile, i.e. the
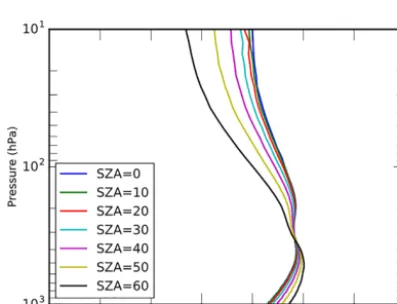
column averaging kernela. In the ideal case, each summed row would be close to unity. Figure 5 shows that for a va-riety of solar zenith angles, a>0.8 in the troposphere but falls off quickly in the stratosphere, consistent with TCCON averaging kernels (Wunch et al., 2011).
We also calculate the number of degrees of freedom (DOF) of the retrieval as the trace ofA, which estimates the num-ber of independent pieces of information that can be derived from retrieval. In the case of the column XCO2retrieval, this should be close to or higher than 1; values less than 1 indi-cate the influence of a priori information (Camy-Peyret et al., 2017). We find that with an signal-to-noise ratio (SNR) value of 500 and an assumed a priori variance of 5 %, for CO2, concentrations result in a DOF between 0.88 and 2.10.
To infer regional fluxes of CO2 from the measurements, we use an established ensemble Kalman filter approach (Feng et al., 2009, 2016, 2017). For brevity, we refer the reader to Feng et al. (2009) for a detailed description of the approach and its application within GEOS-Chem. We adopt a uniform 50% a priori uncertainty and assume a conserva-tive 1.5 ppm for individual measurement and model trans-port errors. To characterize the impact of the mini-LHR mea-surements on the a priori knowledge we use a metric that describes how uncertainty of fluxes has reduced after the a priori has been informed by the following measurements: γ=1−Siic/Sdii, where Siic andSiid denote the diagonal ele-ments of the a posteriori and a priori CO2flux error covari-ance matrices, respectively. A larger value forγ denotes a larger scientific impact of the observations. We also report comparisons between true, a priori, and a posteriori CO2 fluxes over key geographical regions. Together, our use of two independent land biosphere flux inventories, theγ met-ric and the inter-comparison of fluxes provide a transparent theoretical assessment of the LHR data to quantify geograph-ical fluxes of CO2.
We performed three experiments to estimate true CO2 fluxes using the following: (1) TCCON measurements with their current measurement configuration (Fig. 4), (2) mini-LHR measurements collected at an enhanced number (50) of sites, and (3) the combined data sets from mini-LHR measurements and selected surface flask sites to study the added value of mini-LHR data to the existing NOAA Earth System Research Laboratory ground-based network of mole fraction data that is commonly used to infer regional CO2 fluxes (e.g. Peylin et al., 2013). We conservatively assume a mini-LHR measurement precision of 1.5 ppm in our ex-periments; however, the current precisions for the mini-LHR and TCCON data products are<1 ppm for 1 h data products (Wunch et al., 2010; Messerschmidt et al., 2011; Wilson et al., 2017; Melroy et al., 2015). Instrument biases were not included in these OSSE runs because our focus is the rela-tive performance of different ground-based remote-sensing networks.
Figure 4.Distribution of land biosphere CO2fluxes (1014molec cm−2s−1) for January(a, c, e)and July(b, d, f)in our study year, described on the 4◦latitude×5◦longitude GEOS-Chem model grid.(a, b)show the CASA model that we used as our a priori,(c, d)show output from the ORCHIDEE land surface model that we use to define the true state, and(e, f)show the difference between ORCHIDEE and the CASA model. The cyan triangles represent observation sites from (1) current and future TCCON networks(a, b), (2) the enhanced mini-LHR network(c, d), and (3) the subset of the NOAA ground-based network(e, f).
Figure 5.Averaging kernel (AK) values for COˆ 2for different val-ues of solar zenith angles. Calculations for CO2have been done assuming a mini-LHR SNR of 500 (although in reality SNR varies with solar zenith angle (SZA) and is highest near an SZA of 0) and assuming a background variability of 5 %.
regions where AERONET sites already existed and where there are gaps in the existing in situ measurements, TCCON measurements, and satellite observations. Consideration was also given to accessibility, acknowledging evolving political environments. Consequently, the enhanced network has not been optimized to minimize carbon flux uncertainties.
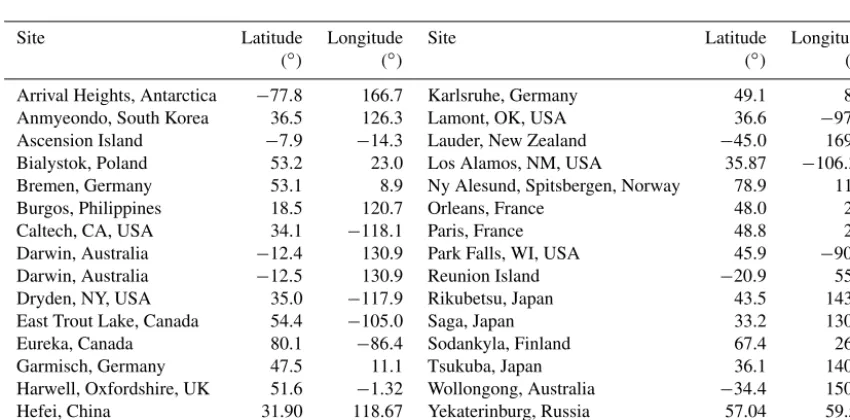
Table 3 reports the TCCON sites used in our numerical experiments. We simulate TCCON XCO2observations using the same approach as we use for the mini-LHR instruments. For TCCON, we use CO2averaging kernels from the latest TCCON XCO2retrievals of version GCC2014 (Wunch et al., 2011).
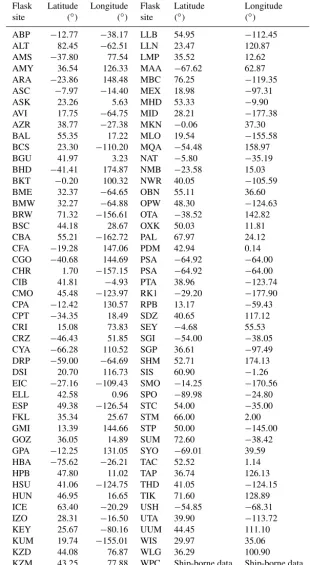
Table 4 shows the surface flask sites used in our joint assimilation experiment. They are a subset of the NOAA ground-based network and are chosen mainly based on their data continuity in recent years (i.e. 2009–2016). In our ex-periments, we use the real availability of the flask data in the compiled surface data set (GLOBALVIEW-v3.2) while simulating the observation values by sampling model surface CO2concentrations at the observation location and time.
Figure 6.Distribution of annual mean residuals that describe the true state minus a priori and a posteriori CO2fluxes (1014molec cm−2s−1), described on the 4◦latitude×5◦longitude GEOS-Chem model grid.
Table 2.List of 50 selected AERONET and NASA sites with mini-LHR installed in the future for the OSSE study.
Site Latitude Longitude Site Latitude Longitude
Amsterdam_Island −37.8 77.6 GSFC, MD, USA 39.0 −76.9
Arica, Chile −18.5 −70.3 ND_Marbel_Univ, Philippines 6.5 124.8
Birdsville, Australia −25.9 139.3 NEON-Disney, CO, USA 28.0 −81.4
Brisbane-Uni_of_QLD, Australia −27.5 153.0 NhaTrang, Vietnam 12.2 109.2
Cairo_EMA, Egypt 30.1 31.2 Omkoi, Thailand 17.8 98.4
CEILAP-BA, Argentina −34.6 −58.5 Park Falls, WI, USA 45.9 −90.3
Churchill, Canada 58.7 −93.8 Penn_State_Univ, PA, USA 40.8 −77.9
Cuiaba-Miranda, Brazil −15.6 −56.1 Pontianak, Indonesia 0.1 109.2
Dhaka_University, Bangladesh 23.7 90.4 Pretoria_CSIR-DPSS, South Africa 25.8 28.2
Edinburgh, UK 55.9 −3.2 Pune, India 18.5 73.8
Bonaza_Creek, AK, USA 64.8 −147.7 Red_Mountain_Pass, CO, USA 37.9 −107.7
Gobabeb, Namibia −23.6 15.0 Rio_de_Janeiro_UFRJ, Brazil −22.8 −43.3
Ittoqqortoormiit, Greenland 70.5 −21.6 Rio_Branco, Brazil 10.0 −67.9
Irkutsk, Russia 51.8 103.1 Santiago, Chile −33.5 −70.6
Kaiping, China 22.4 112.7 Sao_Paulo, Brazil −23.6 −46.6
Kelowna, Canada 49.9 −119.4 SEGC_Lope_Gabon, Gabon −0.2 11.6
Kibale, Uganda 0.5 30.4 South_Pole_Obs_NOAA, Antarctica −90.0 77.3
Lake_lefroy, Australia −31.3 121.7 Tamanrasset_INM, Algeria 22.8 5.5
Lanzhou_City, China 36.0 103.0 Taylor_Ranch_TWRS, ID, USA 45.0 −114.8
Manaus, Brazil −3.2 −60.0 Tomsk, Russia 56.5 85.0
Mauna_Loa, HI, USA 19.5 −155.6 Ussuriysk, Russia 43.7 132.2
Mexico_City, Mexico 19.0 −99.1 Wits_University, South Africa −26.2 28.0
Monterey, Canada 36.6 −121.9 Yakutsk, Russia 62.0 129.7
NASA/AFRC, CA, USA 34.6 −118.1 Yekaterinburg, Russia 57.0 59.5
Figure 7. Distribution of annual mean root-mean-square errors between the true state and a priori and a posteriori CO2 fluxes (1014molec cm−2s−1), described on the 4◦latitude×5◦longitude GEOS-Chem model grid.
Table 3.TCCON stations used in this OSSE study.
Site Latitude Longitude Site Latitude Longitude
(◦) (◦) (◦) (◦)
Arrival Heights, Antarctica −77.8 166.7 Karlsruhe, Germany 49.1 8.4
Anmyeondo, South Korea 36.5 126.3 Lamont, OK, USA 36.6 −97.5
Ascension Island −7.9 −14.3 Lauder, New Zealand −45.0 169.7
Bialystok, Poland 53.2 23.0 Los Alamos, NM, USA 35.87 −106.32
Bremen, Germany 53.1 8.9 Ny Alesund, Spitsbergen, Norway 78.9 11.9
Burgos, Philippines 18.5 120.7 Orleans, France 48.0 2.1
Caltech, CA, USA 34.1 −118.1 Paris, France 48.8 2.4
Darwin, Australia −12.4 130.9 Park Falls, WI, USA 45.9 −90.3
Darwin, Australia −12.5 130.9 Reunion Island −20.9 55.5
Dryden, NY, USA 35.0 −117.9 Rikubetsu, Japan 43.5 143.8
East Trout Lake, Canada 54.4 −105.0 Saga, Japan 33.2 130.3
Eureka, Canada 80.1 −86.4 Sodankyla, Finland 67.4 26.6
Garmisch, Germany 47.5 11.1 Tsukuba, Japan 36.1 140.1
Harwell, Oxfordshire, UK 51.6 −1.32 Wollongong, Australia −34.4 150.9
Hefei, China 31.90 118.67 Yekaterinburg, Russia 57.04 59.55
Izana, Tenerife, Spain 28.3 −16.5 Zugspitze, Germany 47.4 11.0
A posteriori fluxes inferred from the enhanced mini-LHR network significantly improve agreement with true fluxes compared to TCCON measurement configuration, particu-larly over tropical land regions. Annual mean deviations are generally smaller than 2×10¹³molec cm−2s−1and vary on the grid scale throughout the year for many continental re-gions. We find that including the NOAA flask data helps with reducing these variations, in particular over North Amer-ica and Europe, where the coverage by the surface data is densest (Fig. 6). Figure 7 compares the root-mean-square
er-ror (RMSE) for our three inversion experiments relative to the true state. First, all our inversions show much smaller deviations compared to the a priori values. The enhanced mini-LHR network performs significantly better over trop-ical lands such as troptrop-ical South America and troptrop-ical North Africa.
insensi-Table 4.NOAA flask sites used in the OSSEs.
Flask Latitude Longitude Flask Latitude Longitude
site (◦) (◦) site (◦) (◦)
ABP −12.77 −38.17 LLB 54.95 −112.45
ALT 82.45 −62.51 LLN 23.47 120.87
AMS −37.80 77.54 LMP 35.52 12.62
AMY 36.54 126.33 MAA −67.62 62.87
ARA −23.86 148.48 MBC 76.25 −119.35
ASC −7.97 −14.40 MEX 18.98 −97.31
ASK 23.26 5.63 MHD 53.33 −9.90
AVI 17.75 −64.75 MID 28.21 −177.38
AZR 38.77 −27.38 MKN −0.06 37.30
BAL 55.35 17.22 MLO 19.54 −155.58
BCS 23.30 −110.20 MQA −54.48 158.97
BGU 41.97 3.23 NAT −5.80 −35.19
BHD −41.41 174.87 NMB −23.58 15.03
BKT −0.20 100.32 NWR 40.05 −105.59
BME 32.37 −64.65 OBN 55.11 36.60
BMW 32.27 −64.88 OPW 48.30 −124.63
BRW 71.32 −156.61 OTA −38.52 142.82
BSC 44.18 28.67 OXK 50.03 11.81
CBA 55.21 −162.72 PAL 67.97 24.12
CFA −19.28 147.06 PDM 42.94 0.14
CGO −40.68 144.69 PSA −64.92 −64.00
CHR 1.70 −157.15 PSA −64.92 −64.00
CIB 41.81 −4.93 PTA 38.96 −123.74
CMO 45.48 −123.97 RK1 −29.20 −177.90
CPA −12.42 130.57 RPB 13.17 −59.43
CPT −34.35 18.49 SDZ 40.65 117.12
CRI 15.08 73.83 SEY −4.68 55.53
CRZ −46.43 51.85 SGI −54.00 −38.05
CYA −66.28 110.52 SGP 36.61 −97.49
DRP −59.00 −64.69 SHM 52.71 174.13
DSI 20.70 116.73 SIS 60.90 −1.26
EIC −27.16 −109.43 SMO −14.25 −170.56
ELL 42.58 0.96 SPO −89.98 −24.80
ESP 49.38 −126.54 STC 54.00 −35.00
FKL 35.34 25.67 STM 66.00 2.00
GMI 13.39 144.66 STP 50.00 −145.00
GOZ 36.05 14.89 SUM 72.60 −38.42
GPA −12.25 131.05 SYO −69.01 39.59
HBA −75.62 −26.21 TAC 52.52 1.14
HPB 47.80 11.02 TAP 36.74 126.13
HSU 41.06 −124.75 THD 41.05 −124.15
HUN 46.95 16.65 TIK 71.60 128.89
ICE 63.40 −20.29 USH −54.85 −68.31
IZO 28.31 −16.50 UTA 39.90 −113.72
KEY 25.67 −80.16 UUM 44.45 111.10
KUM 19.74 −155.01 WIS 29.97 35.06
KZD 44.08 76.87 WLG 36.29 100.90
KZM 43.25 77.88 WPC Ship-borne data Ship-borne data
Figure 8.True, a priori, and a posteriori monthly CO2fluxes (GtC yr−1), described over large-scale geographical regions for our study year. Vertical lines and the grey shading denote uncertainties associated with the a priori fluxes and the a posteriori fluxes inferred from the mini-LHR and NOAA in situ flask networks, respectively.
Figure 9.Annual mean root-mean-square errors (RMSEs; GtC yr−1) associated with (red) a priori and a posteriori flux estimates inferred from (green) TCCON and (blue) mini-LHR CO2columns and from the (black) combined mini-LHR–NOAA in situ flask networks.
tive to some geographical regions (e.g. tropical South Amer-ica and North AfrAmer-ica), as expected. Fluxes inferred from data from the mini-LHR network, independently and in combina-tion with NOAA flask data, are closer to the true state over most parts of the world, e.g. north land summer months, as expected. Figures 8 and 9 also show that on the large spatial
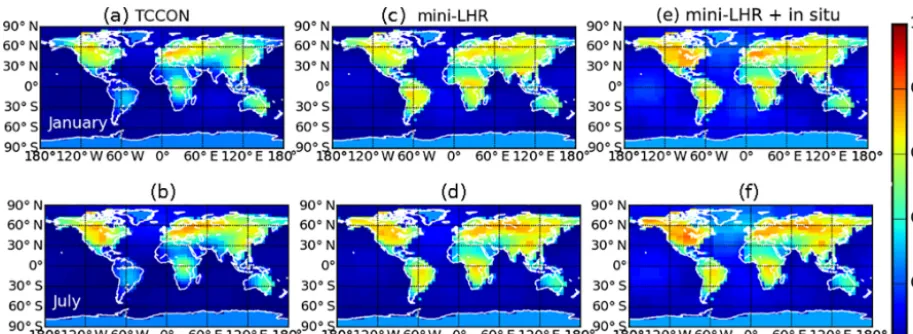
Figure 10.Theoretical improvement in the knowledge of CO2fluxes for a nominal(a, c, e)January and(b, d, f)July as determined by the γ factor, defined in the main text, for the(a, b)mini-LHR,(c, d)TCCON, and(e, f)combined mini-LHR–NOAA in situ flask measurement networks.
Figure 10 shows that the mini-LHR enhanced network of 50 sites results in global and significant improvements in our knowledge of CO2fluxes. Significant values of the error re-ductionγ are found over most of North America and Eura-sia as well as over South America and central and southern Africa. There is a similar geographical distribution of im-provements during boreal summer months, but with larger values over North America and Eurasia, including the north-ernmost latitudes. Similar calculations for the TCCON net-work show comparable levels of improvement but are more spatially limited, particularly over the Northern Hemisphere. We show there is clear value in combining in situ flask data with the mini-LHR network, with significant improvements in CO2fluxes, particularly over North American and Eurasia. The mobility of mini-LHR sensors allows us to locate them in remote environments where an AERONET site is already established. This includes, in particular, tropical ecosystems where the physical environment is challenging for large-scale instrument installations and at polar latitudes where space-borne measurements are compromised because of low solar illumination and low surface reflectance over snow or ice. This suggests that the mini-LHR network could play a substantive role in an Arctic monitoring network, par-ticularly during spring and autumn months.
Our results demonstrate the complementarity of the mini-LHR and in situ flask networks. Calibrating sensors from the TCCON and mini-LHR networks represent additional ob-servational constraints on CO2 fluxes that rival knowledge inferred from the current in situ observation network over large-scale geographical regions (e.g. North America and Eurasia) and outperform for other regions (e.g. tropics). The in situ networks provide an invaluable record on the changing carbon cycle by putting present-day changes in a historical context, whose value is reduced if they are terminated.
5 Concluding remarks
The development of the mini-LHR technology is ongoing, but this computational study already builds on a growing body of work that has characterized its error budgets and its in-field performance (Wilson et al., 2013; Clarke et al., 2014; Melroy et al., 2015).
However, the modelling study is largely agnostic to the underlying technology. Consequently, a similar result would be obtained, for example, by using a network of Bruker EM27/SUN instruments after they have been modified to withstand inclement weather and can run exclusively on solar power. A growing network of inter-calibrated ground-based remote-sensing units, as part of a global carbon measurement system, must strike a balance between a diffuse network of gold-standard spectrometers (TCCON), a larger network of intermediate (cost–performance) spectrometers (COCCON), and an even larger network of cheaper, less precise au-tonomous spectrometers that can be deployed in high-risk or high-reward environments where we remain data poor (e.g. tropics).
Data availability. Code and data used in this study are available from the authors upon request.
Author contributions. PIP and ELW conceived the study and wrote the paper. LF, with support from JM, led the calculations. All co-authors provided comments on the paper.
Competing interests. The authors declare that they have no conflict of interest.
Acknowledgements. Development of the mini-LHR was sup-ported by the NASA–GSFC Internal Research and Develop-ment (IRAD) programme, the NASA–GSFC Science Innovation Fund (SIF), and the NASA Interdisciplinary Science (IDS) pro-gramme (NNH127DA001N). Work at the University of Edinburgh was partly funded by the NERC National Centre for Earth Observa-tion (NCEO). Paul I. Palmer gratefully acknowledges funding from his Royal Society Wolfson Research Merit Award. We would also like to thank Brent Holben and the AERONET team for their on-going support and Laura Iraci and Jim Podolske from NASA Ames Research Center (ARC) for support with TCCON access and data at NASA–AFRC.
Review statement. This paper was edited by John Worden and re-viewed by two anonymous referees.
References
Aben, I., Hasekamp, O., and Hartmann, W.: Uncertainties in the space-based measurements Of CO2columns due to scattering in the Earth’s atmosphere, J. Quant. Spectros. Ra., 104, 450–459, https://doi.org/10.1016/j.jqsrt.2006.09.013, 2007.
Anderson, G. P., Chetwynd, J. H., Clough, S. A., Shettle, E. P., and Kneizys, F. X.: AFGL Atmospheric Constituent Profiles (0–120 km), Air Force Geophysics Laboratory, Hanscom AFB,
USA, 43 pp., available at: https://apps.dtic.mil/dtic/tr/fulltext/u2/ a175173.pdf (last access: 24 April 2019), 1986.
Basu, S., Guerlet, S., Butz, A., Houweling, S., Hasekamp, O., Aben, I., Krummel, P., Steele, P., Langenfelds, R. L., Torn, M., Biraud, S. C., Stephens, B. B., Andrews, A., and Wor-thy, D.: Global CO2 fluxes estimated from GOSAT retrievals of total column CO2, Atmos. Chem. Phys., 13, 8695–8717, https://doi.org/10.5194/acp-13-8695-2013, 2013.
Butz, A., Hasekamp, O. P., Frankenberg, C., and Aben, I.: Retrievals of atmospheric CO2from simulated space-borne measurements of backscattered near-infrared sunlight: accounting for aerosol effects, Appl. Optics, 48, 3322–3336, 2009.
Camy-Peyret, C., Liuzzi, G., Masiello, G., Serio, C., Venafra, S., and Montzka, S.: Assessment of IASI capability for retrieving carbonyl sulphide (OCS), J. Quant. Spect. Ra., 201, 197–208, https://doi.org/10.1016/j.jqsrt.2017.07.006, 2017.
Clarke, G. B., Wilson, E. L., Miller, J. H., and Melroy, H. R.: Uncertainty analysis for the miniaturized laser heterodyne ra-diometer (mini-LHR), Meas. Sci. Technol., 25, 055204–055209, https://doi.org/10.1088/0957-0233/25/5/055204, 2014.
Commane, R., Lindaas, J., Benmergui, J., Luus, K. A., Change, R. Y.-W., Daube, B. C., Euskirchen, E. S., Henderson, J. M., Kariong, A., Miller, J. B., Miller, S. M., Parazoo, N. C., Ran-derson, J. T., Sweeney, C., Tans, P., Thoning, K., Veraver-beke, S., Miller, C. E., and Wofsy, S. C.: Carbon dioxide sources from Alaska driven by increasing early winter respiration from Arctic tundra, P. Natl. Acad. Sci. USA, 114, 5361–5366, https://doi.org/10.1073/pnas.1618567114, 2017.
Crisp, D., Pollock, H. R., Rosenberg, R., Chapsky, L., Lee, R. A. M., Oyafuso, F. A., Frankenberg, C., O’Dell, C. W., Bruegge, C. J., Doran, G. B., Eldering, A., Fisher, B. M., Fu, D., Gunson, M. R., Mandrake, L., Osterman, G. B., Schwandner, F. M., Sun, K., Taylor, T. E., Wennberg, P. O., and Wunch, D.: The on-orbit per-formance of the Orbiting Carbon Observatory-2 (OCO-2) instru-ment and its radiometrically calibrated products, Atmos. Meas. Tech., 10, 59–81, https://doi.org/10.5194/amt-10-59-2017, 2017. Eldering, A., O’Dell, C. W., Wennberg, P. O., Crisp, D., Gunson, M. R., Viatte, C., Avis, C., Braverman, A., Castano, R., Chang, A., Chapsky, L., Cheng, C., Connor, B., Dang, L., Doran, G., Fisher, B., Frankenberg, C., Fu, D., Granat, R., Hobbs, J., Lee, R. A. M., Mandrake, L., McDuffie, J., Miller, C. E., Myers, V., Natraj, V., O’Brien, D., Osterman, G. B., Oyafuso, F., Payne, V. H., Pol-lock, H. R., Polonsky, I., Roehl, C. M., Rosenberg, R., Schwand-ner, F., Smyth, M., Tang, V., Taylor, T. E., To, C., Wunch, D., and Yoshimizu, J.: The Orbiting Carbon Observatory-2: first 18 months of science data products, Atmos. Meas. Tech., 10, 549–563, https://doi.org/10.5194/amt-10-549-2017, 2017. Feng, L., Palmer, P., Bosch, H., and Dance, S.: Estimating surface
CO2fluxes from space-borne CO2dry air mole fraction obser-vations using an ensemble Kalman Filter, Atmos. Chem. Phys., 9, 2619–2633, https://doi.org/10.5194/acp-9-2619-2009, 2009. Feng, L., Palmer, P. I., Yang, Y., Yantosca, R. M., Kawa, S. R.,
Paris, J.-D., Matsueda, H., and Machida, T.: Evaluating a 3-D transport model of atmospheric CO2 using ground-based, air-craft, and space-borne data, Atmos. Chem. Phys., 11, 2789– 2803, https://doi.org/10.5194/acp-11-2789-2011, 2011. Feng, L., Palmer, P. I., Parker, R. J., Deutscher, N. M., Feist, D.
sensitivity to measurement bias inside and outside Europe, At-mos. Chem. Phys., 16, 1289–1302, https://doi.org/10.5194/acp-16-1289-2016, 2016.
Feng, L., Palmer, P. I., Bösch, H., Parker, R. J., Webb, A. J., Cor-reia, C. S. C., Deutscher, N. M., Domingues, L. G., Feist, D. G., Gatti, L. V., Gloor, E., Hase, F., Kivi, R., Liu, Y., Miller, J. B., Morino, I., Sussmann, R., Strong, K., Uchino, O., Wang, J., and Zahn, A.: Consistent regional fluxes of CH4and CO2inferred from GOSAT proxy XCH4: XCO2 retrievals, 2010–2014, At-mos. Chem. Phys., 17, 4781–4797, https://doi.org/10.5194/acp-17-4781-2017, 2017.
Gurney, K. R., Law, R. M., Denning, A. S., Rayner, P. J., Baker, D., Bousquet, P., Bruhwiler, L., Chen, Y.-H., Ciais, P., Fan, S., Fung, I. Y., Gloor, M., Heimann, M., Higuchi, K., John, J., Kowalczyk, E., Maki, T., Maksyutov, S., Peylin, P., Prather, M., Pak, B. C., Sarmiento, J., Taguchi, S., Taka-hashi, T., and Yuen, C.-W.: TransCom 3 CO2 inversion inter-comparison: 1. Annual mean control results and sensitivity to transport and prior flux information, Tellus B, 55, 555–579, https://doi.org/10.3402/tellusb.v55i2.16728, 2003.
Holben, B. N., Eck, T. F., Slutsker, I., Tanre, D., Buis, J. P., Set-zer, A., Vermote, E., Reagan, J. A., Kaufman, Y. J., Nakajima, T., Lavenue, F., Jankowiak, I., and Smirnov, A.: AERONET - A federated instrument network and data archive for aerosol char-acterization, Remote Sens. Environ., 66, 1–16, 1998.
Keppel-Aleks, G., Toon, G. C., Wennberg, P. O., and Deutscher, N. M.: Reducing the impact of source brightness fluctuations on spectra obtained by Fourier-transform spectrometry, Appl. Op-tics, 46, 4774–4779, 2007.
Krinner, G., Viovy, N., de Noblet-Ducoudré, N., Ogée, J., Polcher, J., Friedlingstein, P., Ciais, P., Sitch, S., and Prentice, I. C.: A dynamic global vegetation model for studies of the cou-pled atmosphere–biosphere system, Global Biogeochem. Cy., 19, GB1015, https://doi.org/10.1029/2003GB002199, 2005. Kuze, A., Suto, H., Nakajima, H., and Hamazaki, T.: Thermal and
near infrared sensor for carbon observation Fourier-transform spectrometer on the greenhouse gases observing satellite for greenhouse gases monitoring, Appl. Optics, 48, 6716–6733, 2009.
Le Quéré, C., Andrew, R. M., Canadell, J. G., Sitch, S., Kors-bakken, J. I., Peters, G. P., Manning, A. C., Boden, T. A., Tans, P. P., Houghton, R. A., Keeling, R. F., Alin, S., Andrews, O. D., Anthoni, P., Barbero, L., Bopp, L., Chevallier, F., Chini, L. P., Ciais, P., Currie, K., Delire, C., Doney, S. C., Friedlingstein, P., Gkritzalis, T., Harris, I., Hauck, J., Haverd, V., Hoppema, M., Klein Goldewijk, K., Jain, A. K., Kato, E., Körtzinger, A., Land-schützer, P., Lefèvre, N., Lenton, A., Lienert, S., Lombardozzi, D., Melton, J. R., Metzl, N., Millero, F., Monteiro, P. M. S., Munro, D. R., Nabel, J. E. M. S., Nakaoka, S. I., O’Brien, K., Olsen, A., Omar, A. M., Ono, T., Pierrot, D., Poulter, B., Röden-beck, C., Salisbury, J., Schuster, U., Schwinger, J., Séférian, R., Skjelvan, I., Stocker, B. D., Sutton, A. J., Takahashi, T., Tian, H., Tilbrook, B., van der Laan-Luijkx, I. T., van der Werf, G. R., Viovy, N., Walker, A. P., Wiltshire, A. J., and Zaehle, S.: Global Carbon Budget 2016, Earth Syst. Sci. Data, 8, 605–649, https://doi.org/10.5194/essd-8-605-2016, 2016.
Liuzzi, G., Masiello, G., Serio, C., Venafra, S., and Camy-Peyret, C.: Physical inversion of the full IASI spectra: Assessment of atmospheric parameters retrievals, consistency of spectroscopy
and forward modelling, J. Quant. Spectrosc. Ra., 182, 128–157, https://doi.org/10.1016/j.jqsrt.2016.05.022, 2016.
Mao, J.-P. and Kawa, S. R.: Sensitivity studies for space-based measurement of atmospheric total column carbon dioxide by re-flected sunlight, Appl. Optics, 43, 914–927, 2004.
Meaures, B. I. D. P. E.: JCM 200:1012: International vocabu-lary of metrology – Basic and general concepts and associated terms (VIM), 3rd Edn., 108 pp., available at: https://www.bipm. org/en/publications/guides/vim.html (last access: 24 April 2019), 2012.
Melroy, H. R., Wilson, E. L., Clarke, G. B., Ott, L. E., Mao, J.-P., Ramanathan, A. K., and McLinden, M. L.: Autonomous field measurements of CO2in the atmospheric column with the minia-turized laser heterodyne radiometer (Mini-LHR), Appl. Phys. B, 120, 609–615, 2015.
Messerschmidt, J., Geibel, M. C., Blumenstock, T., Chen, H., Deutscher, N. M., Engel, A., Feist, D. G., Gerbig, C., Gisi, M., Hase, F., Katrynski, K., Kolle, O., Lavric, J. V., Notholt, J., Palm, M., Ramonet, M., Rettinger, M., Schmidt, M., Suss-mann, R., Toon, G. C., Truong, F., Warneke, T., Wennberg, P. O., Wunch, D., and Xueref-Remy, I.: Calibration of TCCON column-averaged CO2: the first aircraft campaign over Euro-pean TCCON sites, Atmos. Chem. Phys., 11, 10765–10777, https://doi.org/10.5194/acp-11-10765-2011, 2011.
Oda, T., and Maksyutov, S.: A very high-resolution (1 km×1 km) global fossil fuel CO2emission inventory derived using a point source database and satellite observations of nighttime lights, At-mos. Chem. Phys., 11, 543–556, https://doi.org/10.5194/acp-11-543-2011, 2011.
Olsen, S. C. and Randerson, J. T.: Differences between sur-face and column atmospheric CO2 and implications for car-bon cycle research, J. Geophys. Res.-Atmos., 109, D02301, https://doi.org/10.1029/2003JD003968, 2004.
Peylin, P., Law, R. M., Gurney, K. R., Chevallier, F., Jacobson, A. R., Maki, T., Niwa, Y., Patra, P. K., Peters, W., Rayner, P. J., Rödenbeck, C., van der Laan-Luijkx, I. T., and Zhang, X.: Global atmospheric carbon budget: results from an ensemble of atmospheric CO2 inversions, Biogeosciences, 10, 6699–6720, https://doi.org/10.5194/bg-10-6699-2013, 2013.
Reichle, R. H., Koster, R. D., DeLannoy, G. J. M., Forman, B. A., Liu, Q., Mahanama, S. P. P., and Toure, A.: Assessment and En-hancement of MERRA Land Surface Hydrology Estimates, J. Climate, 24, 6322–6338, 2011.
Rienecker, M. M., Suarez, M. J., Gelaro, R., Todling, R., Bacmeis-ter, J., Liu, E., Bosilovich, M. G., Schubert, S. D., Takacs, L., Kim, G., Bloom, S., Chen, J., Collins, D., Conaty, A., da Silva, A., Gu, W., Joiner, J., Koster, R. D., Lucchesi, R., Molod, A., Owens, T., Pawson, S., Pegion, P., Redder, C. R., Reichle, R., Robertson, F. R., Ruddick, A. G., Sienkiewicz, M., and Woollen, J.: MERRA: NASA’s Modern-Era Retrospective Analysis for Research and Applications, J. Climate, 24, 3624–3648, 2011. Rodgers, C. D.: Inverse Methods for Atmospheric Sounding,
The-ory and Practice, in: Series on Atmospheric, Oceanic, and Plan-etary Physics, Oxford Press, Oxford, 2000.
L., Crevoisier, C., Crill, P., Covey, K., Curry, C., Frankenberg, C., Gedney, N., Höglund-Isaksson, L., Ishizawa, M., Ito, A., Joos, F., Kim, H. S., Kleinen, T., Krummel, P., Lamarque, J. F., Langen-felds, R., Locatelli, R., Machida, T., Maksyutov, S., McDonald, K. C., Marshall, J., Melton, J. R., Morino, I., Naik, V., O’Doherty, S., Parmentier, F. J. W., Patra, P. K., Peng, C., Peng, S., Peters, G. P., Pison, I., Prigent, C., Prinn, R., Ramonet, M., Riley, W. J., Saito, M., Santini, M., Schroeder, R., Simpson, I. J., Spahni, R., Steele, P., Takizawa, A., Thornton, B. F., Tian, H., Tohjima, Y., Viovy, N., Voulgarakis, A., van Weele, M., van der Werf, G. R., Weiss, R., Wiedinmyer, C., Wilton, D. J., Wiltshire, A., Wor-thy, D., Wunch, D., Xu, X., Yoshida, Y., Zhang, B., Zhang, Z., and Zhu, Q.: The global methane budget 2000–2012, Earth Syst. Sci. Data, 8, 697–751, https://doi.org/10.5194/essd-8-697-2016, 2016.
Shuur, E. A. G., Bockheim, J., Canadell, J. G., Euskirchen, E., Field, C. B., Goryachkin, S. V., Hagemann, S., Kuhry, P., Lafleur, P. M., Lee, H., Mazhitova, G., Nelson, F. E., Rinke, A., Romanovsky, V. E., Shiklomanov, N., Tarnocai, C., Venevsky, S., Vogel, J. G., and Zimov, S. A.: Vulnerability of permafrost carbon to climate change: Implications for the global carbon cycle, Bioscience, 58, 701–714, https://doi.org/10.1641/B580807, 2008.
Smith, M. D., Wolff, M. J., Clancy, R. T., and Murchie, S. L.: Com-pact Reconnaissance Imaging Spectrometer observations of wa-ter vapor and carbon monoxide, J. Geophys. Res., 114, E00D03, https://doi.org/10.1029/2008JE003288, 2009.
Takahashi, T., Sutherland, S. C., Wanninkhof, R., Sweeney, C., Feely, R. A., Chipman, D. W., Hales, B., Friederich, G., Chavez, F., Sabine, C., Watson, A., Bakker, D. C. E., Schuster, U., Metzl, N., Yoshikawa-Inoue, H., Ishii, M., Midorikawa, T., Nojiri, Y., Kortzinger, A., Steinhoff, T., Hoppema, M., Olafsson, J., Arnar-son, T. S., Tilbrook, B., Johannessen, T., Olsen, A., Bellerby, R., Wong, C. S., Delille, B., Bates, N. R., and de Baar, H. J. W.: Cli-matological mean and decadal changes in surface oceanpCO2, and net sea-air CO2flux over the global oceans, Deep-Sea Res. Pt. II, 56, 554–577, https://doi.org/10.1016/j.dsr2.2008.12.009, 2009.
Uchino, O., Kikuchi, N., Sakai, T., Morino, I., Yoshida, Y., Na-gai, T., Shimizu, A., Shibata, T., Yamazaki, A., Uchiyama, A., Kikuchi, N., Oshchepkov, S., Bril, A., and Yokota, T.: Influence of aerosols and thin cirrus clouds on the GOSAT-observed CO2: a case study over Tsukuba, Atmos. Chem. Phys., 12, 3393–3404, https://doi.org/10.5194/acp-12-3393-2012, 2012.
van der Werf, G. R., Randerson, J. T., Giglio, L., Collatz, G. J., Mu, M., Kasibhatla, P. S., Morton, D. C., DeFries, R. S., Jin, Y., and van Leeuwen, T. T.: Global fire emissions and the contribution of deforestation, savanna, forest, agricultural, and peat fires (1997–2009), Atmos. Chem. Phys., 10, 11707–11735, https://doi.org/10.5194/acp-10-11707-2010, 2010.
Villanueva, G. L., Mumma, M. J., Novak, R. E., Kaufl, H. U., Har-togh, P., Encrenaz, T., Tokunaga, A., Khayat, A., and Smith, M. D.: Strong water isotopic anomalies in the martian atmosphere: Probing current and ancient reservoirs, Science, 348, 218–221, 2015.
Villanueva, G. L., Smith, M., Wolff, M. J., Protopapa, S., Hewagama, T., Mandell, A. M., and Faggi, S.: Planetary Spec-trum Generator (PSG), available at: https://psg.gsfc.nasa.gov/ (last access: 24 April 2019), 2016.
Wilson, E. and McLinden, M.: Miniaturized Laser Heterodyne Ra-diometer for carbon dioxide methane and carbon monoxide mea-surements in the atmospheric column, US Patent No. 8699029 (Filed 2012, Awarded 2014), 2012.
Wilson, E. L., Mclinden, M. L., Miller, J. H., Allan, G. R., Ott, L. E., Melroy, H. R., and Clarke, G. B.: Miniaturized laser heterodyne radiometer for measurements of CO2in the atmospheric column, Applied Phys. B, 114, 385–393, https://doi.org/10.1007/s00340-013-5531-1, 2013.
Wilson, E. L., McLinden, M. L., Miller, J. H., Allen, G. R., Ott, L. E., Melroy, H. R., and Clarke, G. B.: Miniatur-ized Laser Heterodyne Radiometer for Measurements of CO2 in the Atmospheric Column, Appl. Phys. B, 114, 385–393, https://doi.org/10.1007/s00340-013-5531-1, 2014.
Wilson, E. L., DiGregorio, A. J., Riot, V. J., Ammons, M. S., Bruner, W. W., Carter, D., Mao, J.-P., Ramanathan, A., Strahan, S. E., Oman, L. D., Hoffman, C., and Garner, R. M.: A 4 U laser heterodyne radiometer for methane (CH4) and carbon diox-ide (CO2) measurements from an occultation-viewing CubeSat, Meas. Sci. Technol., 28, 035902, https://doi.org/10.1088/1361-6501/aa5440, 2017.
Wolf, J., Asrar, G. R., and West, T. O.: Revised methane emissions factors and spatially distributed annual carbon fluxes for global livestock, Carbon Balance Manage., 12, 16, https://doi.org/10.1186/s13021-017-0084-y, 2017.
Wunch, D., Toon, G. C., Wennberg, P. O., Wofsy, S. C., Stephen, M., Fischer, M. L., Uchino, O., Abshire, J. B., Bernath, P. F., Biraud, S. C., Blavier, F. L., Boone, C., Bowman, K. P., Browell, E. V., Campos, T., Connor, B. J., Daube, B. C., Deutscher, N. M., Diao, M., Elkins, J. W., Gerbig, C., Gottlieb, E., Griffith, D., Hurst, D. F., Jimenez, R., Keppel-Aleks, G., Kort, E. A. I., Park, S., Robinson, J., Roehl, C. M., Sawa, Y., Sherlock, V., Sweeney, C., Tanaka, T., and Zondo, M. A.: Calibration of the Total Carbon Column Observing Network using aircraft profile data, Atmos. Meas. Tech., 3, 1351–1362, https://doi.org/10.5194/amt-3-1351-2010, 2010.
Wunch, D., Toon, G. C., Blavier, -. F., L., Washenfelder, R. A., Notholt, J., Connor, B., Griffith, D. W. T., Sherlock, V., and Wennberg, P. O.: The total carbon column observing net-work (TCCON), Philos. T. Roy. Soc. A, 369, 2087–2112, 2011. Wunch, D., Wennberg, P. O., Osterman, G., Fisher, B., Naylor, B.,
Roehl, C. M., O’Dell, C., Mandrake, L., Viatte, C., Kiel, M., Griffith, D. W. T., Deutscher, N. M., Velazco, V. A., Notholt, J., Warneke, T., Petri, C., De Maziere, M., Sha, M. K., Sussmann, R., Rettinger, M., Pollard, D., Robinson, J., Morino, I., Uchino, O., Hase, F., Blumenstock, T., Feist, D. G., Arnold, S. G., Strong, K., Mendonca, J., Kivi, R., Heikkinen, P., Iraci, L., Podolske, J., Hillyard, P. W., Kawakami, S., Dubey, M. K., Parker, H. A., Sepulveda, E., García, O. E., Te, Y., Jeseck, P., Gunson, M. R., Crisp, D., and Eldering, A.: Comparisons of the Orbiting Carbon Observatory-2 (OCO-2) XCO2measurements with TCCON, At-mos. Meas. Tech., 10, 2209–2238, https://doi.org/10.5194/amt-10-2209-2017, 2017.