Estimation of Significant Differences in
Height and Attributes of Footprint Between
Male and Female Subjects by the Inferential
Statistics
Saba Rashid
1, Anu Singla
2, Shakti Prakash
31
Research Scholar, Dr. A. P. J. Abdul Kalam Institute of Forensic Science and Criminology, Bundelkhand University, Jhansi- 284001, Uttar Pradesh, India.
2
Associate Professor, Dr. A. P. J. Abdul Kalam Institute of Forensic Science and Criminology, Bundelkhand University, Jhansi- 284001, Uttar Pradesh, India.
3
M.Sc., Raksha Shakti University, Ahmedabad- 380016, Gujarat, India.
Abstract- Forensic evidence consists of all the physical items that can be detected by the five body senses and investigated concerning their relevance to the circumstances that appeared at a scene of atrocity. Any physical component can be an origin of clue that expedites the detective in reestablishing the array of manifestations. An order of evidence that can build a time frame for the existence of an entity is the interpretation of footwear impression evidence. Footprints can illustrate both class and individual trace evidence. Impressions can too authorize the detective to find the approximate stature from impression of foot and shoeprint.
Keywords – forensic science, footprints, t- test, Pearson’s correlation coefficient
I.INTRODUCTION
The probable recognition of an anonymous individual is based on the presence of biological traits on the skeleton and the relationship of these components to the socio-cultural existence of the people. Because each and every population exhibits heterogenity, the reckoning of antecedent is a prominent unit of the biological profile [1]. For years, criminal prosecutors and forensic experts have used fingerprints to ascertain identity. More recently, impressions have been revealed to be a fairly reliable identifier. Every human‘s foot leaves an unprecedented set of ridges that produce up a print unmatched by any other human being. As with fingerprints, the footprint‘s pattern is an uncommon peculiarity that can recognize one particular person. An actual footprint can be looked at and coordinated to an existing print on record, such as one from a birth certificate. Footprints are the impressions or images left behind by a human walking or running. They may either be indentations in the ground or something placed onto the surface that was held to the bottom of the foot. The imprint left behind at a crime scene can produce significant evidence to the miscreant of the transgression. Shoes have many prints based on the exclusive design and the wear that it has received–this can benefit to find suspects [2].
Some detective work is rather prompt, with offenders being trailed by the impressions they left in the snow leading from the crime scene to their home or obscure place. This is customarily reported as a whimsical article in news publications [3-4]. Footprints can again authorize the detective to uncover the approximate height from impression of the foot and shoe [5]. The Foot tends to be roughly 15% of the person‘s average height [6-7]. Individualistic characteristics of the footprints like numerous wrinkles, flatfoot character, horizontal and vertical ridges, corns, deformities etc. can stimulate the forensic analyst in situations relating to criminal identification [6]. In some forensic disputes, the demand may likewise arise to determine body weight from the length of the footprints [8]. Foot prints have been exhibited to have figured out the height and the sex of the individual.
II.MATERIALANDMETHODOLOGY
the broadest part of the toe. The length of the foot was measured as the longest distance from the tip of the big toe to edge of the heel region.
The statistical analysis of data was processed with the programs SPSS v20. Initially the statistical analysis consisted in the performance of statistical tests to detect possible significant differences between the values and characteristics of the individuals by comparing measurements taken for one foot and sex; t-tests for related and independent samples were applied according to each case once the assumption of normality was verified by the Shapiro-Wilks test.
III.RESULT
In the suggested study, the data of both males and females was analyzed using the descriptive statistics which reveals that the mean value of height in males was calculated to be 169.65 while that of females it was 157.76. The attributes of the footprint along with the mean and standard deviation are shown in the table 1.
Table -1 Descriptive Statistics of Males and Females
Attributes Males Females
Mean Std. Deviation Mean Std. Deviation
Height 169.653 6.6715 157.760 12.0812
Left Heal Breadth 4.765 .4551 4.266 .5179
Left Toe Breadth 8.940 .6152 7.737 .5349
Left Foot Length 23.691 2.3753 21.085 .9906
Right Heal Breadth 4.592 .4178 4.118 .5212
Right Toe Breadth 9.413 1.1780 8.069 .5247
Right Foot Length 23.522 1.0765 20.867 .9063
For the inferential statistics, independent sample t-test and Pearson correlation coefficient was employed. Independent sample t-test compares two sample means to determine whether the population means are significantly different.
Ho: µ1= µ2 (the population means are equal) H1: µ1≠ µ2 (the population means are not equal) Where,
µ1= the population mean of the attributes of foot in males. µ2= the population mean of the attributes of the foot in females.
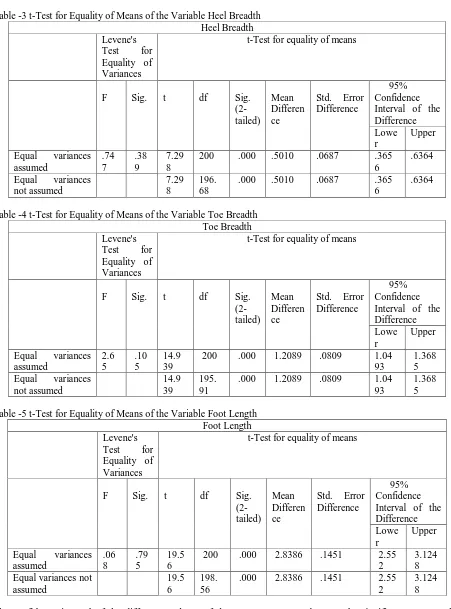
As shown in the tables of the t-test statistics, Levene‘s test for equality of variance column shows that the p-value for height variable is 0.016 which is p>0.001 i.e. p is greater hence accept the null of levene‘s test and conclude that the variance in height of males is not significantly different than that of females thus we will look into the ‗equal variance assumed‘ column. The p-value of rest of the attributes is greater than that of 0.001 likewise similar criteria will be followed for the rest of the parameters (as shown in table 2, 3, 4 and 5).
Table -2 t-Test for Equality of Means of the Variable Height Height Levene's
Test for Equality of Variances
t-Test for equality of means
F Sig. t df Sig.
(2-tailed)
Mean Differen ce
Std. Error Difference
95% Confidence Interval of the Difference Lowe r
Upper Equal variances
assumed
5.95 .016 9.670 200 .000 10.1406 1.0487 8.072 6
12.208 5 Equal variances
not assumed
9.670 192.4 1
.000 10.1406 1.0487 8.072 1
Table -3 t-Test for Equality of Means of the Variable Heel Breadth Heel Breadth Levene's
Test for Equality of Variances
t-Test for equality of means
F Sig. t df Sig.
(2-tailed)
Mean Differen ce
Std. Error Difference
95% Confidence Interval of the Difference Lowe r
Upper Equal variances
assumed .74 7 .38 9 7.29 8
200 .000 .5010 .0687 .365
6
.6364 Equal variances
not assumed
7.29 8
196. 68
.000 .5010 .0687 .365
6
.6364
Table -4 t-Test for Equality of Means of the Variable Toe Breadth Toe Breadth Levene's
Test for Equality of Variances
t-Test for equality of means
F Sig. t df Sig.
(2-tailed)
Mean Differen ce
Std. Error Difference
95% Confidence Interval of the Difference Lowe r
Upper Equal variances
assumed 2.6 5 .10 5 14.9 39
200 .000 1.2089 .0809 1.04
93
1.368 5 Equal variances
not assumed
14.9 39
195. 91
.000 1.2089 .0809 1.04 93
1.368 5 Table -5 t-Test for Equality of Means of the Variable Foot Length
Foot Length Levene's
Test for Equality of Variances
t-Test for equality of means
F Sig. t df Sig.
(2-tailed)
Mean Differen ce
Std. Error Difference
95% Confidence Interval of the Difference Lowe r
Upper Equal variances
assumed .06 8 .79 5 19.5 6
200 .000 2.8386 .1451 2.55
2
3.124 8 Equal variances not
assumed
19.5 6
198. 56
.000 2.8386 .1451 2.55
2
3.124 8
Since p<0.001 is less than our chosen significance level α=0.05, we can reject the null hypothesis, and conclude that the mean of height and all the attributes of footprint of males and females are significantly different.
The bivariate Pearson‘s correlation measures the strength and direction of linear relationships between pairs of continuous variables. It produces a sample correlation coefficient, r, which measures the strength and direction of linear relationships between pairs of continuous variables. By extension, the Pearson correlation evaluates whether there is statistical evidence for a linear relationship among the same pairs of variables in the population correlation coefficient ―rho‖ The correlation between height of males and their other attributes of left footprint (heel breadth, toe breadth and foot length) does not show significant correlation whereas left heel breadth and left toe breadth shows significant correlation at 0.01 level, left heel breadth and left footprint length show significant association at 0.05 level of significance. The right footprint of males shows significant correlation at the 0.01 level between their height and Footprint length as shown in table 6.
Table -6 Pearson‘s Correlation Coefficient between Males Height and other Footprint Parameters
Males Pearson correlation Sig. (2- tailed)
Left Heel Breadth- Left Toe Breadth .340** .000
Left Heel Breadth- Left Footprint Length .247* .013
Height- Right Footprint Length 266** .007
Right Heel Breadth- Right Footprint Length .423** .000 Right Toe Breadth- Right Footprint Length .205* .040
**Correlation is significant at the 0.01 level (2-tailed). *Correlation is significant at the 0.05 level (2-tailed).
As shown in table 7, no association can be seen in the height of females and their left heel and toe breadth whereas height and left footprint length at 0.01 significance level. Level of significance at 0.05, a positive correlation can be seen between left heel breadth and left footprint length. No association can be observed between height and right toe breadth in female subjects. Negative correlation is observable between the height and right heel breadth in females (r=-.367) at 0.01 level of significance.
Table -7 Pearson‘s Correlation Coefficient between Females Height and other Footprint Parameters
Females Pearson correlation Sig. (2- tailed)
Height- Left Footprint Length .610** .000
Left Heel Breadth- Left Footprint Length .426** .000
Height – Right Heel Breadth -.367** .000
Height- Right Footprint Length .399** .000
Right Heel Breadth- Right Toe Breadth .482** .000
Right Heel Breadth- Right Footprint Length .392** .000
**Correlation is significant at the 0.01 level (2-tailed). *Correlation is significant at the 0.05 level (2-tailed).
IV.DISCUSSIONANDCONCLUSION
Moitra, S. et al. (2017) [9] in their study examined the relation between height and foot length among males and females in South Bengal and derive regression formulae between foot length and height of individual. Significant and positive correlation coefficient was observed. Correlation of height with foot length is greater in case of male than female. Foot length is greater relative to stature in men than women. Patel, et al. (2007) [10] carried out a study in Gujarat region. Correlation coefficient between height and foot length as +0.65 in males and +0.80 in females. The study sample of Ibeabuchi, N. M. et al. (2018) [11] comprised of 400 subjects (200 males and 200 females) of Nigerian parentage, aged 18–36 years. Paired t -test revealed the existence of bilateral asymmetry between right and left foot dimensions, except for the foot length in the males (P < 0.05). Significant positive correlation coefficients of stature with the foot length and breadth dimensions were found to range from 0.344 to 0.832 in the study. Krishnan, K. (2008) [12] Examined the relationship of stature to foot size of 1040 adult male Gujjars of North India. Highest correlation coefficient were shown by the toe length measurements (0.79 – 0.86). Agnihotri et al. (2007) [13] Developed a relationship between the foot length and stature using linear and curvilinear regression analysis on a study group comprising of 250 medical students (125 males and 125 females).
Stature, for foot length and for foot breadth. Oberoi, D. V. et al. (2006) [15], standard foot print length (obtained from the statistically derived standard foot print length formula) was used as a benchmark to estimate the sex of the individual.
Based on the results obtained in the suggested study, we can state that there was a significant difference in mean of height and the attributes of footprint between male and female subjects as shown by the inferential statistics of independent sample t-test. Based on the results obtained by Pearson‘s correlation coefficient we can state that the right footprint length in males shows significant correlation with that of height and left and right footprint length of females shows positive significant association with that of height. With these results obtained by correlation on can estimate the height of an individual by the footprint found at the scene of crime.
V.REFERENCES
[1] D.C. Petersen, O. Libiger, E.A. Tindall, R. Hardie, L.I. Hannick, R.H. Glashoff, M. Mukerji, P. Fernandez, W. Haacke, N.J. Schork and V.M. Hayes, ―Complex patterns of genomic admixture within southern Africa‖, PLoS Genet., 9, 2013.
[2] BBC News, 1998. "Footprints help to track down criminals". Accessed 28 July 2006.
[3] BBC News, 2005. ―Vandal caught by his footprints. Accessed‖. 28 July 2006.
[4] BBC News, 2006. ―Footprints in snow lead to court. Accessed‖. 28 July 2006.
[5] K. Krishan and A. Sharma, ―Estimation of stature from dimensions of hands and feet in a North Indian population‖, J Forensic Leg Med.,
Vol. 14, No. 6, pp.327–332, 2007. doi:10.1016/j.jcfm.2006.10.008. PMID 17239650. 2007
[6] K. Krishan, ―Estimation of stature from footprint and foot outline dimensions in Gujjars of North India‖, Forensic Sci. Int., Vol. 175, No. 2–
3, pp.93–101, 2008. doi:10.1016/j.forsciint.2007.05.014. PMID 17590549.
[7] K. Krishan, ―Determination of stature from foot and its segments in a north Indian population‖, Am J Forensic Med Pathol., Vol. 29, No. 4,
pp.297–303, 2008. doi:10.1097/PAF.0b013e3181847dd3. PMID 19259013.
[8] K. Krishan, ―Establishing correlation of footprints with body weight—forensic aspect‖, Forensic Sci. Int., Vol. 179, No.1, pp.63–69, 2008.
doi:10.1016/j.forsciint.2008.04.015. PMID 18515026.
[9] S. Moitra, S.M. Sayantani, N. Lal and A. Dey, ―Estimation of Height from Foot Length in Southern Parts of West Bengal‖, Indian Journal
of Medical Research and Pharmaceutical Sciences, Vol. 4, No. 6, 2017.
[10] S.M. Patel, G.V.Shah and S.V. Patel, ―Estimation of height from measurements of foot length in Gujarat region‖, J Anat Soc India, Vol. 56,
No. 1, pp.25-27, 2007.
[11] N.M. Ibeabuchi, E.A. Okubike, O.A. Olabiyi and M.E. Nandi, ―Predictive equations and multiplication factors for stature estimation using
foot dimensions of an adult Nigerian population‖, Egyptian Journal of Forensic Sciences, Vol. 8, No. 63, 2018.
https://doi.org/10.1186/s41935-018-0094-2
[12] K. Krishnan, ―Estimation of stature from footprint and foot outline dimensions in Gujjars of North India‖, Forensic Sci Int., Vol. 175, No.
2-3, pp.93-101, 2008.
[13] A. K. Agnihotri, B. Purwar, K. Googoolye, S. Agnihotri and N. Jeebun, ―Estimation of Stature from foot length‖, Journal of Forensic and
Legal Medicine, Vol. 14, No. 5, pp.279-283, 2007.
[14] R. Kanwar, A.V. Lakhanpal and S.K. Shrivastava, ―Estimation of Height From Foot Dimensions‖, International Journal of Anatomy and
Research, Vol. 4, No.3, pp.2833-2837, 2016. http://dx.doi.org/10.16965/ijar.2016.349