88
97
New Ultramarine Generations from Egyptian Raw Materials
Morsy M. Abou Sekkina, Nehal A. Salahuddin, A. Elmaghraby and Mona Y. El-Ashry
Chemistry Department, Faculty of Science, Tanta University, Tanta, EGYPT Ceramic Department, National Research center,Cairo, EGYPT.
Available online at: www.isca.in
(Received 09th April 2011, revised 22nd April 2011, accepted 23rd April 2011)
Abstract
New ultramarine generation have been prepared by the solid state mixing and firing technique from Egyptian Raw Materials for the first time. The raw materials used includes kaoline, Na2CO3, charcoal and sulphur precursors. The action of NH4Cl on the obtained ultramarine has been studied using X-ray, UV absorption and DC-electrical conductivity, whereas a midet esr appears. Results of TGA, DTA and electrical conductivity have been undertaken and interpreted for the first time.
I. Introduction
Kowalak et al.1 found that alternative methods of
ultramarine synthesis involving zeolites as principal substances were developed in their lab contrary to the conventional technology. Introduction of sulfur radical precursors into the zeolites allows one to obtain ultramarine with almost negligible emission of SO2 upon calcination. The polysulfides S32- and S62- seem to be the most effective precursors. Modification of hydrothermal synthesis of sodalite in the presence of sulfur compounds (including sodium thiosulfate) don’t result in products of deep blue colouration. Thermal crystallization of the mixture containing kaolin and sodium polysulfides, which were carried out under the industrial conditions, resulted in the product similar to the common ultramarine.
Gobeltz et al.2 investigated the encapsulation of the chromophores into the sodalite structure during the synthesis of the blue ultramarine pigment from metakaolin, sulfur, sodium carbonate and a reducing agent. The insertion of the chromophores occurs during the formation of the sodalite structure and also after its formation by diffusion into the sodalite cages. The possibility of diffusion of the chromophores into the sodalite structure was proved independently by synthesis of blue ultramarine pigments from sodalite, previously
synthesized and mixed with a source of polysulfides.
Kowalak3, investigated that ultramarine analogs are manufactured by roasting zeolites A, X, Y or sodalite impregnated with S radical (Chromophore precursors and optionally reducing agents, e.g. pitch. The precursors are S or alkali metal (preferably Na) polysulfides and the calcination is carried out preferable at 973 – 1173 K in the presence of partial absence of the air followed by reheating at 723 – 1023 K in the air for example, a little pigment was manufactured by roasting comminuted zeolite A mixture with Na2S. 9H2O Combined with pitch.
The loss of weight of the reaction mixture during calcination is < 5% and SO2 emission is significantly lower than in the traditional procedures employing kaolin instead of zeolites.
Tae et al.4 studied the reaction mechanism in
89
97
In the calcination process, the Na sulfides weregenerated by the reductive reaction of Na2CO3, S and rosin at 400 – 5000C, and the NaAlSiO4 was
formed by the synthesis of anhydrous amorphous kaolin and the Na sulfides at ~ 6000C, and the
ultramarine green begun to form at ~ 7000C with the reaction of the NaAlSiO4 and the Na sulfides. In the oxidation process, the S atoms transformed the (S2-) ions of the ultramarine into (S3-) ions, and these reactions caused the ultramarine green to convert the ultramarine blue. The lattice parameter of ultramarine green was increased during oxidation.
Kowalak5, showed that a reaction mixture containing kaolin, soda or other alkaline compound, an agent facilitating incorporation of anion radicals (S3-) into sodalite structure, and reducing agent is roasted at 1023 K and then at ~ 829 K to give ultramarine. The agent facilitating incorporation of anion radicals (S3-) into sodium structure is selected from alkali metal sulfides, preferably sodium sulfide.
Leschewski and Moller6, deduced that when blue ultramarine is fused with HCOONa a white product results without loss of S. This white substance is leuco-ultramarine and is reconnected into coloured product by atmo, by removal of alkali by means of S, by treatment with Cl water of Cl gas or fusion with alkali chlorates or nitrates, blue ultramarine boiled with ethylene chlorohydrine loses most of its Na content by removal of alkali and becomes white. Fusion with NaCl does not restore the colour but fusion with Na2S produces a delicate blue and boiling Na2S solution gives a delicate green.
Jaeger7, showed that the ultramarines are stable toward alkalies but unstable toward acids. Na can be replaces by Li (bluish violet), Rb, Cs, K, Tl (violet), Ag (light yellow), Mg (light blue) and other bivalent metals (colourless) by treatment in aqueous solution at 100 - 120oC. Replacement of S by Se or Te yields blood-red or yellow ultramarine resp. They posses hydraulic properties and resemble permutities in many respects. The substitution of Na by Ag leads to an equal
dependent on concentration and temperature and that of Ag by alkali goes more readily with iodides than with chlorides. Replaceablility and reaction velocity increase with decrease in at. wt. of the alkali metal. All these ultramarines yield spectrograms identical with those of nosean and hauynite. The centered cubic lattice has a 9.13 A.u. The space groupings of the atoms, certain of which appear to be “wandered” are discussed.
Hoffmann8, showed that the sodalite complex possesses an inert silicate component, Na4Al4Si6O24 which in the presence of Na2SO3 takes part in reaction as Na6Al4Si6O24. Ultramarine substrates exhibits characteristic irradiation effects corresponding to their chemical compound and these present a series of colour changes opposite in direction to those obtained with polysulfide S. Irradiation of white-green and violet ultramarine produces colour alterations which no longer occur if the return of the dissociation. S in blue ultramarine into the original complex is prevented. The behaviour of blue ultramarine is not contrary to the assumption that ultramarine is definite S atoms of the various substrates.
Kook et al.9 showed that ultramarine blue was synthesized with Kaolin, sulfur, sodium carbonate, silica and rosin, and its reaction mechanism was investigated. The mixture of the raw materials was calcined at 820oC for 4 hrs (heating rate: 2oC/min) to form the ultramarine green, which was the intermediate of ultramarine blue. The ultramarine blue was finally prepared with the oxidation of the ultramarine green at 500oC. The reaction products and the structural changes of ultramarines appeared in this synthesis were established by power X-ray diffraction analysis and Raman Scattering. The sodium sulfide and the NaAlSiO4 were generated at 500oC and 620oC respectively in calcination process and the ultramarine green was appeared at near 740oC with the reaction of sodium sulfates and NaAlSiO4. Also, the formation of ultramarine blue was caused by the sulfur atoms generated from the oxidation of sodium sulfide which existed in ultramarine green.
90
97
colorimetry-for the first time, correlations betweenEPR, Raman, and colourimetric parameters of these pigments have been established. It’s now established that there isn’t only one blue ultramarine but different shades of blue depending on the relative concentrations of blue and the yellow chromophores. The greenish and reddish shades of blue are characterized by EPR. Raman and colourimetric parameters as suggested by N-Gobeltz et al.10.
Balkus and Kowalak11 worked on the
crystallization zeolites (A, X, hydroxysodalite) in the presence of sulfur compounds in order to incorporate them into the intracrystalline cavities already on nucleation of the zeolite structure. This method of encapsulation has been proved successful for various metal complex compounds.
The major goal of the present investigation is to discover new ultramarine generations from Egyptian raw materials for inorganic pigments industries.
Materials
These above samples (kaolin, anhydrous sodium carbonate, charcoal and sulfur precursor are finely ground together and tightly packed into a small porcelain crucible which is then covered; the crucible is heated to at least a bright red for 1.5 hrs. Then the cover is removed and after firing for an additional 2 hrs and cooling, the ultramarine easily separated forms the uncoloured materials. Composition and condition of preparation of the ultramarine samples are shown in table (1).
X-ray Diffraction analysis: The prepared samples were subjected to Cu-Kα X-ray analysis using Schimadzu (Japan) X-ray diffractometer, using Ni-filter at room temperature in the range 2θ = 10-700C.
Infrared Absorption Spectral Measurements: The room temperature IR absorption spectra were recorded using the solid KBr disk technique and a-Perkin Elmer infrared spectrophotometer in the range 4000 - 200 cm-1.
Electronic Absorption Spectral (UV/VIS) Measurements: The ultramarine (blue and violet)
samples were subjected to UV/Visible absorption spectral measurements using the Nujol mull (glycerine suspension) solid technique and the results were compared to those of commercial ultramarine (produced by Reckit’s Colours of Polifarb). A PYEUNICAM SP 800 spectrophotometer was used in the range 900 to 200 at room temperature.
Thermogravimetrtic analysis (TGA): TGA is measure of the amount and rate weight change of material, as a function of increasing temperature (weight change in temperature). Our measurements were undertaken in the temperature range 0 – 800oC in air using Schimadzu (Japan) Thermal Analysis.
Differential thermal analysis (DTA): DTA is a technique in which a record is made of the temperature difference between the sample and the reference material against time or temperature. DTA records every enthalpy, exothermic and endothermic as caused by structural or chemical changes. In the temperature range (10 mv/cm) from 20 up to 600 with pure Al2O3 as a reference material using DT-30 Schimadzu thermal analyzer in air.
Electronic Spin Resonance Measurements: The Electron Spin Resonance spectra were recorded at X-band frequencies on JES-FE 2 XG, ESR spectrometer at room temperature at the Central Research Lab, Tanta University, Egypt. The magnetic field was swept from 0 to over 8 KG and the calibrated energy was 1 KG with a digital gaussmeter. Several selected samples were investigated and showed identical features. DPPH was used as internal reference.
DC-Electrical Conductivity Measurements: The DC-electrical conductivity was measured using the two terminals DC-method. The pellet was inserted between spring loaded copper electrodes. A Kiethely 175-Multimeter (USA) was employed from room temperatures up to 573 K. The temperature was measured by a calibrated chromel-alumel thermocouple placed firmly at the samples. Measurements were conducted in such a way that at each temperature a sufficient time was allowed for thermal equilibrium.
91
97
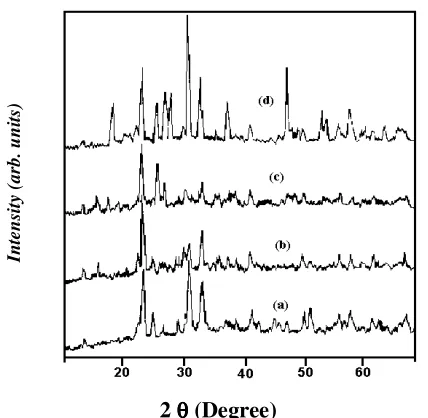
Fig. 1 display the Cu-Kα X-ray diffraction patternof ultramarine samples. It can be easily seen that, the kaolinite phase disappeared completely from X-ray pattern of the ultramarine. This suggests the complete formation of ultramarine instead of kaolinite phase. As deduced by Stoky et al.12 for both natural (Lazurite, Laps lazuh) and synthetic ultramarine show the structure of sodalite. From (ASTM card No. 3 - 0334) ultramarine sample have the formula (Na4Al3Si3O12Cl) sodium aluminium silicate. As illustrated in table 1, the sulfur source affects the structure and the colour of the resulting ultramarine samples, Thus XRD pattern given in fig. 1 show that calcination with sodium polysulfides leads to sodalite structure13.
2 θθθθ (Degree)
Figure-1: The X-ray diffraction patterns of the prepared ultramarine samples containing:
a. sulfur element, b. Na2SO3, c. sulfur and Na2SO3, d. sulfur and Na2SO3 (fired for 10 hr)
In the case of elemental sulfur an unknown structure is formed where as in the case of Na2S and Na2SO3, condensed phases of crystobalite is predominant14. This takes place after firing to 400oC for 2 hrs and at 750oC for hrs. But for samples (5) and (6) pure sodalite structure has been formed after firing at 750oC for 6 hrs. It’s therefore seems that the sulfur compounds are responsible for directing the recrystallization, which means act as templates15, see fig. 1, table 2. The effects of sulfur precursor and firing condition
on the colour and structure of the produced ultramarines.
Since the sodalite structure with formula Na4Al3SiO3O12Cl with cages of 0.6 nm in diameter are stable and they can host variety of molecules (e.g. NaCl in Natural sodalite). Even large molecules containing as many as seventeen atoms can be encapsulated16. So encapsulation of elemental sulfur and sulfur precursor is available. The calcination at high temperature (~ 800oC) was usually conducted with reductive agent (Pitchtar). The resulting samples show intense blue colouration similar as natural ultramarine. The interesting structure transformation towards sodalite was noticed for impregnated zeolites A, X, Y upon heating at temperatures higher than 600oC17. X-ray patterns also display that most of peaks are characteristics to synthetic ultramarine nearly at the same positions as those of sodalite structure but my be shifted to lower 2 θo i.e. increase d-spacings. This is ascribed to the encapsulation of either sulfur element or sulfur precursor in the sodalite cages. These are of larger diameter than that of chloride in natural sodalite. In natural sodalite the maximum intensity is that of peak at 2θ - 24.52o but in our synthetic ultramarine samples, the maximum intensity is that of peak at 2 θ ≅ 24o for samples (3) and (4) that containing Na2S2O3 and Na2SO3 which is similar to that of natural sodalite on the other hand we found that the maximum intensity is that of peak at 2 θ≅ 32o for sample (5), (6) (These samples are of blue and intense blue colour. This is interpreted on the basis of formation of other ultramarine phase.
Fig. 2 shows the effect of adding NH4Cl on the values of 2θ and (d Å) of ultramarine blue (containing S and Na2SO3). We found that, the maximum intense peak is that appear at 2θ = 28.33o shifted to lower 2θ value in a comparison to ultramarine blue containing (sulfur element and Na2SO3). Nearly all characteristic 2θ values of our synthetic ultramarine shifted to lower 2θ value (higher d Å) values mean that Cl- ions replaces S3- radical and thus causing fading of blue colour. It has been found that upon the addition of NH4Cl to ultramarine sample prepared by using elemental
In
te
n
si
ty
(
a
rb
.
u
n
it
92
97
sulfur and Na2SO3 as sulfur precursor we foundthat the blue colour undergo faddening and become violet. The maximum intense peak at 2θ≅ 32o that characteristic for sodalite, shifts to lower 2θ value (increased d-spacing) whereas S3- radicals are responsible for blue colour.
2 θθθθ (Degree)
Figure-2: The X-ray diffraction patterns of the prepared ultramarine blue and violet containing:
a) Sulfur as sulfur precursor.
b) Sulfur as sulfur precursor and NH4Cl
The IR absorption spectral bands of ultramarine samples appear in the medium 535 cm-1 and 1123 - 1129 cm-1 region24 (Fig. 3. and Table 3). It can easily be seen that, the IR spectra modes in this region are believed to originate from S-3 & S-2 in a sodium alumino-silicate matrix Na8[Al6Si6O24] Sn18. It has been found that the IR absorption bands at 1123 - 1125 cm-1 suffers shift to shorter wave number (red shift) in ultramarine samples containing S element to ultramarine samples containing S and Na2SO3 as sulfur precursor associated with increase in the intensity of the blue colour of the synthetic ultramarine19. The IR absorption spectral band at 624 cm-1 is due to Si-O stretching vibration20. The IR absorption bands appearing at ≅ 3428 cm-1 and 1627 cm-1 are characteristic for water of crystallinity.
The ultramarine samples were subjected to UV/visible absorption spectral measurements using
Wave number (cm-1)
Figure-3: The infrared absorption spectra of the prepared ultramarine samples containing:
a) Sulfur element b) Na2S
c) Na2S2O3 d) Na2SO3
e) Sulfur and Na2SO3
glycerin suspension15 and they were comparable to those of commercial ultramarine (produced by Reckit’s colours of polifarb). The estimation was verified by electronic spectral assignments. The correlation between the absorbance measured for the samples and the wave number. Fig. 4 indicates the maximum intensity of the band at ~ 610 nm for the sample prepared with poly sulfide (5,6). The highest intensity of blue colour of the above two samples could result from feasible formation of S3- radicals from S3 anion21. The maximum of this absorption peak are slightly shifted towards higher frequency blue shift (604 nm - 606 nm) compared to that of commercial ultramarine 610 nm. There is other band notable in the spectral at ~ 370 nm. This band is assigned to S2 species21. The absorbance of this band is considerably higher for polysulfides than for sulfide or elemental sulfur. The intensity of this peak does not depend considerably on sulfur number21. The band appears at ~ 610 nm was
shifted to lower frequency for nearly prepared samples (1), (2), (3), (4), (5), (6), (7). We deduced that the maximum intensity of this peak depends considerably on the calcination time as well as on the sulfur number (or sulfur precursor). It was
In
te
n
si
ty
(
a
rb
.
u
n
it
s)
T
ra
n
sm
it
ta
n
ce
(
a
rb
.
u
n
it
93
97
noted that high firing temperature duringultramarine synthesis led to deep blue colouration (see fig. 4). There is also another electronic band appearing at ~ 238 nm the absorbance of this band increase with colour intensity and sulfur precursor increases. It has been found that the absorbance of the band at 604 nm decreases as sulfur precursor decrease and also by the addition of ammonium chloride to either prepared samples or to its starting mixtures (fig. 4).
Wavelength (nm)
Figure-4: Electronic absorption spectra of the prepared ultramarine samples containing:
a) Sulfur element b) Sulfur element and NH4Cl
c) Na2S d) Na
2S2O3
e) Contain Na2SO3 f) Sulfur and Na2SO3 g) Sulfur and Na2SO3 (fired for 10 hr)
Figs. 5 and 6 represent the TGA and DTA curves of ultramarine samples containing sulfur as sulfur precursor, the two endothermic peaks at 95.13oC and 772.93oC and three exothermic peaks with maximum at 170.23oC, 245.42oC and 353.95oC. The first endothermic peak at 95.13oC which is accompanied by 1.84% weight loss (see DTA curve fig.5 is associated to dehydration of humidity water content22 and the second broad endothermic peak at 772.930C which is accompanied by 1.10%
weight loss (see DTA curve fig. 6), is due to CO2
evolution and oxygen uptake (oxidation) during the formation of ultramarine blue. The first exothermic peak at 170.230C is accompanied by 5.44% weight
gain (see TGA curve) is assigned to the first step of
partial oxidation of charcoal and evolving CO/CO2 during the formation reaction. The two exothermic peaks at 245.420C and 353.95oC which are
accompanied by 1.95% and 1.68% weight gain (see TGA curve fig. 5) are assigned to the second step in the parital oxidation of charcoal and evolving CO/CO2 during the formation reaction. The weight loss caused by evolving SO2 is almost negligible15. Thus, result of TGA and DTA for these faint blue ultramarine samples are in full agreement and support one another.
Figure-5: The thermogravimetric analysis (TGA) of ultramarine sample containing sulfur element For the sample with sodium sulfite (Na2SO3) as sulfur precursor fig. 7 and 8 represents the TGA and DTA curves of the sample. Two enothermic peaks are observed with maxima at 102.65oC and 442oC. Other three exothermic peaks are observed with maximum at 197.02oC, 242.36oC and 360oC. The first endothermic peak at 102.62oC which is accopained by -5.08% weight losses (see TGA curve fig. 9) is associated to the dehydration of humidity H2O content22. The second endothermic peak at 440oC (see DTA curve fig. 8) is assigned to oxygen uptake (oxidation) and CO2 evolution during the formation of ultramarine.
The first exothermic peak at 197.02oC which is accompanied by - 5.08% weight loss (see DTA curve fig.8) is assigned to the first step in the
A
b
so
rb
a
n
ce
(
a
.m
.)
W
ei
g
h
t
(w
t.
%
)
94
97
Figure-6: The differential thermal analysis (DTA) of ultramarine sample containing sulfur element
partial oxidation of charcoal and evolving CO/CO2. The two stepwise exothermic peaks at 242.38oC and ≅ 360oC which is accompanied by 1.75% weight gain (see DTA curve Fig. 8) are assigned to the second step in the partial oxidation of charcoal and evolving of CO/CO2. The weight loss caused by caused by evolving of SO2 is negligible15. Thus, results of TGA and DTA are in full agreements for these blue ultramarine samples and support one another.
Figures: 9 and10 display the ESR spectra of blue ultramarine (containing S and Na2SO3 fired at 750oC for 3 h) and deep blue ultramarine (containing S and Na2SO3 fired at 750oC for 10 hr), respectively. Their calculated g values are found to be (g = 1.93) for the blue ultramarine and (g = 1.94) for the deep blue ultramarine as shown in Figs. (9,10). It was established that the presence of S3- radicals were confirmed by ESR15 and their ESR signal anistropy can result from the extra cages S3- radicals15. In our investigated ultramarine sample, ESR data indicated further anisotropy comparing with earlier investigators15. This explains the more colour deepening in our deep blue ultramarine sample regarding our mode of synthesis and raw material included to modify the product for industry.
Figure-7: The thermogravimetric analysis (TGA) of ultramarine sample containing Na2SO3
Figure-8: The differential thermal analysis (DTA) of ultramarine sample containing Na2SO3
Figures: 11 and 12 display variation of DC-electrical conductivity (log σ) as a function of reciprocal of the absolute temperature (1000/T)K-1 for synthesized ultramarine. It can easily be shown that, the material investigated is semiconductor because of the positive as shown in figures 11 and 12. In certain region of the curve, ultramarine sample show metallic conduction in addition its metallic semiconducting character. The ultramarine sample (containing sulfur element as sulfur precursor and fired at 750oC for 4 h), is a semiconductor in the range 318 – 673 K. In the range 318-498 K the ultramarine sample behaves as extrinsic semiconductor so the 498 K corresponds to transition from extrinsic to intrinsic semiconduction mechanism.
W
ei
g
h
t
(w
t.
%
)
W
ei
g
h
t
(w
t.
%
)
W
ei
g
h
t
(
w
t.
%
)
95
97
+
ppm
Figure-9: ESR Spectra at room temperature for ultramarine sample containing sulfur element
ppm
Figure-10: ESR Spectra at room temperature for ultramarine sample containing sulfur element
Applying the Arrhenius plot equation [23] σ = σo e-∆E/KT
Where σ is the electrical conductivity at temperature T, σo is the pre-exponential factor, K is the Boltzmann’s constant and T is the absolute temperature. The intrinsic activation energy for electric conduction is calculated to be 0.041 eV in the temperature range 498 – 673 K. Thus the corresponding energy gap is evaluated to be 0.082 eV. The ultramarine sample (3) behaves as a semiconductor in the range 293 – 688 K, on the same proceeding rule, at the temperature range 298 – 473 K investigated; this ultramarine sample (3) behaves as extrinsic semiconductor. The 473 K is the transition temperature from extrinsic semiconductor to intrinsic semiconductor. In the range 473 – 673 K, there is intrinsic semiconduction. After applying Arrhenius plot, the activation energy for electric conduction is calculated to be 0.816 eV in the temperature range
investigated. It is generally accepted that the presence of S3- is a prerequisite step for semiconductivity in prepared samples and this formation of radical cause current flow. For ultramarine sample (5), the material is semiconductor in the temperature range 398 – 838 K. In the range 398 – 563 K this ultramarine sample (4) behaves as intrinsic semiconductor while in the temperature range 563 – 838 K behaves as extrinsic semiconductor. The 563 K being the transition temperature from extrinsic to intrinsic semiconductor. Applying the Arrhenius plot, the activation energy for electric conduction is calculated to be 0.044 e.V in the temperature range 563 – 838 K. The induced metallic conduction mechanism in the extrinsic range (low temperature) is due to thermal decomposition. Our prepared ultramarine sample (6) is semiconductor in the range 313 – 753 K. In the range 313 – 463 K ultramarine sample (6) behaves as extrinsic semiconductor with a transition temperature of 463 K from extrinsic to intrinsic semiconductor. Applying the Arrhenius plot, the activation energy for electric conduction is calculated to be 0.099 eV in the temperature range 463 – 753 K. For our prepared ultramarine violet sample (7), there are two conduction mechanism appear to operate as follows: The first being the metallic conduction mechanism in the extrinsic range (318 – 403 K) may due to the presence of NH4 at low temperature and this greatly enhance some rearrangements of the electronic band structure of our prepared ultramarine violet sample. This inflection in the conductivity temperature (fig. 11) is interpreted on the basis of the occurrence of phase changes as detected from the DTA curve indicating its endothermisty accompanied with colour faddening. The second being the semiconducting mechanism in the temperature range 408 – 623 K, After applying Arrhenius plot, the activation energy for electric conduction is calculated to be 0.073 eV in the temperature range 453 – 623 K, thus the corresponding energy gap is calculated to be 0.146 eV.
From Table (3) it can easily be seen that the activation energy for intrinsic semiconduction and hence the corresponding Eg decrease in the direction from sodium thiosulfate Na2S2O3
In
te
n
si
ty
(
a
rb
.
u
n
it
s)
In
te
n
si
ty
(
a
rb
.
u
n
it
96
97
containing ultramarine (0.041 eV). Thus thesemiconductivity is modified by sulfur addition, then Na2SO3, NH4Cl + S, Na2SO3 + S and further by Na2S2O3.
Table-2: Characterization and band assignment of the infrared absorption bands (cm-1) of ultramarine samples (1,2,4,5,6).
1.0 1.5 2.0 2.5 3.0 3.5
-7.5 -7.4 -7.3 -7.2 -7.1 -7.0 -6.9 -6.8 -6.7 -6.6 -6.5 -6.4 -6.3 -6.2 -6.1 -6.0 -5.9 -5.8
(1000/T)K-1
L
o
g
σσσσ
with sulfur element with S + NH4Cl
Figure-11: The variation of DC-electrical conductivity (log σσσσ) versus reciprocal of absolute temperature (1000/T)K-1 for ultramarine samples.
Figuer-12: The variation of DC-electrical conductivity (logσσσσ) versus reciprocal of absolute
temperature (1000/T) K-1 for ultramarine samples
Table-1: The effect of the sulfur precursor on the structure and the colour of the prepared ultramarines Sample S3- precursor Colour Calcination
temperature
Time (hrs) Structure after calcination
U
ltr
am
ar
in
e
bl
ue
S Light blue 400oC 2 Unknown
S2O3 Light blue 750oC 4 Sodalite
S2O3 Blue 750oC 6 Sodalite
SO3 Blue 750oC 3 Sodalite
SO3 Blue 750oC 6 Sodalite
Na2SO3 + S Blue 750oC 4 Sodalite
Na2SO3 + S Deep blue 750oC 4 then 6 Sodalite
Na2S Gray 750oC 6 Sodalite
Ultramarine violet. Na2SO3 + S +
NH4Cl
Violet 750oC 4 Sodalite
1.0 1.5 2.0 2.5 3.0 3.5
-7.6 -7.5 -7.4 -7.3 -7.2 -7.1 -7.0 -6.9 -6.8 -6.7 -6.6 -6.5 -6.4 -6.3 -6.2 -6.1 -6.0 -5.9
(1000/T)K-1
L
o
g
σσσσ
with sulfur element with Na2S2O3
with Na2SO3
97
97
Table-2: Characterization and band assignment of the infrared absorption bands (cm-1) of ultramarinesamples (1,2,4,5,6)
Ultramarine samples
Band assignment of the most
(1) (2) (4) (5) (6) characteristic absorption bands
3427b 342m 3419b 3428m 3429m Asymmetric and symmetric stretching vibration of H2O.
1623s 1614v.w 1633s 1628w 1627v.w Bending vibration mode of H2O.
1127s 1123m 1129m 1123m 1126m S3- & S2- in a sodium alumino-silicate matrix
1001v.s 1012m 1002s 1025w 1026w Associated with the Si-O stretching vibration.
534w 536w S3- & S2- in a sodium alumino-silicate
matrix.
623m 624v.b 624v.s Silica spectrum Na-O stretching on vibration and also due to SiO stretching vibration
Table-3: The transport data for the prepared ultramarine blue sample
Ultramarine No.
Composition
Intrinsic Activation energy
(∆∆∆∆ Eo eV)
Energy gap (Eg eV)
(1) Kaolin + Na2CO3 + S + Charcoal 0.041 0.082
(2) Kaolin + Na2CO3 + Na2S2O3 + Charcoal 0.816 1.632
(4) Kaolin + Na2CO3 + Na2SO3 + Charcoal 0.0435 0.087
(6) Kaolin + Na2CO3 + S + Na2SO3 + Charcoal 0.099 0.198
(7) Kaolin + Na2CO3 + Na2SO3 + S Charcoal + NH4Cl 0.073 0.146
References
1. Kowalak S., Stawinski K., Walowska R., and Zadrazona E., Zeolite Callog, 3rd (Pub. 1998),
113, (1997)
2. Gobeltz N., Demontier A., Leieur J., and Duheyon C., J. Chem. Soc. Faraday Trans.,
94(15), 2257 (1998)
3. Kowalak S., Pol. Pt 172, 362 (Cl. Co 9 Cl/32), (1997)
4. Tae Y., Yoon C.Y., and Woong H.S., Shigen to Sozai, 114(2), 106 (1998)
5. Kowalak S., Pol. Pt. 171, 246 (Cl. CO9C1/32) (Pol) (1997).
6. K. Leschewski and H.Moller, J. Appl. Phys.,
65, 250 (1932).
7. Jaeger F.M., Bull J., Ceram. Soc., 53, 183, (1930)
8. Hoffmann J., anorg Z. and Allgem, J. Chem., Soc., 189-91 (1930)
98
97
10.Gobeltz N., Demortier A., Lelieur J. P. andDuhayon C., J. Chem. Soc., Faraday Tran.,
94(5), 677 (1998)
11.Balkus K. J., and Kowlak S., U. S. Patent S, 167, 942 (1992)
12.Stoky G. D., Srdanov Harrison W.T.A., Gier T.E., Keder N.L., Moran K.L., Haug K., and Metiu H.I., J. ACS Symposium series 499, 294 (1992)
13.Kowalak S., Pulish Patent Appl., P-302065.
14.Kowalak S., Stawinski K., Walawska R., and Zadro E., J. Chemia., 16, 212, (1999)
15.Kowalak S., Strozyk M., Pawlowska M., Miluska M., and Kania J., Studies in Surface science and Catalysis, 105, Elsevier Science BV (1997)
16. Seel F., J. Chemia, 5, 69 (1994)
17. Kowalak S., Polish Patent ppl., P – 301761 167 (1992)
18. Wieckowski A.B., Proc. Ramis-79, Poznan, 265 (1979)
19. Karranov J. C., J. Inorganic Chem., 5, 3808
(1986)
20. Bouhet C., and Lafont R., J. Acad. Sci., 226,
1263, (1948)
21. Kera Y., J. Bull. Chem. Soc. Jpn. 57, 1478 (1984)
22. Zurkova L., Sucha V., J. Thermochim. Acta.,
98, 255, (1986)
23. Abou-Sekkina M.M., J. Phys. Stat. Sol., (a)