316
MODELING MICRO-INDENTATION TEST BY USING FINITE
ELEMENT METHOD TO ESTIMATE MECHANICAL
PROPERTIES AND EXTRACT STRESS STRAIN CURVE
Ahmed. F. Elmisteri, Abdelbaset R. H. Midawi, Farag M Shuaeib Mechanical Engineering Department, University of Benghazi
Abstract
317
I.
INTRODUCTION
An instrumented indentation test or sometimes called depth-sensing indentation instrument is a test used to obtain mechanical properties such as hardness, Young’s modulus, and yield strength by calculation from an indenter load-displacement curve. This test can be performed on a microscopic scale and on the field measurement as it is considered as a non-destructive testing method. Fig. (1) shows the test on a pipe in operation.
Figure 1: Automated Ball Indentation (ABI) test Machine (ABI Services, LLC, 2019)
318
indentation method and consideration to the error sources like error due to pile-up is a way to make it more accurate. Test procedures and concepts are still demanding to improve the method that was introduced before 10 years (W.C. Oliver et al.1992). Recently, good agreement between experiment Nano indentation hardness test for bulk material and finite element simulation in two-dimensional (2-D) axisymmetric model and a three dimensional (3-D) model have been obtained by using finite element ABAQUS code (Nurot Panich1 et al.2004). Numerical simulations of pure copper, pure titanium, pure iron and copper film were obtained using ABAQUS. It is found that the result depended greatly on mesh size, indenter radius and the hardening law used (J.D. Bressan et al. 2004). Furthermore, a finite element model for spherical indentation test for metallic substrates had been developed, and the result was found to be relatively in close agreement to experimental data with very minor effect of Poisson’s ratio on the load displacement curve, but for polymeric materials was less successful because of the effects of anisotropy strain rate dependence e.g., viscosity (John D. Clayton et al. 2005). Continuous instrumented indentation test with the Oliver–Pharr’s method using Vickers's indenter under load values from (10 to 100 N) was performed to determine the mechanical properties of Carbide / aluminum composites. For Vickers hardness numbers, determined by the Oliver– Pharr’s method and by conventional hardness test, measurements are found to be in good agreement (Eduard Kimmari et al. 2006). Chi Chen (2009), concluded that finite element method (FEM) is an effective tool for simulation of Nano-indentation test on metallic films and limitation caused by simplification of models and assumptions not be neglected (Chi Chen,2009 et al. 1982). Abdelbaset Midawi et al. (2016), had found good agreement between yield strength obtained from instrumentation hardness test and yield strength obtained from tensile test for weld zone of X80 pipeline steel (Abdelbaset R. H. Midawi et al. 2016). Therefore, in this study, finite element method is adopted to build the indentation model with different indenters geometries in order to understand the contact properties for each indenter shape and to evaluate the test using different materials. After model building, the target is to determine the FE load-displacement curves and compare it with the experimental curves to validate the FE models. Then after model validation a sensitivity analysis is performed by the changing friction coefficient, boundary condition and strain hardening exponent to find the effect of that on the load-displacement curve. Then the mechanical properties and the stress-strain curves are generated and compared with experimental values.
II.
THEORETICAL BACKGROUND
319
Figure 2: Schematic illustration of an instrumented indentation system
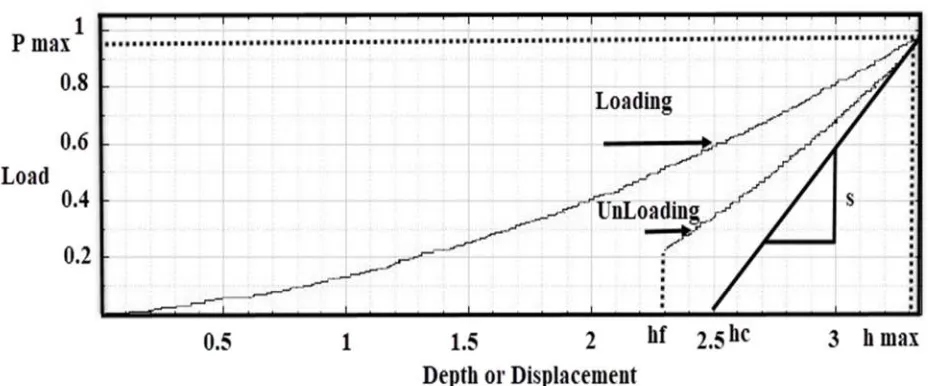
Figure 3: Load-Displacement curve for indentation test
The hardness can be found by dividing the maximum load by the area of contact or project area, which is determined by depth of the impression and the known angle or radius of the indenter.
(1)
The Oliver–Pharr’s method was originally developed to measure the hardness and elastic modulus of a single-phase elastic-plastic material from the indentation load– displacement curve with sharp indenters, such as Berkovich tip. It has been proven that this method can also be applied in any axisymmetric indenter geometries, including a sphere. As shown in equation (2) the Oliver– Pharr’s method begins by fitting the unloading portion of the indentation load– displacement data to the power-law relation.
ℎ ℎ (2) Where
, are the fitting parameters
ℎ is the final depth after complete unloading.
320
using it in equation (4) the Reduced modulus can be found as follows: (3)
S √ E∗ A (4)
Where A is the project area.
For spherical indenter according to Multiple-point unloading method the project area equal to:
A ∗ (5)
2 ∗ "#∗ ℎ (6) Where:
"# is the indenter radius.
ℎ is the plastic penetration depth.
For Vickers indenter the relationship between the projected area A of the indentation and the diagonal diameter d is:
$ &'(% ).+,-./+% (7)
Thus:
0 1∗23 (8)
Where 4 is the correction factor equal to 1.0124 for Vickers indenters .
According to Hertz theory the Reduced modulus or the combined modulus of the indenter and the specimen 1∗ is given by equation (9) as follows:
)
5∗ )6 7 %
5
8
)679%
59 (9)
Where
19 :9 the elastic modulus and Poisson’s ratio of the indenter
1 : the elastic modulus and Poisson’s ratio of the specimen.
At this stage, determination of the modulus of elasticity for the specimen is possible as shown in equation (10).
1 1∗∗ 1 : ) (10)
Where )679%
59 is too small because the indenter
is totally rigid (means 19 has big value ).
To extract the stress-strain curve from the load-displacement curve by configuration of the constraint factors, which connect between the normal stress-strain and indentation stress strain as shown (D. Tabor.1951):
σ=>> ?@AB
C (11)
321
value depends on the material. Generally, the indentation strain constraint factor β is considered to be equal to 0.2, and the indentation stress constraint factor ψ ranges from 2.8 to 3.2 (F. Yang et al. 2008).
As shown in equation (13) the indentation stress equal to the indentation applied load divided by the contact or project area presented in equation (5).
H#G I (13)
According to Oliver –Pharr method, the radius of contact for spherical indenter calculates from the following equation (14).
22 ∗ "# Jℎ K.L-∗M N ℎ K.L-∗M (14)
Where
ℎ is the penetration depth.
Also, Tabor defines the indentation strain as
D#G 0.2QPR (15)
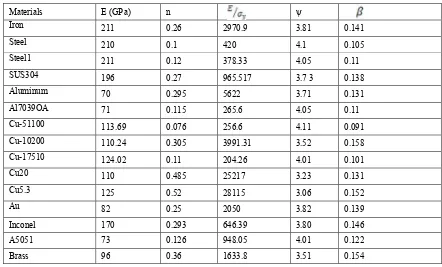
Table (1). Constraint factors for different materials (Baoxing Xu et al. 2010).
Materials E (GPa) n ψ
Iron 211 0.26 2970.9 3.81 0.141
Steel 210 0.1 420 4.1 0.105
Steel1 211 0.12 378.33 4.05 0.11
SUS304 196 0.27 965.517 3.7 3 0.138
Aluminum 70 0.295 5622 3.71 0.131
Al7039OA 71 0.115 265.6 4.05 0.11
Cu-51100 113.69 0.076 256.6 4.11 0.091
Cu-10200 110.24 0.305 3991.31 3.52 0.158
Cu-17510 124.02 0.11 204.26 4.01 0.101
Cu20 110 0.485 25217 3.23 0.131
Cu5.3 125 0.52 28115 3.06 0.152
Au 82 0.25 2050 3.82 0.139
Inconel 170 0.293 646.39 3.80 0.146
A5051 73 0.126 948.05 4.01 0.122
Brass 96 0.36 1633.8 3.51 0.154
III.
FINITE ELEMENT SIMULATION
A.
Materials and Experimental Test:
As a reference material, AISI 1010 was chosen. the mechanical property for this material is as shown in Table (2)
322
Materials Young’s modulus E
(GPa)
Yield strengthHS
Poisson’s ratio
AISI1010 205 220 0.2
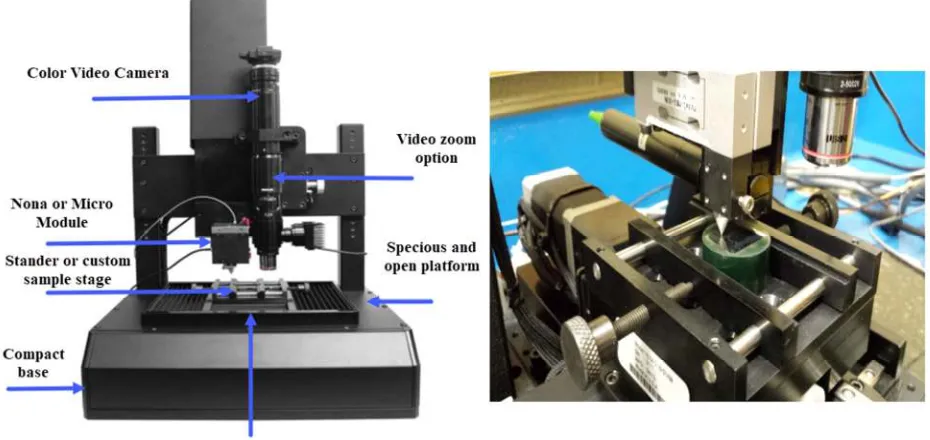
The indentation test experiment was performed using the Nanovea mechanical testers as shown in fig (4), at a maximum load 10N for spherical indentation and 4N for Vickers indentation. The unloading curves were used to derive the modulus values by the analytical technique developed by Oliver and Pharr.
Figure 4: Micro-Nano hardness test machine CB500
B.
Modelling procedure
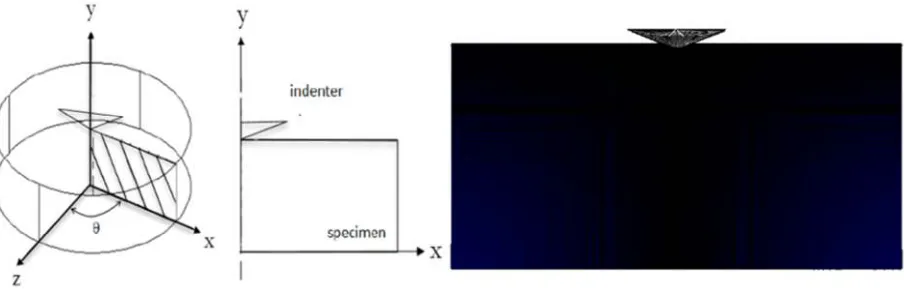
In this model, the indentation test of bulk materials with isotropic elastic and plastic properties was simulated by the capability of the ABAQUS finite element (FE) code. In (Fig.5) and (Fig.6) represent the View of the Spherical and Vickers indentation model. Because of the symmetries of both geometry and loading condition, the present indentation problem can be reduced to an axisymmetric (2-dimensional) model. The specimen is modeled as an axisymmetric geometry with four-node axisymmetric quadrilateral continuum elements with reduced integration (CAX4R in ABAQUS). Since the indenter is much stiffer than the specimen, the indenter is considered to be perfectly rigid and is modeled as analytical rigid surface. Because at the assumed total rigidity for the indenter no need to mesh the geometry of the indenter, where no deformation happens during the test.
323
Figure 5: Diagrams show that a 3-D indentation problem can be solved using a 2-D axisymmetric model for Spherical indentation.
Figure 6: Diagrams show that a 3-D indentation problem can be solved using a 2-D axisymmetric model for Vickers indentation
.
The specimens are modeled with 38416 four-node axisymmetric reduced integration elements (CAX4R element type) for spherical indentation and 43681 for Vickers
324
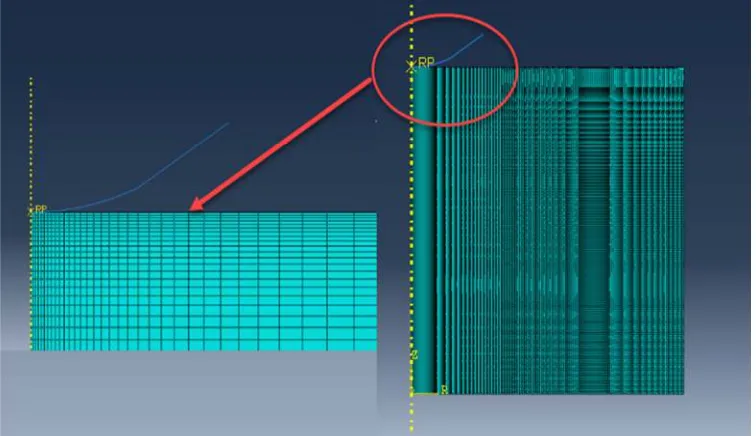
Figure 7: Meshing density illustration for spherical indentation (38416 elements)
Figure 8: Meshing density illustration Vickers indentation (43681 elements)
325
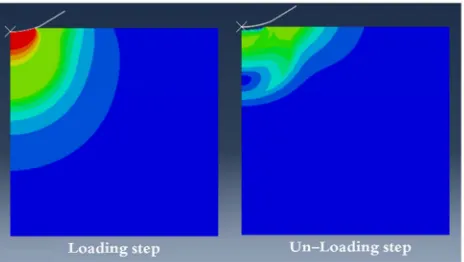
Figure 9: Loading and Unloading steps for spherical indentation (Colors represent Stress, Von-Mises)
Figure 10: Loading and Unloading step for Vickers indentation (Colors represent Stress, Von-Mises)
326
original point, centerline and b The Micro indentation model developed was based on the following assumptions:
There is a perfect interface between the indenter and the substrate so that the indenter
and the substrate will not be separated during the indentation process
The friction between the indenter tip and the specimen surface is assumed to be zero. In the calculation, the elastic deformation occurs in the beginning of the process. The
specimen starts to deform plastically when the HT#UEU reaches to the yield criterion is the yield strength (HS).
HT#UEU 2VW6V% %X V%6VY %X VY6VW % (13)
where H), H and H. are the three principle stresses. There is no strain hardening behavior of the specimen considered in the model.
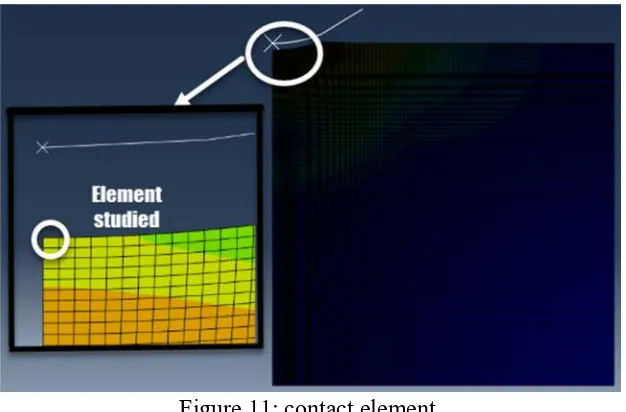
The indentation stress and the indentation strain values were obtained directly from the simulation program postprocessor routines where the element under the indenter studied as shown in Fig (11).
Figure 11: contact element.
It is found that, the engineering stress-strain converted directly from the indentation stress-strain curve of a deep spherical indentation test has an agreement with effective stress-strain value defined by equations (11) and (12). The stress and strain constraint factor have empirical values according to Taber's theory and depended on material properties as shown in Table (1) above (Baoxing Xu et al. 2010).
IV.
RESULTS AND DISCUSSIONS
A.
Model Validation
To verify the accuracy of the results obtained from FE simulations, as mentioned previously micro-indentation experiments were conducted with a Nanovea mechanical tester. The indenter used for the experiment was the spherical indenter 200 µm diameter and Vickers indenter with 136K.
327
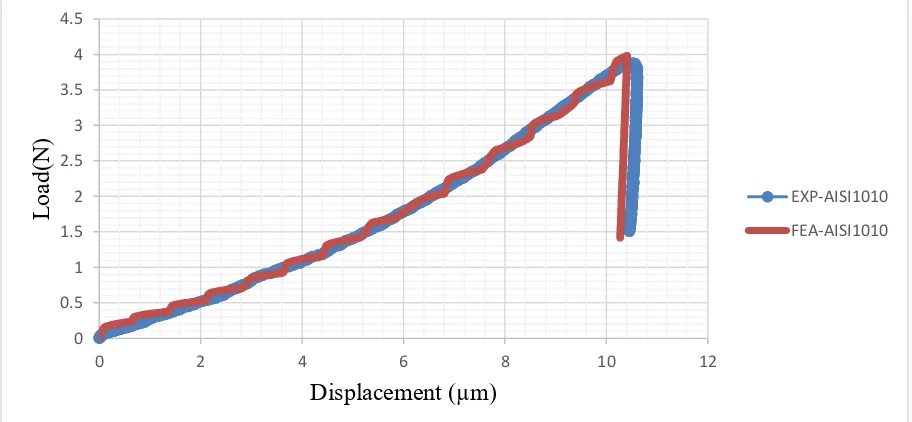
shown, there is excellent agreement between the experimental and the finite element simulation.
Figure 12: Comparison of F.E simulation and experimental results for spherical indenter.
Fig. (13) shows a comparison between the experimental results and the simulation load-displacement curves for Vickers indenter. The agreement between results were
excellent, which validate the finite element model.
Figure 13: Comparison of F.E simulation and experimental results for Vickers indenter.
B.
Module of elasticity prediction
Table (3) compares results for elastic modulus extracted from experimental and finite element simulation methods and also from tensile test. As shown a very good agreement obtained from the finite element simulation model as compared with other methods and the error % is within acceptable limits.
0 2 4 6 8 10 12
0 1 2 3 4 5 6 7 8 9 10
L oa d( N ) EXP-AISI1010 FEA-AISI1010 Displacement (µm) 0 0.5 1 1.5 2 2.5 3 3.5 4 4.5
0 2 4 6 8 10 12
328
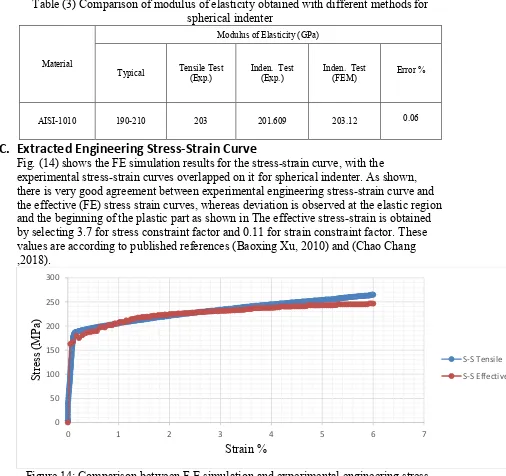
Table (3) Comparison of modulus of elasticity obtained with different methods for spherical indenter
Material
Modulus of Elasticity (GPa)
Typical Tensile Test
(Exp.)
Inden. Test (Exp.)
Inden. Test
(FEM) Error %
AISI-1010 190-210 203 201.609 203.12 0.06
C.
Extracted Engineering Stress-Strain Curve
Fig. (14) shows the FE simulation results for the stress-strain curve, with the experimental stress-strain curves overlapped on it for spherical indenter. As shown, there is very good agreement between experimental engineering stress-strain curve and the effective (FE) stress strain curves, whereas deviation is observed at the elastic region and the beginning of the plastic part as shown in The effective stress-strain is obtained by selecting 3.7 for stress constraint factor and 0.11 for strain constraint factor. These values are according to published references (Baoxing Xu, 2010) and (Chao Chang ,2018).
Figure 14: Comparison between F.E simulation and experimental engineering stress– strain curves results for AISI1010.
This agreement is found to be sufficient to estimate the yield stress and the strain hardening exponent as shown in Table (4).
Table (4) Comparison of yield stress and Strain hardening exponent from tensile and indentation tests (Spherical indenter)
0 50 100 150 200 250 300
0 1 2 3 4 5 6 7
329
V.
CONCLUSION
From this study, generally, it is found that finite element simulation has become a powerful tool to study the micro- indentation test and thus to help develop improvements in the analytical theories used to extract mechanical properties from experimental data. In this work, the indentation FE simulation has been implemented in the ABAQUS software based on the material properties obtained from the uniaxial tensile tests of AISI1010 steel. From this study, the following points have been concluded:
• The FE simulated loading-unloading curves for both materials agree well with experimental loading-unloading curves.
• The agreement between the FE simulation and experimental mechanical results is excellent.
• The sensitivity of the response of the model is evaluated in load condition under change of strain hardening exponent, fraction coefficient and boundary condition and found stable.
• As analytical tool, FE simulation helps to lower the cost and duration of experimental studies by accurate and fast computation.
References
ABAQUS Version 6.14 User’s Manual.
D. Tabor, 1951 Hardness of Metals, Clarendon, Oxford, UK.
S. S Chiang D.B. Marshall and A.G. Evans ,1982, The response of solids to elastic plastic indentation, Journal of Applied Physics 53, 298.
M.F. Doerner,1986, A method for interpreting the data from depth-sensing indentation instruments, Journal of Materials Research, Vol 1, Issue 4, pp.601-609.
A.K. Bhargava, C.P. Sharma 1990, Mechanical behavior and testing of materials, PHI Learning Private Limited, Delhi, ISBN -978-81-203-4250-7.
Material
Yield Stress (Mpa) Strain hardening exponent Work hardening (Mpa)
Tensile test Indentation test
Error
% Tensile test
Indentation test
Error
% Tensile test
Indentation test
Error %
330
J.A. Knapp,1996, Finite-element modeling of Nano indentation for determining the mechanical properties of implanted layers and thin films, Science Direct, Nuclear Instruments and Methods in Physics Research Section B: Beam Interactions with Materials and Atoms Vols 127–128, PP 935-939.
W.C. Oliver, G.M. Pharr,1992, an improved technique for determining hardness and elastic modulus using load and displacement sensing indentation experiments, Materials Research Society, Vol 7 No 6.
Anthony.C. Fischer-Cripps,2002, Mechanical Engineering Series Nano indentation, Springer Science and Business Media New York, ISBN 978-0-387-22462-6.
Nurot Panich1,2004, Finite Element Simulation of Nano indentation of Bulk Materials, J. Sci. Res. Chula. Univ., Vol. 29, No. 2.
J.D. Bressan, A. Tramontin, C. Rosa,2004, Modeling of Nano indentation of bulk and thin film, Joinville Department of Mechanical Engineering, Universidade do Estado de Santa Catarina (UDESC), 89223-100 Joinville, SC, Brazil.
John D. Clayton,2005, Spherical Indentation in Elastoplastic Materials: Modeling and Simulation, Army Research Laboratory ARL-TR-3516.
Eduard Kimmari and Lembit Kommel ,2006, Application of the continuous indentation test method for the characterization of mechanical properties of B4C/Al composites, Proc. Estonian Acad. Sci. Eng., 12, 4, pp.399–407.
F. Yang and J. C.-M. Li,2008, Micro and Nano Mechanical Testing of Materials and Devices, Springer.
Chi Chen,2009,2-D finite element modeling for Nano indentation and fracture stress, Graduate Theses and Dissertations.http:// scholarcommons.usf.edu/etd/1897
Baoxing Xu, Xi Chen,2010, Determining engineering stress–strain curve directly from the load–depth curve of spherical indentation test, Materials Research Society, J. Mater. Res., Vol. 25, No. 12