J. Sens. Sens. Syst., 2, 35–43, 2013 www.j-sens-sens-syst.net/2/35/2013/ doi:10.5194/jsss-2-35-2013
©Author(s) 2013. CC Attribution 3.0 License.
Geoscientific Instrumentation
Methods and
Data Systems
Discussions
Geoscientific Instrumentation
Methods and
Data Systems
Open Access
Web Ecology
Open Access
Open
Access
JSSS
Journal of Sensors and Sensor Systems
Near-field wireless sensing of single and multiple
open-ended micro coils
A. Yousaf, J. M. Boccard, F. A. Khan, and L. M. Reindl
Institute of Microsystems Engineering IMTEK Laboratory for Electrical Instrumentation University of Freiburg, Germany
Correspondence to: A. Yousaf ([email protected])
Received: 18 December 2012 – Revised: 21 March 2013 – Accepted: 10 April 2013 – Published: 2 May 2013
Abstract. In this work we present near-field wireless sensing of single and multiple open-ended micro coils
using an electrically small loop antenna. Wirelessly characterized parameters of open-ended micro coils in-clude its resonance frequency, quality factor and inductance. Moreover a wireless frequency-dependent ana-lytical model was developed. Micro coil inductance was extracted from the wirelessly measured signal using a constraint-based least-squares approach. Wireless measurements and analytical fit of micro coils are in strong agreement which validates the analytical model. Finite element method (FEM) simulations of the coupled system were done in COMSOL Multiphysics.
1 Introduction
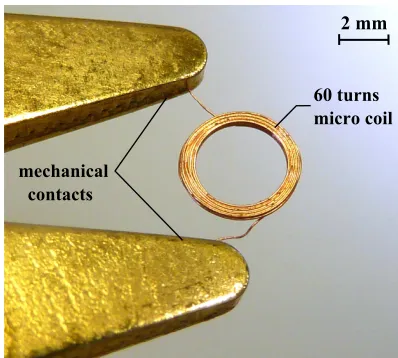
Due to device miniaturization the process of testing micro coils becomes a challenging task for the manufacturers since making proper ohmic contact not only requires more concen-tration for the operating person but also in certain cases de-forms the micro coil structure. This wire-based measurement is performed using a standard LCR meter or an impedance analyzer as shown in Fig. 1.
Further, contacting probes also influence the micro coil
pa-rameters, which become difficult to eliminate from the
ac-tual parameters. This leads to the requirement of investigat-ing new wireless test methods which can be integrated in the manufacturing industry. Several passive read-out systems us-ing inductive and capacitive couplus-ing approaches have been reported frequently. Faul et al. (2011) reported a wireless passive pressure sensor for measuring intraocular pressure where the sensor device consists of a capacitor array and a coil inductor, which form a series LC type resonator. The concept of inductively coupled wireless LC sensors where the stimulus or the applied pressure, strain or torque sig-nal changes the capacitance of an LC circuit, hence shifting the resonance frequency, was reported by Cao et al. (2011); Radislav A Potyrailo and Morris (2009); RamRakhyani et al. (2011); and Ee Lim Tan and Ong (2007).
60 turns micro coil
mechanical contacts
2 mm
Figure 1.Ohmic contact based wired measurement of a micro coil.
36 A. Yousaf et al.: Near-field wireless sensing of single and multiple open-ended micro coils
the wireless measurement approach and parameter extraction approaches. Measurements and simulation results are dis-cussed in Sect. 5. Conclusion and outlook are disdis-cussed in Sect. 6.
2 Theoretical background
2.1 Near-field wireless sensing
Inductive coupling is one possible approach among several other methods used in near-field wireless sensing applica-tions. In the inductive coupled approach a pick-up sensing coil or an antenna is coupled to the sensing element. In perspective of electromagnetic radiations of an antenna, the
space around it can be divided in different regions depending
on its electrical size D, the operational frequency. For an
an-tenna size larger than the wavelength (D> λ), there are three
main fields as follows (Balanis, 2007; Davis et al., 2011):
– Reactive near-field region: corresponds to the reactive
part of the antenna impedance where the energy is not radiated but stored. The electrical and magnetic fields are out of phase by 180 degrees and non-uniform. The
boundary of this field is given by R=0.62pD3/λ.
– Radiating near-field (Fresnel) region: the angular field
distribution is dependent on the distance. The field
de-cay rapidly as factor of 1/R3. As in reactive field, the
electric and magnetic fields are out of phase but they start to emerge. The boundary of this field is given
R=2D2/λ.
– Far-field (Fraunhofer) region: the fields propagate as
an electromagnetic wave and are perpendicular to each other and to the direction of propagation as described by the Maxwell equations. The fields decay by a factor of 1/R and the angular distribution does not depend on
the distance from the antenna anymore.
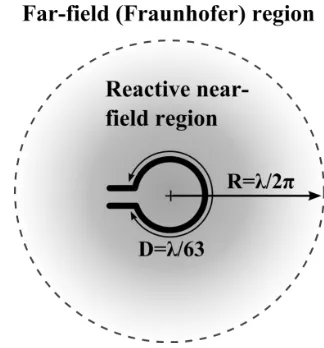
However, the regions are different for small antennas (D<
λ). The radiating near field is inexistent and the boundary
between reactive near and far field is given by R=λ/2π.
Fig-ure 2 shows the simplified field regions for the electrically small single loop antenna used in this work. At 100 MHz, the far field would start at 47 cm.
2.2 Micro coils
Micro coils are one of the most fundamental passive
com-ponents used in different electronics devices and
applica-tions like transformers, DC-DC converters, optical MEMS,
RFID sensors, etc. Further it is one of the effective
struc-tures of coil construction in achieving large inductances in small areas. Micro coils can be manufactured using stan-dard micro machining techniques on silicon substrates as dis-cussed in Querol (2012). Several new applications in near-electromagnetic wireless sensing using micro coils are being
Figure 2.Antenna near- and far-field regions.
reported; one of them is an IOP sensor where a micro coil is implanted in a chip and eye pressure is sensed using a pick-up micro coil.
Inductance increase in micro coils can also be enhanced by winding them in multilayers. Micro coil in multilayers are constructed by piling layers of single-layer coils and con-necting them. Insulation between these layers is done by us-ing additional layers of insulatus-ing materials like polyamide, litz, and polyuntherane by an electroplating process.
Besides insulating the coil wire, it is also coated with a thin layer of magnetic materials like copper or iron. Such a wire is called magnetoplated wire (MPW) and has the following advantages over copper wire without magnetic film plating as discussed in Shinagawa et al. (2009) and Mizuno et al. (2007):
– Increased inductance.
– Higher quality factor.
– Enhanced range of magnetic flux and its linkage.
– Suppression of increase in AC resistance of the coil.
In the presented work the micro coils wirelessly character-ized were multilayer air core micro coils having MPW wire insulated with polyutherane and polyamide. Table 1 contains
geometrical data of these micro coils, where h , Doand Wd
represents the height, outer diameter and wire diameter of the coil, respectively.
Figure 3 shows the microscopic cross section view of a micro coil with 7 layers.
3 Wired characterization of micro coils
Table 1.Micro coil geometrical data, Fa. Hopt GmbH.
Coil Turns Layers h [mm] D0[mm] Wd[µm]
1 33 4 0.43 5.5 71
2 60 8 0.6 1.95 50
3 60 6 0.5 4.2 50
4 100 7 0.5 3.6 50
5 200 10 1.18 7.5 71
6 300 11 1 4.6 50
7 500 15 2 8.2 50
Figure 3.Cross section microscopic view of a micro coil with 7 layers.
model which includes theses parasitic effects. A simplified
non-ideal model for small and SMD coils used in different
practical applications is shown in Fig. 4.
Racrepresents ac resistance of the coil which is composed
of three components, namely dc resistance Rdc, winding
re-sistance and skin effects represented as Rsand proximity
ef-fect resistance Rpexpressed below as
Rac=Rdc+Rs+RsΩ. (1)
A multi-turn coil also includes the effects of distributed
ca-pacitances. The potential difference that exists between coil
winding introduces an electrostatic field distribution between
the air and the dielectric material of coil. This effect is
ap-proximated equivalently as a capacitor connected across the turns. This capacitance realized at the terminals of an induc-tor is collectively called the distributed capacitance of the coil. This distributed capacitance introduces dielectric losses which can be modeled by adding a frequency-dependent se-ries resistance to the inductor as discussed in Shishan et al. (2010) and Grandi et al. (1996).
The frequency-dependent complex impedance Z(w) of this model is given below:
Z(w)= Rac+jwL
1−w2LC
d+jwRacCd
(2)
L
(a)
(b)
Rac
Cd
Rp
Cd
Figure 4.Simplified non-ideal micro coil electrical model (Grandi et al., 1996; Naishadham, 2011).
with the angular frequency w=2πf .
The impedance model (2) is split in realZrand imaginary
Ziparts as follows:
Re(Z)= Rac
(1−w2LC
d)2+w2(CdRac)2
(3)
Im(Z)= wL(1−w
2LC d−
CdR2ac
L )
(1−w2LC
d)2+w2(CdRac)2
. (4)
The distributed capacitance Cd causes the inductor to
res-onate at Wreswith a quality factor Q0. Both of these
parame-ters can be explicitly obtained from the measured impedance signal.
Resonance frequency and quality factor of the model can be obtained as follows:
wres=
s 1
LCd −R
2 ac
L2 (5)
Q0=
wres
∆w. (6)
The Q factor is computed from the measured resonance fre-quency and 3 dB half-power bandwidth.
For the case when the R2ac/L21/LCd, the resonance
fre-quency expression is the same as for a series RLC network.
The resonance frequency Wresin Eq. (5) can be expressed in
terms of quality factor as follows:
Wres=
1
√ L0Cd
·
s
Q2
1+Q2. (7)
The impedance model given in Eq. (2) can also be expressed in terms of resonance frequency as follows:
Z(w)= Rac+jwL
2C
d(w2res−w2)
(1−w2LC
d)2+w2(CdRac)2
. (8)
At the resonance frequency w=wres, inductance L0 and
re-sistance R0can be obtained as follows:
R0=
Zres
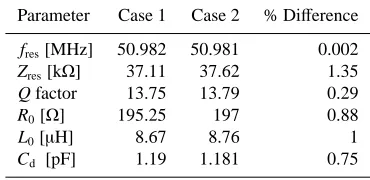
38 A. Yousaf et al.: Near-field wireless sensing of single and multiple open-ended micro coils Table 2.Computed and measured parameters using resonance
fre-quency definitions Case 1 and 2 for a micro coil with 33 turns.
Parameter Case 1 Case 2 % Difference
fres[MHz] 50.982 50.981 0.002 Zres[kΩ] 37.11 37.62 1.35
Q factor 13.75 13.79 0.29
R0[Ω] 195.25 197 0.88
L0[µH] 8.67 8.76 1
Cd [pF] 1.19 1.181 0.75
L0=
QR0
wres
. (10)
The parallel distributed parasitic capacitance Cd that
mod-els the turn-to-turn and turn-to-core capacitance is treated as frequency invariant. Regarding the first dominant resonance frequency, capacitance can be explicitly obtained from mea-sured data as given below (Naishadham, 2011):
Cd,C(wres)=
1
w2 resL0
· Q
2
1+Q2. (11)
The resonance frequency can be determined from the mea-sured data using the following two basic definitions:
– Case 1: frequency at which impedance imaginary part
Im(Z)≈0.
– Case 2: frequency at which impedance real part Re(Z)
is maximum.
In practice it is easier to measure the peak or maximum of impedance real part rather than measuring the zero of Im(Z) as discussed in Nopper et al. (2011). Equations (7)–(11) are used to evaluate the model parameters at the measured reso-nance frequencies and impedances. Table 2 contains the mea-sured and computed parameters for both definitions of reso-nance frequency.
As evident from data in Table 2, the discrepancy in res-onance frequencies for both cases is 0.002 % for a 33-turn micro coil having a Q factor of 13.95. This discrepancy in-creases at maximum to 0.98 % for a micro coil with 500 turns having Q factor of 4.75. This increase of discrepancy in res-onance frequency is not a measurement error but due to the low Q factor of the micro coil. Figure 5 shows the relative
error∆Q/Q plotted against the measured Q factor values.
Wired-measurement and calculated parameters of diff
er-ent micro coils are given in Table 3. Figures 6 and 7 show the wired impedance (real and imaginary) measurement and parametric fit.
4 Wireless measurement approach
A single-turn electrically small circular loop antenna was used to inductively couple the open-ended micro coils as
dis-5 6 7 8 9 10 11 12 13
10-4 10-3 10-2 10-1
Quality factor
R
e
la
ti
v
e
e
rr
o
r
m
a
g
n
it
u
d
e
Case 1 Case 2
Figure 5.Relative Quality factor error∆Q/Q for both cases of res-onance frequency. Case 1: Re(Z) maximum; Case 2: Im(Z) mini-mum.
Table 3.Measured and computed parameters of different multilayer micro coils.
Coil fres[MHz] Q L0[µH] C0[pf] R0[kΩ]
1 50.98 13.79 8.76 1.11 0.197
2 64.73 7.47 5.91 1.01 0.322
3 34.53 10.46 26.9 0.8 0.558
4 43.69 6.1 28.71 0.45 1.29
5 6.44 4.73 270 2.16 2.314
6 8.17 5.96 390 0.97 3.367
7 3.351 6.83 1451 1.52 4.47
cussed in Yousaf and Reindl (2011). Figure 8 shows pictori-ally the measurement overview for near-field coupled open-ended micro coils. The wirelessly measured impedance
sig-nal for the open-ended coil under test includes the effects
of coupling capacitance between the loop antenna and mi-cro coil. The signal measurement is performed using a net-work analyzer E5071B (Agilent, 2007). The resonance fre-quency and quality factor of the micro coil were obtained from the wirelessly measured reflected impedance signal. In-ductance and loss resistance were extracted from the mea-sured impedance signal. Wired micro coil measurements as discussed in Sect. 3 provide a reference to compute the toler-ance range between the wirelessly and wired measurements
of micro coils. Micro coils’ parameters’ tolerance range Ttol
can be computed as follows:
Ttol=
Pwired−Pwireless
Pwired
.% (12)
4.1 Wireless analytical model
The equivalent electrical circuit model of the inductively coupled micro coil with the loop antenna is shown in Fig. 9. The open-ended micro coil is modeled as a series RLC
Frequency f [MHz] Im ( Z) [ K Ω ]
20 40 60 80 100
-20 -15 -10 -5 0 5 10 15 Measurement Parametric fit
Figure 6.Measured impedance imaginary part and analytical fit for a micro coil with 33 turns and resonance frequency of 50.98 MHz.
Frequency f [MHz]
R e (Z) [ Ω ]
20 40 60 80 100
0 5 10 15 20 25 30 35 40 Measurment Parametric fit
Figure 7.Measured impedance real part and analytical fit for a mi-cro coil with 33 turns and resonance frequency of 50.98 MHz.
inductance and loss resistance of the micro coil, where Cx
is the capacitance of the micro coil including the coupling
capacitance (gimmick effect) between the micro coil and
loop antenna conductor. Further, R1 and L1represent the
re-sistance and inductance of the loop antenna. In this model the loop antenna capacitance is ignored as the wireless mea-surements performed to test micro coils is well below self-resonating frequency of loop antenna, i.e.1.59 GHz.
Wireless analytical model of the coupled system is derived by applying KVL law and standard transformer equations.
The complex impedance Z1=U1/I1 of the coupled system
including the effects of reflected impedance can be
repre-sented in terms of wirelessly measured resonance frequency
Wresand quality factor as
Z1=R1+jwL1
1+ w wres 2 (kn)2
1− w
wres 2 + j Q2 w wres , (13)
where k is the electromagnetic coupling coefficient given in
Eq. (14):
k= √M L1L2
. (14)
M is the mutual inductance between the coupled coils, where n is the transformer turns ratio n=Ns/Nsbetween the
excita-tion and micro coil.
Network analyzer Micro coil parameter extraction Tolerance range Wired reference micro coil measurement coupling micro coil-
small loop
fres, Q
Figure 8.Wireless measurement approach overview.
R1
Cx
Excitation coil Open loop micro coil
I1 M I2
L1 L2
U2
1 n R2
U1
Figure 9.Equivalent electrical circuit model of the inductively cou-pled single micro coil with an electrically small loop antenna.
Analytical evaluation of micro coil resonance frequency from the wirelessly measured impedance imaginary part is
difficult due to its increased complexity. Therefore the real
part of the impedance is used (given in Eq. 15), which pro-vides a fair analytical estimation for micro coil resonance frequency:
Re{Z1}=R1+
L1(kn)2w4
Q2
"
1− w2
w2
res
2
+ w
Q2wres
2#
w3 res
. (15)
Analytically the resonance frequency of the micro coil
Wres can be obtained by taking the maximum of Eq. (15),
Re{Z1}max→w, with respect to frequency as
Wmax=
2Q2
q
4Q2
2−1
wres. (16)
For the values of Q2 above 3 the maximum of the real part
of impedance is approximately equal to the resonance fre-quency. The error in resonance frequency reduces to less than 1 % for the micro coils having a Q factor greater than 3.
The quality factor of the open-ended micro coils can also be approximated from the real part of impedance by using half-power band width approximation as given in Eq. (6).
4.2 Parameter estimation
Micro coil resonance frequency Wres and quality factor Q2
40 A. Yousaf et al.: Near-field wireless sensing of single and multiple open-ended micro coils
R
e
(Z
)
[
Ω
]
Frequency f [MHz]
20 40 60 80 100
0.2 0.4 0.6 0.8 1 1.2 1.4
Measurement Parametric fit
Figure 10.Wirelessly measured impedance real part and analytical fit for a micro coil with resonance frequency of 51.19 MHz with an error of 0.41 %.
A least-squares parameter estimation approach is used to extract the unknown parametric values of micro coils (Yousaf, 2012). This estimation routine locates the global minimum of the function expressed as the sum of least sqau-res. The impedance model in Eq. (13) is modified to the
impedance extraction model Zextas follows:
Zext=R1+jwL1
1+
w
wres
2 (kn)2
1−ww res
2
+ j
Q2
2
L2
R2
. (17)
The impedance extraction model allows optimally approxi-mating the data model with the measured signal. The
mod-ified form given in Eq. (17) introduces inductance L2 and
resistance R2as extraction parameters holding the following
relationship:
j Q2
· w
wres
≈ j
Q2 2
·L2 R2
. (18)
The frequency-dependent capacitance Cxis not introduced in
the extraction model, hence reducing the degree of freedom
to two instead of three. The capacitance Cxcan be
analyti-cally calculated using the measured resonance and extracted inductance as follows:
Cx≈w2res·L2. (19)
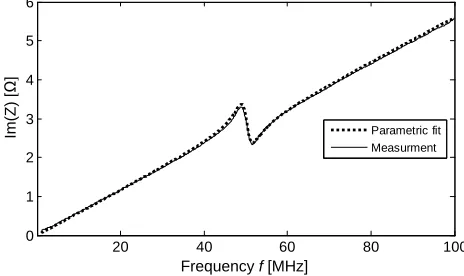
Figures 10 and 11 show the parametric model (real and imaginary) and wireless measurement of a micro coil having a resonance frequency of 51.19 MHz with an error of 0.41 % from the actual resonance frequency of the micro coil.
4.3 Wireless measurement of multiple open-ended micro coil
Simultaneously measuring more than one micro coil pro-vides an additional measurement possibility to test the same
Frequency f [MHz]
Im
(Z
)
[
Ω
]
20 40 60 80 100
0 1 2 3 4 5 6
Parametric fit Measurment
Figure 11.Wirelessly measured impedance imaginary part and an-alytical fit for a micro coil with resonance frequency of 51.19 MHz with an error of 0.41 %.
Figure 12.Simultaneous wireless measurement of two different open-ended micro coils placed inside electrically small loop an-tenna.
and different types of open-ended micro coils. Figure 12
shows 2 different dimensions of open-ended micro coils
placed inside the loop antenna for simultaneous measure-ment of their resonance frequencies and Q factors.
Figure 13 shows the measured resonance frequencies
of two different coils having a frequency separation of
13.82 MHz. In multiple-micro-coil simultaneous measure-ments the capacitive coupling between the multiple micro coils and loop antenna is enhanced, due to which the res-onance frequencies of the micro coils is shifted from their actual values. Figure 14 shows the comparison between a measurement of single open-ended micro coil and the simul-taneous measurement of multiple open-ended micro coil. For the same micro coils’ simultaneous measurement with a loop antenna, the resonance frequency shifts from 50.19 MHz to
49.93 MHz ,having an increased deviationσof 1.8 % from
20 30 40 50 60 70 80 0.6
1.2
Frequency f [MHz]
R
e
(Z
)
[
Ω
]
60 turns micro coil
33 turns micro coil
Figure 13.Simultaneously measured wireless resonance frequen-cies of two different micro coils with 33 and 60 turns using electri-cally small loop antenna.
20 30 40 50 60 70 80
0.5 1.5 2.5
Two 33 turn coil resonance Single 33 turn coil resonance
Frequency f [MHz]
R
e
(Z
)
[
Ω
]
Figure 14.Two 33-turn open-loop micro coil with measured res-onance frequency of 49.93 [MHz] plotted vs single 33-turn micro coil with measured resonance frequency of 51.97 [MHz].
5 Measurements and simulations
Micro coils are wirelessly measured in a frequency range from 1 to 100 MHz. Wirelessly measured, extracted and cal-culated parameters of the test micro coils characterized using an electrically small loop antenna are given in Table 4.
Random errors in resonance frequencies of multiple-micro-coil simultaneous measurement increase compared to the single-micro-coil measurement. Figures 15 and 16 depict the random errors calculated for a 33-turn single-micro-coil measurement and multiple-single-micro-coil simultane-ous measurements.
To simulate the presented problem of measurement ap-proaches based on open-ended single and multiple micro coils, a COMSOL 2-D asymmetrical approach is used. A small loop antenna is modeled by using a copper square 2-D surface. The open-ended condition of the micro coil is ap-proximated by applying zero magnetic field conditions on the
Table 4.Wirelessly characterized parameters of open-ended micro coils inductively coupled to an electrically small loop antenna.
Coil fres[MHz] Q L2[µH] Cx[pf] R2[Ω]
1 51.25 13.42 8.54 1.13 181
2 65.73 7.13 5.31 1.095 283
3 36.13 10.16 25.3 1.2 458
4 44.19 5.82 26.12 0.32 1012
5 6.82 4.44 263 2.32 2218
6 8.32 5.42 379 0.92 3196
7 3.82 6.83 1382 1.32 4420
50
50.5
51
51.5
20
100
180
Resonance Frequency in [MHz]
N
u
m
b
er
o
f
m
ea
su
re
m
e
n
ts
Figure 15.Error distributions in wirelessly measured resonance frequency of a single micro coil with 33 turns measured at the center of loop antenna with mean resonance frequency of 50.82 MHz. The dotted line represents the Gaussian distribution of the corresponding moments.
2-D array of the micro coil (Trezise, 2011; Graf et al., 2009). An AC excitation signal of 1 dBm is applied to the loop
an-tenna, hence generating the magnetic fluxΦwhich is linked
to the micro coils. Magnetic field behavior and the magnetic flux linkage of the inductively coupled test micro coils with the loop antenna is shown in Fig. 17. The arrows and the stream lines show the magnetic flux and linkage through the
air. The magnetic fluxΦtestcoiland current I passing through
the micro coils are calculated at the constructed 2-D coil
ar-ray boundary. Individual micro coil inductances Lsimcan be
calculated as follows (Ghali and Rehman, 2009):
Lsim=Φ testcoil
I ×N
2, (20)
where N is the micro coil number of turns.
42 A. Yousaf et al.: Near-field wireless sensing of single and multiple open-ended micro coils
49
50
51
52
20
40
60
80
2
3
4
5
20
40
60
80
N
u
m
b
er
o
f
m
ea
su
re
m
en
ts
N
u
m
b
er
o
f
m
ea
su
re
m
en
ts
Resonance frequency [MHz]
Error in Resonance frequency [MHz]
Figure 16. Error distributions in wirelessly measured resonance frequency of a micro coil with 33 turns measured at the center of loop antenna in presence of another test micro coil with 60 turns. The mean resonance frequency of the 33-turn micro coil is shifted to 50.12 MHz. The dotted line represents the Gaussian distribution of the corresponding moments.
1 mm 60 turns micro
coil cross section 30 turns micro coil cross section
single turn loop cross section
63 Magnetic flux [µT]
53
42
33
23
13
3.0
1.2e-6
Frequency: 52 MHzInput power: 1dBm
Figure 17.2-D FEM simulation of 60- and 30-turn micro coils cou-pled to a small loop antenna.
Figure 18 shows the comparison of wirelessly measured and simulated inductances of micro coils.
6 Conclusions
We report here a wireless characterization technique of ope-nended single and multiple micro coils, using an electrically small loop antenna. A wireless analytical model is devel-oped for the coupled system and compared with the mea-surements, which are in strong agreement, hence validating the model. Detection of multiple resonance frequencies for simultaneous measurement of open-ended micro coils is also presented here. The multiple-micro-coil simultaneous
mea-1 2 3 4 5 6 7
0
5
1 0 1 5 2 0 2 5 2 8 0 5 6 0 8 4 0 1 1 2 0 1 4 0 0
Coil number Extracted inductance Simulated inductance Inductance µ(H)
Figure 18.Wirelessly extracted and numerically computed induc-tance values of different open-ended micro coils.
surement has high coupling capacitance with increased rela-tive errors in resonance frequencies of test micro coils.
Relative errors in resonance frequency, and Q factor of the micro coils ranged from 1.2 % to 4.1 % and 0.92 % to 3.2 %, respectively, for the single- and multiple-micro-coil measure-ment approaches.
Acknowledgements. The authors would like to thanks German Federation of Industrial Research Associations AIF for supporting and facilitating the research project.
Edited by: M. Kraft
References
Ghali, H. A. and Rehman, H. A.: Understanding Mutual Inductance using COMSOL Multiphysics Milan, 2009.
Agilent: Installation and Quick Start Guide, 7th Edition, 2007. Balanis, C. A.: Antenna Theory Analysis and Design, vol. 3, Wiley
Interscience, 2007.
Bowtell, R. and Robyr, P.: Multilayer Gradient Coil Design, Journal of Magnetic Resonance, 131, 286–294, 1998.
Cao, H., Weber, R., and Hamouche, N.: A passive intraoc-ular pressure sensor and a wireless sensing technique us-ing an intermediate LC resonator, in: Life Science Systems and Applications Workshop (LiSSA), 2011 IEEE/NIH, 5–8, doi:10.1109/LISSA.2011.5754141, 2011.
Davis, W., Yang, T., Caswell, E., and Stutzman, W.: Fundamental limits on antenna size: a new limit, Microwaves, Antennas Prop-agation, IET, 5, 1297–1302, doi:10.1049/iet-map.2010.0604, 2011.
Ee Lim Tan, Wen Ni Ng, R. S. B. D. P., and Ong, K. G.: A Wireless, Passive Sensor for Quantifying Packaged Food Quality, Sensors Journal, 7, 1747–1756, 2007.
Symposium on, 1–4, doi:10.1109/MWSCAS.2011.6026619, 2011.
Graf, T., Schalli, O., Furrer, A., and Marty, P.: Inductance of Mag-netic Plated Wires as a Fucntion of Frequency and Plating Thick-nes Milan, Proceedings of the COMSOL Conference 2009 Mi-lan, 2009.
Grandi, G., Kazimierczuk, M., Massarini, A., and Reggiani, U.: Stray capacitances of single-layer air-core inductors for high-frequency applications, in: Industry Applications Conference, 1996, Thirty-First IAS Annual Meeting, IAS ’96., Confer-ence Record of the 1996 IEEE, vol. 3, 1384–1388, vol. 3, doi:10.1109/IAS.1996.559246, 1996.
Mizuno, T., Enoki, S., Hayashi, T., Asahina, T., and Shinagawa, H.: Extending the Linearity Range of Eddy-Current Displacement Sensor With Magnetoplated Wire, Magnetics, IEEE Transactions on, 43, 543–548, doi:10.1109/TMAG.2006.887853, 2007. Naishadham, K.: Closed-Form Design Formulas for the
Equiv-alent Circuit Characterization of Ferrite Inductors, Electro-magnetic Compatibility, IEEE Transactions on, 53, 923–932, doi:10.1109/TEMC.2011.2116795, 2011.
Nopper, R., Has, R., and Reindl, L.: A Wireless Sensor Readout System 02014;Circuit Concept, Simulation, and Accuracy, In-strumentation and Measurement, IEEE Transactions on, PP, 1–8, doi:10.1109/TIM.2011.2122110, 2011.
Querol, J. M. A.: Dissertation,University Poltecnica de Catalunya BarcelonaTech,Monitoring Switch Type Sensors and Powering Autonomous Sensors via Inductive coupling.Applications to Re-movable Seats in Vehicles June, 2012.
Radislav, A. Potyrailo, C., and Morris, W. G.: Combinatorial Screening of Polymeric Sensing Materials Using RFID Sensors: Combined Effects of Plasticizers and Temperature, American Chemical Society, 2009.
RamRakhyani, A., Mirabbasi, S., and Chiao, M.: Design and Optimization of Resonance-Based Efficient Wireless Power Delivery Systems for Biomedical Implants, Biomedi-cal Circuits and Systems, IEEE Transactions on, 5, 48–63, doi:10.1109/TBCAS.2010.2072782, 2011.
Shinagawa, H., Suzuki, T., Noda, M., Shimura, Y., Enoki, S., and Mizuno, T.: Theoretical Analysis of AC Resistance in Coil Us-ing Magnetoplated Wire, Magnetics, IEEE Transactions on, 45, 3251–3259, doi:10.1109/TMAG.2009.2021948, 2009.
Shishan, W., Zeyuan, L., and Yan, X.: Extraction of parasitic capac-itance for toroidal ferrite core inductor, in: Industrial Electronics and Applications (ICIEA), 2010 the 5th IEEE Conference on, 451–456, doi:10.1109/ICIEA.2010.5517152, 2010.
Trezise, T.: Modelling Inductively Coupled Coils for Wireless Im-plantable Bio-Sensors, A Novel Approach Using the Finite Ele-ment Method, M.Sc Thesis University of Victoria Canada, 2011. Yousaf, A.: Passive Wireless Sensing of Micro coil parameters in: fluidic environments,Sensors and Actuators A: Physical, Else-vier, doi:10.1016/j.sna.2012.01.032, 2012.