Research and Reports in Neonatology
Effect of variable circuit flow rate during
the expiratory phase on CO
2
elimination
Peter A Keszler1
Pankaj Nagaraj1
Kabir Abubakar1
Martin Keszler2
1Georgetown University, Washington,
DC, USA; Georgetown University Hospital, Washington, DC, USA;
2Brown University, Women and
Infants Hospital of Rhode Island, Providence, RI, USA
Correspondence: Martin Keszler Women and Infants Hospital of Rhode Island, 101 Dudley Street, Providence, RI 02905, USA
Tel +1 401 274 1122 Fax +1 401 453 7571 Email [email protected]
Background: Some continuous flow infant ventilators allow independent setting of inspiratory
and expiratory circuit flow rate. In the Dräger Babylog 8000+ ventilator, this is called “variable
inspiratory, variable expiratory flow” (VIVE). Some clinicians believe that lower expiratory flow decreases expiratory resistance. The minimum expiratory flow rate needed to avoid re-breathing
of carbon dioxide (CO2) has never been established.
Objective: We sought to determine if re-breathing becomes evident at the lowest possible expiratory flow rate setting of 1 L/min.
Design/methods: We conducted a bench study using end-tidal CO2 (ETCO2) measurement
and a 45 mL (90 mL for the “term” model) test lung pre-filled with 100% CO2. We previously
showed that the time needed for ETCO2 to be eliminated from the lung is a highly reproducible
indicator of efficiency of ventilation. Re-breathing would thus be identified by an increase in
the time required for the CO2 to be washed out from the test lung at stable settings of rate and
tidal volume (VT). Using a Babylog 8000+ ventilator in volume guarantee mode with VIVE
and a standard ventilator circuit, we tested the effect of decreasing expiratory flow rate under
conditions simulating three sizes of patients: extremely low birth weight infant, wt = 600 g
(VT= 3.5 mL, respiratory rate (RR) = 60 breaths min−1, minute ventilation (MV) = 210 mL/min,
expiratory flow rate = 3 L/min, 2 L/min, and 1 L/min), very low birth weight infant, wt = 1.5 kg
(VT= 7 mL, RR = 60 breaths min−1, MV = 420 mL/min, expiratory flow rate = 4 L/min, 3 L/min,
2 L/min, and 1 L/min), and term infant, wt = 3.6 kg (VT= 16 mL, RR = 60 breaths min−1,
MV = 960 mL/min, expiratory flow rate = 5 L/min, 4 L/min, 3 L/min, 2 L/min, and 1 L/min).
Each measurement was repeated four times and the mean values were compared by analysis of variance for repeated measures.
Results: The CO2 elimination times were always within 10% of each other with each repetition. There was no significant increase in the elimination time even at the lowest flows.
Conclusion: Clinically significant re-breathing does not occur even with expiratory flow rate at the lowest possible setting of 1 L/min. VIVE is safe to use, although its clinical utility has not been established.
Keywords: mechanical ventilation, newborn, bench study, re-breathing, expiratory flow rate,
end-tidal CO2
Background
The majority of ventilators currently in use in North America use demand flow during the inspiratory phase to meet inspiratory flow requirements and return circuit flow to a low baseline during the expiratory phase. The Dräger Babylog 8000+ (Dräger Medical, Lübeck, Germany) is a continuous flow infant ventilator that uses a continuous flow in the ventilator circuit throughout the respiratory cycle in the default mode, but
Dove
press
O R I G I N A L R E S E A R C H
open access to scientific and medical research
Open Access Full Text Article
Research and Reports in Neonatology downloaded from https://www.dovepress.com/ by 118.70.13.36 on 27-Aug-2020
For personal use only.
Number of times this article has been viewed
This article was published in the following Dove Press journal: Research and Reports in Neonatology
provides a feature that allows the user to select an expiratory flow rate independent of inspiratory flow rate. This feature is called “variable inspiratory, variable expiratory flow rate” or VIVE.1,2 There are no published data to guide the use of
VIVE. Many clinicians believe that lower expiratory flow rate decreases expiratory resistance and thus lowers the work of breathing, based on a paper suggesting that continuous flow ventilators may be associated with higher expiratory work of breathing.3 Although this may no longer be true with modern
technology, VIVE remains a commonly used option on one of the most widely used neonatal ventilators and there are no data to guide the clinician in setting appropriate expira-tory flow rate in VIVE. Whether or not it affects expiraexpira-tory resistance, lower circuit flow during the expiratory phase would lower the consumption of medical gases and sterile water for humidification and may therefore be desirable. However, if the circuit flow rate during the expiratory phase were to fall below that, which is needed to sweep exhaled gas down the expiratory limb of the circuit, re-breathing of CO2 would occur and impair CO2 elimination.
We hypothesized that there is a minimum expiratory flow rate that is needed to avoid re-breathing of exhaled gas and therefore avoid impairing CO2 elimination and that this flow rate is related to the tidal volume (VT) and minute ventilation (MV) of the infant.
Methods
We conducted a bench study using a Dräger Babylog 8000+
continuous flow infant ventilator (Dräger Medical, Lübeck, Germany) with a standard Fisher and Paykel ventilator
circuit and humidifier (Fisher and Paykel, Auckland, New Zealand). We pre-filled a 45 mL silicone rubber bellows test lung (IngMar Medical, Pittsburgh, PA) with 100% CO2 and used a CO2SMO Plus respiratory monitor mainstream ETCO2 system (Novametrix Medical Systems, Wallingford, CT) to detect the rate at which CO2 was eliminated from the test lung (Figure 1). We previously showed that the time needed for ETCO2 to fall below 8 mmHg (the threshold of reliable detec-tion by this instrument) is a highly reproducible indicator of efficiency of ventilation in this model.4 The basic principle
is that with the initiation of ventilation, CO2 is detected by the ETCO2 monitor at the airway opening, initially at high concentration when the test lung is filled with pure CO2. Subsequently, the ETCO2 declines in an exponential fashion as the CO2 concentration in the test lung decreases and therefore less CO2 is cleared from the test lung with each breath (Figure 2). The time needed for the ETCO2 to drop below the threshold of detection is proportional to effective alveolar minute ventilation.
Re-breathing would thus be identified by an increase in the time required for the CO2 to be washed out from the test lung (the CO2 elimination time) at any given MV determined by stable settings of respiratory rate (RR) and VT. We tested the effect of decrements in expiratory flow rate under condi-tions simulating three sizes of patients: extremely low birth weight infant, wt = 600 g (VT= 3.5 mL, RR = 60 breaths min−1, MV = 210 mL/min, expiratory flow rate = 3 L/min,
2 L/min, and 1 L/min), very low birth weight infant, 1.5 kg (VT= 7 mL, RR = 60 breaths min−1, MV = 420 mL/min,
expi-ratory flow rate = 4 L/min, 3 L/min, 2 L/min, and 1 L/min),
Babylog ventilator Capnograph
ET tube
Bellows test lung
CO2 port Flow sensor
CO2 sensor
ETT adaptor
Humidifier Ventilator circuit
Figure 1 The experimental setup.
Abbreviations: ET,endotracheal; ETT, endotracheal tube.
Dovepress Keszler et al
Research and Reports in Neonatology downloaded from https://www.dovepress.com/ by 118.70.13.36 on 27-Aug-2020
and term infant, wt = 3.6 kg (VT= 16 mL, RR = 60 breaths min−1, MV = 960 mL/min, expiratory flow rate = 5 L/min,
4 L/min, 3 L/min, 2 L/min, and 1 L/min). For the term infant model, a double bellows lung (volume = 90 mL) was used because of the larger VT needed.
The ventilator circuit was connected to the ETCO2 sensor which was attached to one end of the Babylog flow sensor connected to a 2.5 mm endotracheal tube cut to 10 cm length and inserted tightly into the open port of the test lung. A 3.0 mm tube was used for the simulated 1.5 kg infant and 3.5 mm tube for the simulated term infant. The test lung connection had a side port that allowed filling of the test lung with pure CO2 prior to each test. Prior to each set of experiments, the flow sensor and ETCO2 monitor were calibrated according to manufacturers’ instructions and tightness of all connections was verified. The test lung was flushed with 100% CO2 at 2 L/min for 2 minutes just prior to each trial to ensure that it was completely filled with pure CO2, the CO2 port was then clamped and the test lung was attached to the ventilator circuit taking care to minimize movement that might agitate the gas. The test lung was enclosed in an airtight plastic container to avoid inadvertent change in volume (ie, “spontaneous breathing”). The ETCO2 monitor was switched on and ventilation started in volume guarantee mode at a specific expiratory flow rate setting on VIVE. The inspiratory flow rate remained at 6 L/min; inspiratory time was set at 0.35 seconds, pressure
limit at 30 cm H2O, and positive end-expiratory pressure at 5 cm H2O.
Each set of experiments consisted of a series of trials simulating the three clinical situations with the appropriate VT using the different flow rates described above in random order. Each series was performed four times. We made sure that the target VT was delivered and increased the pressure limit as needed if necessary. The ETCO2 measurement was stopped when the ETCO2 reading fell below 5 mmHg or when the capnograph stopped displaying values (typically below 6 mmHg). The elimination time was determined from the digital data exported from the capnograph as the time from onset of ventilation to the point when the ETCO2 value dropped below 8 mmHg for three consecutive breaths. This was an arbitrary cutoff point made necessary by the exponential decline nature of the CO2 elimination curve and the fact that the instrument begins to lose accuracy at very low CO2 levels and stops reporting values below approxi-mately 6 mmHg. All measurements were carried out by a single observer (PAK) to eliminate a preventable source of variability.
Statistical analysis
The digital data were exported from the capnograph software to an Excel spreadsheet, graphed, and visually inspected for consistency and to ensure that there were no evident distortions to the expected exponential decline. The start of ETCO2 (mmHg)
160 160
140 140
120
120 100
100
80
80
60
60
40
40
20
20
0
0 20 40 60 80 100 120 140 160 180 200
1
0 2 3 4 5 6 7 sec
sec
0 CO2 elimination time
Figure 2 The smaller panel in the figure shows the ETCO2 waveform generated with each breath. The larger panel is a compressed waveform of a single trial (note the
difference in time scale). The peak of the curve is flattened, because the upper limit of detection of the capnograph is 150 mmHg, while the actual ETCO2 value should
be close to atmospheric pressure at the onset of ventilation when the lung is filled with pure CO2. The exponential decline in the readings is evident. Initially, at high CO2
concentrations, a larger amount of CO2 is eliminated with each breath, but as the level of CO2 drops, a progressively smaller quantity is removed, as indicated by progressively
lower end-tidal CO2 values. The elimination time is a reflection of the effective alveolar ventilation.
Abbreviation: ETCO2,end-tidal CO2.
Dovepress Effect of expiratory circuit flow
Research and Reports in Neonatology downloaded from https://www.dovepress.com/ by 118.70.13.36 on 27-Aug-2020
ventilation and the end point of three consecutive end-tidal values below 8 mmHg were identified. The time difference between the two points was recorded and entered into a spreadsheet for subsequent analysis. Analysis of variance for repeated measures was used to evaluate the effect of different expiratory flows, with P values ,0.05 considered significant.
Results
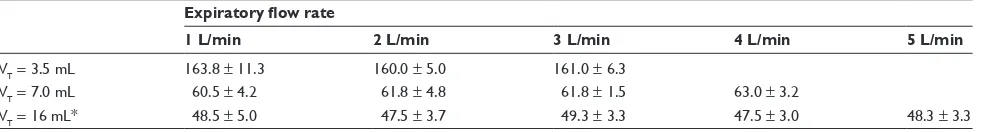
The measurements were highly reproducible and the elimination times were always within 10% of each other at each setting. There were no significant differences in elimination time even at the lowest setting of 1 L/min in each size simulated patient (Table 1). Larger VT resulted in a shorter elimination time as would be anticipated, but not to as great an extent as would be predicted from the conventional assumptions about instrumental dead space; doubling of VT from 3.5 mL to 7 mL reduced the elimination time by a lesser amount than the predicted increase in alveolar ventilation, which is consistent with our previous observations.4
Discussion
To our knowledge, this is the first study to investigate the impact of expiratory flow rate on CO2 elimination in the bench or clinical setting at values relevant to neonatal patients. We found no differences in elimination time between different expiratory flow rates, including the lowest setting of 1 L/min, indicating that there was no re-breathing even in the extreme situation of the simulated term infant with total MV near 1 L/min. This finding is consistent with a lack of clinical reports of the adverse effect of VIVE and with a theoretical model prediction. The 1 L/min expiratory flow should be just sufficient to provide fresh gas to meet the simulated term infant’s needs, as it provides 16.7 mL of fresh gas/second, slightly exceeding the 16 mL VT used in this study at a rate of 1 breath/second. We were unable to obtain acceptable recording when we attempted to use VT of 18 mL and 20 mL, with the ETCO2 monitor consistently recording error messages despite careful checking of all connections
and repeated re-calibration. This was likely because the ETCO2 monitor algorithm rejected the abnormal CO2pattern resulting from the effects of the predicted re-breathing of exhaled gas that should occur when the VT exceeded available fresh gas supply.
The VT we used for the simulated 1.5 kg and term patients were approximately 4.5 mL/kg, based on previously pub-lished values for VT used with volume-targeted ventilation measured at the airway opening, which have been shown to be associated with normocapnia.5–8 We used a larger V
T of
5.8 mL/kg for the smallest infant, because, as we previously demonstrated, the tiniest infant requires proportionately larger VT to compensate for the fixed instrumental dead space, which becomes proportionately larger in the smallest infant.9
The elimination times we found reflected the size of the VT in a manner consistent with our previous work in which we demonstrated that effective alveolar ventilation occurs with VT at or below the theoretical dead space.4 For this
study, we reconfigured the setup slightly, which resulted in a slightly smaller instrumental dead space than in our previous study, accounting for the modestly shorter CO2 elimination time recorded in this series of experiments, compared to the original study with VT of 3.5 mL.4 For these experiments, we
deliberately chose a VT that would lead to a relatively long CO2 elimination time, so that we could detect any effect of re-breathing more easily. The remarkable reproducibility of the CO2 elimination times within each series validates the accuracy of this technique in assessing the effective alveolar ventilation.
Our study has some important limitations. We used a simple lung model which is inherently different from a biological lung. The lung model is a passive device, not engaged in CO2 production or gas exchange, or the variable breathing patterns that are seen in preterm infants. Although this may be seen as a limitation, it actually represents an important advantage by eliminating these potential confounders that could obscure the effect of expiratory flow rate on CO2 removal. We were not able to examine the largest possible VT, which would likely have resulted
Table 1 CO2 elimination time for the three different “size” patients
Expiratory flow rate
1 L/min 2 L/min 3 L/min 4 L/min 5 L/min
VT= 3.5 mL 163.8 ± 11.3 160.0 ± 5.0 161.0 ± 6.3
VT= 7.0 mL 60.5 ± 4.2 61.8 ± 4.8 61.8 ± 1.5 63.0 ± 3.2
VT= 16 mL* 48.5 ± 5.0 47.5 ± 3.7 49.3 ± 3.3 47.5 ± 3.0 48.3 ± 3.3
Notes: Data are presented as mean ± SD. *Double bellows lung with 90 mL volume.
Abbreviation: VT, tidal volume.
Dovepress Keszler et al
Research and Reports in Neonatology downloaded from https://www.dovepress.com/ by 118.70.13.36 on 27-Aug-2020
Research and Reports in Neonatology
Publish your work in this journal
Submit your manuscript here: http://www.dovepress.com/research-and-reports-in-neonatology-journal
Research and Reports in Neonatology is an international, peer-reviewed, open access journal publishing original research, reports, editorials, reviews and commentaries on neonatal health. The manuscript manage-ment system is completely online and includes a very quick and fair
peer-review system. Visit http://www.dovepress.com/testimonials.php to read real quotes from published authors.
in re-breathing, as the presumed re-breathing rendered the ETCO2 instrument incapable of generating a valid readout based on its signal rejection algorithm. While this conclusion remains speculative, the fact that the failed recordings repro-ducibly occurred exactly at the point at which re-breathing would be predicted to occur serves as indirect evidence to support the original hypothesis.
Conclusion
Clinically significant re-breathing will not occur even with expiratory flow rate at the lowest possible setting of 1 L/min in all but the largest term infant. VIVE is safe to use even at very low expiratory flows, although its clinical utility has not been established.
Disclosure
M Keszler has been a consultant to Dräger Medical, the manufacturer of the device used in these studies. He does not have any equity interest in the company and no one related to the company has had any input into the design, execution, or reporting of the study. No financial or equipment support was provided by Dräger Medical for this study.
References
1. Babylog 8000Plus Operating Instructions. 3rd ed. Telford, PA: Dräger Medical;2007.
2. Null DM. Dräger Babylog 8000 plus infant care ventilator. In: Donn SM, Sinha SK, editors. Manual of Neonatal Respiratory Care. 2nd ed. Armonk, NY: Mosby Elsevier; 2006:265–268.
3. Kopotic RJ, Mannino FL. Effects of infant ventilator design on spontane-ous breathing. J Perinatol. 1987;7(4):298–300.
4. Keszler M, Montaner M, Abubakar K. Effective ventilation at conventional rates with tidal volume below instrumental dead space: a bench study. Arch Dis Child Fetal Neonatal Ed. 2012;97:F188–F192. 5. Dawson C, Davies MW. Volume-targeted ventilation and arterial
carbon dioxide in neonates. J Paediatr Child Health. 2005;41(9–10): 518–521.
6. Herrera CM, Gerhardt T, Claure N, et al. Effects of volume-guaranteed synchronized intermittent mandatory ventilation in preterm infants recovering from respiratory failure. Pediatrics. 2002;110(3):529–533. 7. Lista G, Castoldi F, Fontana P, et al. Lung inflammation in preterm
infants with respiratory distress syndrome: effects of ventilation with different tidal volumes. Pediatr Pulmonol. 2006;41(4):357–363. 8. Scopesi F, Calevo MG, Rolfe P, et al. Volume targeted ventilation
(volume guarantee) in the weaning phase of premature newborn infants.
Pediatr Pulmonol. 2007;42(10):864–870.
9. Nassabeh-Montazami S, Abubakar K, Keszler M. The impact of instru-mental dead-space in volumetargeted ventilation of the extremely low birth weight (ELBW) infant. Pediatr Pulmonol. 2009;44(2):128–133. Dovepress
Dove
press
Effect of expiratory circuit flow
Research and Reports in Neonatology downloaded from https://www.dovepress.com/ by 118.70.13.36 on 27-Aug-2020