152
Evaluating Technical Efficiency Of Rice
Production By Using A Modified Three-Stage
Data Envelopment Analysis Approach: A Case
Study In Thailand
Surakiat Parichatnon, Kamonthip Maichum, Ke-Chung Peng
Abstract: The purpose of the paper is to investigate the technical efficiency of rice production in four regions of Thailand using a three-stage data envelopment analysis (DEA) model during the period from 2006 to 2015. The results show a relatively high level of technical efficiency in their production and environmental factors have a significance influence on the production efficiency. In addition, our results indicated that northeastern region has the best scores of technical efficiency and was recognized as the best region for Thai rice production. The findings from this study contribute to improving efficiency production for sustainable development. It is proposed that the Thai government should pay attention to zoning area for rice production and the land holdings should provide sound policies to support modern agricultural machinery for rice production.
Keywords: environmental factors, rice production, sustainable development, technical efficiency, Thailand, three-stage DEA ————————————————————
1
I
NTRODUCTIONRice is the most important agricultural product in the world [1]. Rice is the staple food of more than half of the world’s population, especially Asians; nearly 90% of the world’s rice is produced and consumed in this continent [2, 3] and most of this population consume rice in every meal. Rice production plays a key role in Thailand’s economy and society [4], the majority of Thai’s people work in agriculture, and most of them as rice farmers [5]. In Thailand, rice production is well known in the world for high quality and good breeding [4]. Jasmine rice is the strain most produced and a high quality type. Thailand is the sixth largest producer of rice in the world and paddy rice production in 2014 was 34.3 million metric tons (22.7 million metric tons milled rice), which was a decrease of 2.7% compared with that of 2013 [6]. Rice consumption in 2015 amounted to about 10.8 million metric tons and the average per capita consumption of rice is 300 g/day which ranks Thai people as the seventh biggest rice consumers [5, 6]. In 2015, the Thai Rice Exporters Association reported that Thailand was the world’s second largest exporter of rice amounted to 9.80 million metric tons, accounting for 4,613 USD million [7].
The volume and value decreased by 10.67% and 10.83% respectively in 2015 when compared to the year 2014, due to the global economic slowdown led to a decline in the purchasing power of the partner countries. Moreover, Thailand’s rice export price was higher than the competitors by 20-30 dollars per ton and technical production problems. As a result, some rice importing countries reverted to import rice from other countries. The major export markets for Thai rice are Africa (4.73 million metric tons, 48.3%), followed by Asia (excluding the Middle East) (3.61 million metric tons, 36.9%), America (5.8%), Europe (3.9%), Middle East (3.4%), Oceania and others (1.8%) [5]. According to Office of Agricultural Economics [7], the harvested area estimates are as follows 7.79 million hectares in 2015, located mainly in northeast (57%) followed by northern (22%), central (17%), and southern (4%) and are likely to expand further [4]. In 2015, rice production involved 5.4 million families of farmers, which accounts for more than 17 million people across the country and includes entrepreneurs, laborers, and government officials [7]. According to the economic theory, three basic resources or factors of production, such as, land, labor and capital have been considered as assessment parameters of sustainable development [8]. Efficiency measurements of these factors lead to the advancement of sustainability. Wijnhoud et al. [9] suggested that capital and labor resources are significant socio-economic factors in Thailand and affect long-term sustainability. Therefore, the measurement of efficiency is based on inputs and outputs factors, which is consistent with many researches [8, 10]. Nowak et al. [11] suggested that assessing the performance of agriculture is quite complicated, not only because of the uncertainty of weather conditions but also due to the variety of farmers in different areas and production profile. In addition, previous literature suggests that efficiency measurements are derived according to the differences in available stocks of labor force, fertilizer, pesticide, machinery, seed, quantity of rice, rainfall and other characteristics of the social and economic environment that occurred in different areas of rice production [12-15]. Therefore, these variables are necessary when estimating the production frontier to evaluate performance in different geographical areas, which is useful in calculating technical efficiency (TE) of rice production. This study devoted to rice production, non-parametric methods have been used in _______________________
Surakiat Parichatnon is a Ph.D. student in the Department of Tropical Agriculture and International Cooperation, National Pingtung University of Science and Technology, No.1, Shuefu Road, Neipu, Pingtung 91201, Taiwan; [email protected]; [email protected]
Kamonthip Maichum is a Ph.D. student in the Department of Tropical Agriculture and International Cooperation, National Pingtung University of Science and Technology, No.1, Shuefu Road, Neipu, Pingtung 91201, Taiwan; [email protected]; [email protected]
153 parallel with the related indicators. The technique widely used to
measure the efficiency of multiple decision-making units (DMUs) is data envelopment analysis (DEA) [16, 17]. DEA is a methodology based on applications of linear programming and non-parametric method used for the measurement of TE [18]. It has the advantage of considering multiple input and multiple output simultaneously and the calculation of TE of each DMU [19]. TE and regional components in Thai agriculture will provide strategic constant returns to scale (CRS); therefore, this study focused on the TE assessment of different DMUs. Such an assessment could provide a detailed understanding of the nature of technical performance of the agricultural sector, especially in Thai rice-producing regions. However, a substantial part of traditional DEA model is to ignore environmental factors that have an impact on rice production. Thus, the purpose of this study measured the TE of Thai rice production in different regions from 2006 to 2015, using a three-stage DEA model. This model eliminates environmental factors, which reflect the real level of operational efficiency. Few empirical studies have measured the efficiency performance of the operation or management of rice production by using a three-stage DEA due to data limitations and the difficulty in determining the inputs and outputs of production. Banker and Morey [20] used one-stage DEA model to control for these exogenous variables and this model limits the reference set for identifying benchmark performance based on the exogenous variable [21]. When there are multiple exogenous variables, the one-stage model suffers from the curse of dimensionality and cannot discriminate inefficient performance [21]. Thus, to fix this problem the economists suggested a three-stage DEA model. Environmental variables can be considered using several approaches such as the three-stage method developed by Charnes et al. [22]. According to Ferrier and Lovell [23] have used the inclusion of environmental variables directly into the linear programming formulation. Therefore, the latest development of three-stage DEA model proposed by Fried et al. [24]. Kao [25] studied the efficiency measurement and decomposition of environmental and random factors by three-stage approach. Efficiency decomposition allows decision makers to improve performance and to identify the stages that cause the inefficiency of the system. Chauhan et al. [26] used DEA to measure the efficiency of rice production between efficient and inefficient farmers. Efficiency of rice production has been particularly interesting for economists and policymakers due to the strong relationship between rice production and food security [27, 28]. Thus, evaluating the technical performance is a very important part in the development of an agricultural sector of a country. Krasachat [29] investigated the TE of Thai rice farms in 1999 by DEA approach and Tobit regression. The inputs had six variables (fertilizer, labor, capital, land and other inputs) and one output (rice quantity). The results indicated that there are significant possibilities to increase the efficiency of rice farms in Thailand. Tung [30] surveyed the TE of rice production across the regions of Vietnam. The DEA model had one output (quantity of rice) and six inputs (cultivated area, fertilizer, family labor, seed, pesticide and others). The results reflected that TE levels have a very different in each region, thus, they recommended that the measuring and comparing the TE of rice production should be carried out in all regions, not only to the specific region.
Mohammadi et al. [31] measured the efficiency of 82 rice fields for spring and summer growing seasons in north of Iran using the DEA method and had eight inputs (labor, diesel, machinery, water, fertilizer, seed, chemicals and electricity) and one output (quantity of rice). The results showed that the impact of TE of the spring than summer seasons. Therefore, the above review has shown that this distinctive technique is an appropriate and useful research method for measuring the TE of rice production in Thailand.
2
DATA
AND
METHODOLOGY
DEA approach is a popular tool and most commonly used to analyze the efficiency in various fields of research in agricultural economics [32, 33]. This technique was developed to measure efficiency of DMUs and the advantage of this method is the ability to manage multiple inputs and multiple outputs [34]. The original DEA model was developed by Charnes et al. [35] and was based on the assumption of CRS. Banker et al. [36] modified it to accommodate technologies that exhibit variable returns to scale (VRS). DEA is an excellent empirical model to identify specific benchmarks for performance evaluation of each DMU [21], which is different from parametric methods as they require a detailed knowledge of the processes under investigation. However, the traditional DEA is unable to consider or eliminate the factors beyond the control of the production units (environmental factors). Therefore, Banker and Morey [20] recommend one-stage DEA model to control for these external variables but Rho and An [37] and Ruggiero [38] proposed that the use of one-stage may result in a performance evaluation that is not valid and unable to discriminate inefficient performance. To fix this problem, Fried et al. [24] has developed a three-stage DEA model. Fried et al. [24] studied a three-stage model to determine the distinguishing environmental effects and statistical noise into producer performance evaluation. Thus, we examined the efficiency performance of Thai rice production by using a three-stage DEA model. In the first stage, we investigate the efficiency levels using a simple model and the effects of external factors on production. In the second stage, we use ordinary least squares (OLS) to control the influence of external factors by integrating environmental factors into one combined non-discretionary inputs. The performance is measured again and the input variables are adjusted according to the effects of the environmental
_________________________
Surakiat Parichatnon is a Ph.D. student in the Department of Tropical Agriculture and International Cooperation, National Pingtung University of Science and Technology, No.1, Shuefu Road, Neipu, Pingtung 91201, Taiwan; [email protected]; [email protected]
Kamonthip Maichum is a Ph.D. student in the Department of Tropical Agriculture and International Cooperation, National Pingtung University of Science and Technology, No.1, Shuefu Road, Neipu, Pingtung 91201, Taiwan; [email protected]; [email protected]
154 variables and exclusion of input slacks. The correlation
coefficient from OLS regression are used to combined the multiple external variables to construct an index of environmental influence [21]. Moreover, Simar and Wilson [39] claimed that the second stage model was biased. Therefore, to eliminate inefficiency and environmental factors, it is necessary to use a third-stage DEA model. Finally, third-stage of the model, we used the input variables are adjusted from the second stage and output variable remains unchanged from the first stage. Our modified model is briefly explained below.
2.1 Three-Stage DEA Model
2.1.1 Stage 1: CCR-Traditional DEA Model
As the first DEA model, we used CCR model developed by Charnes Cooper and Rhodes in 1978 [35] and based on CRS model. It is appropriate when it operates at optimum levels [40]. Consequently, easily applied in various fields. We use the term DMU to refer to any entity that has been evaluated in terms of their ability to transform inputs into outputs. This study selects n (n = 77 cities in 4 regions) as the DMU to evaluate the performance of rice production in Thailand. For each DMU, we use a different input and can produce a different output. In this study, the purpose function for the particular DMU being assessed, can be written symbolically as follows [35]:
where TEk is technical efficiency of firm k using m inputs to produce s outputs; yrk is the quantity of output r produced by firm k; xik is the quantity of input i consumed by firm k; ur is the weight of output r; vi is the weight of input i. CCR model can be divided into input-oriented and output-oriented model. In this study used input-oriented model for measuring efficiency of rice production in Thailand. Thus, the input-oriented linear programming equation for the CCR models can be expressed as shown in equation (2).
(2)
Subject to
where ε is the non-Archimedean value defined to be smaller than any positive real number in the calculations; λj represents the associated weighting of outputs and inputs of firm j; si
is the input slacks and sr
+
is the output slacks; m is the number of inputs; s is the number of outputs; n is the number of firms to be evaluated. The firm k is efficient performance only if: (1) TEk = θk = 1 and (2) the slacks si
-, sr
+
= 0 r = 1, 2,…, s and i = 1, 2,…, m. This above equation is suitable for in-depth analysis, especially the multi-stage methods. Equation (2) implicitly assumes CRS, which means that the firm increases
production by the same percentage for a given investment as the input, moreover, the scale of the investment does not affect efficiency performance [41]. Since the first stage cannot distinguish or eliminate the impact of external factors and random errors. TE scores do not reflect the real causes of inefficiency of the production. For this reason, to measure efficiency performance of firms (DMUs), we should peel the external factors and statistical noise out. Thus, the second stage is needed.
2.1.2 Stage 2: OLS Regression of DEA Model
The TE scores in first stage are influenced by external factors and statistical noise; hence, we are unable to know the actual scores of efficiency in rice production of each region. For this reason, we propose using OLS regression in the second-stage of DEA model to efficiency estimates on the environmental variables that affect efficiency in production can be achieved by using slack variables on each of input variable. OLS regression analysis is widely used for fitting linear statistical model [42]. It can be written the form of a linear programming model [43, 44] as follows:
where Yi is case i sample on the dependent variable; xik = xi, xi2,…, xir are case i score on the k of r observable independent variable (environmental variables); εi is the random error term or residuals; βk = β1, β2,…, βp are case k slope coefficients regression. They have a value for each independent variable representing the strength and type of relationship the independent variable are to the dependent variable [42]. OLS estimated coefficients are simple forms that are closely related to the correlation between dependent and independent variables. The adjusting input variable of each DMU based on environment factors and receive opportunities by uplifting the data of input variables suggested by Fried et al. [24]. The adjusted equation is as follows:
In equation (4), xir is original input; xir’ is adjusted inputs; is all of DMUs adjusted under the same environmental factors and is adjusted random errors of all DMUs in the same context to make sure each DMU has the same operating environment. If which DMU has the correlation coefficients of environmental factors is negative effects on the input slack variables this means that firm is managed with a good environment and beneficial which reflects that the actual operating efficiency through the adjustment in second-stage of DEA model.
2.1.3 Stage 3: Adjusted Inputs of DEA Model
In this process, the same principle from the first-stage is followed. We used output variable from stage 1 but the original input variables from first-stage are replaced with adjusted input variables from the second-stage. Therefore, we obtained the actual efficiency scores of each DMU in the model since the effects of environmental variables were eliminated together with the statistical noise. Notably, Fried et al. [24] suggested that the environmental factors have effect on TE scores for each DMU.
(1)
(3)
155
2.2 Variables and Data Analysis
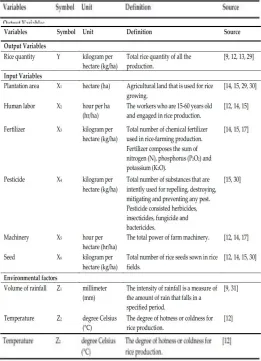
The data used in this study are from secondary data collected from surveys through various Thai governmental agencies: Rice Department of Ministry of Agriculture and Cooperatives, Office of Agricultural Economics, Thai Meteorological Department and Ministry of Labor. We analyzed rice production to assess efficiency of the production from 2006 to 2015 and examined four regions, namely northern, northeastern, central, and southern regions in Thailand covering 77 cities. Zeng et al. [41] recommended that the selection of the output and input variables is a critical component of an analysis based on the DEA model. DEA is a measure of performance and output and input variables of each DMU are the basic components of efficiency. Thus, the selection variables are very important in determining the measurement of efficiency. This study considers the output variable, that is rice quantity (Y) and we analyzed a total of six input variables, namely planted area (X1), human labor (X2), fertilizer (X3), pesticide (X4), machinery (X5) and seed (X6). Furthermore, the analysis of two environmental factors includes volume of rainfall (Z1) and temperature (Z2). Data descriptions can be seen in Table 1.
Table 1. Data descriptions of variables items and source
Data analysis of this study was conducted using DEAP Version 2.1 and SPSS Version 23.0. Table 2 presented descriptive statistics using in this study for rice production in Thailand from year 2006 to 2015. In terms of output, an average of rice quantity shows a very high number at
318,650.78 kg/ha with the maximum quantity of 680,632 kg/ha and the minimum quantity of 30,462.08 kg/ha. On the inputs side, the average plantation area was quite big (128,564.84 ha), while the human labor had the highest average value at 1,479.50 hr/ha. The results showed that on average, fertilizer used was 20,893.73 kg/ha, pesticide was 2,329 kg/ha, machinery was 31.73 hr/ha and number of seeds were high at 12,250.21 kg/ha in the rice production sector. In addition, the averages of environmental factors were 1,574.50 mm and 32.37 °C for volume of rainfall and temperature, respectively.
Table 2. Descriptive statistics of the input, output and environmental factors in Thailand
3
R
ESULTS ANDD
ISCUSSION3.1 Result of Stage 1: Using the Traditional DEA Model
156 technical performance.
Table 3. Efficiency scores of the first stage
3.2 Result of Stage 2: OLS Model
In the second stage was used OLS model to obtain estimates of the deterministic frontiers for six input slacks from 2006 to 2015. We used slack variables of various input variables calculated in the first stage, and are dependent variables in the second stage. Input slack variables taken as dependent variables were planted area, human labor, fertilizer, pesticide, machinery and seed. The environmental variables were temperature and rainfall volume, which were used as independent variables in the OLS estimations. The results of the OLS regression are shown in Table 4. In summary, the estimating correlation coefficients of the six input variables are all significant at 1%, 5% and 10% level. It is necessary to eliminate the environmental factors and input adjustments from the model to obtain technical efficiency and to reduce the external factors that have an impact on rice production. From Table 4, we find that the estimating correlation coefficients of temperature had negative significant impacts on four input variables (human labor, fertilizer, pesticide and seed), therefore indicating that when the temperature increase will result in a reduction of all this four inputs of production, which reflects an improvement in the efficiency of rice production. In addition, the regression coefficients of temperature had positive significant impacts on planted area and machinery for rice production. Moreover, the estimating correlation coefficients of rainfall volume for three types of input variables are positive, indicating that when the rainfall volume increased, the efficiency of planted area, fertilizer and pesticide were reduced. On the other hand, the correlation coefficient of rainfall volume has a negative relationship with the three input slack variables (human labor, machinery and seed). Consequently, if a region has high rainfall volume, the technical performance is high, reflecting an improvement in that region. Hossain et al. [45] used the environmental factors (temperature and rainfall) in DEA for studying the impact on the efficiency of rice production in Bangladesh and found that environmental factors have significant influence on rice production. Therefore, this study supports the findings of Hossain et al. [45] and Karim et al. [46]. The study concluded that the different environmental factors have effects on the efficiency of Thai rice production in 2006-2015 and hence contribute to the production of each DMU is different. This study suggests that if we want to measure the efficiency of different DMU, we should eliminate the environment variables;
otherwise we will not be able to measure the actual efficiency of the production process. In order to avoid the advantage or disadvantage between DMU, the method proposed by Portela et al. [47] was used to deal with the problem of this negative data before proceeding to the next step.
Table 4. Outcome of the secondary stage
3.3 Result of Stage 3: The Adjusted Input Variables in DEA Model
According to Fried et al. [24], in this stage the adjusted input variables from second stage and original output from first stage should be used. This study used DEAP 2.1 software to measure efficiency after adjusting the input variables and without environmental variables in the model and the results are shown in Table 5. The average of TE from 2006 to 2015 was 0.858 including SD, average maximum and average minimum of TE were 0.045, 0.919 and 0.796, respectively. Comparing the results between stage 1 and stage 3, we found that stage 1 had an average TE, SD, the average maximum and average minimum of TE less than that of stage 3. Furthermore, the central region in 2007 and northeastern region in 2008 had TE score equal 1.000; so, all of them fall on TE frontier curve after adjustment. Therefore, we summarize that rice production is moving from decreasing returns to scale (DRS) to increasing returns to scale (IRS) through the adjustment of input variables and the elimination of environmental factors. It means that the production scales of the DMUs were adjusted and close to the optimum scale [48, 49]. The northeastern region had higher efficiency scores when compared to other regions, followed by central, northern and southern.
157
4
C
ONCLUSIONRice is a preeminent crop in Thai agriculture and its production has an important role in the economic and social development of the country. This study has measured the TE of rice production during the period 2006-2015 and research areas consisted of 77 cities grouped into four regions in Thailand. For this purpose, a three-stage DEA model was utilized as the main research method. This method allows the determination of the best practice producers and can also provide helpful insights for rice production management. The average efficiency scores of the third-stage DEA model were higher than the average efficiency scores in first-stage model, resulting in an overall high efficiency of rice production. The TE scores of Thai rice production revealed favorable results, however, Thai rice production efficiency still needs to be improved since the TE score is not close to 1, and in order to maintain standards of rice production and to develop the production techniques. The empirical findings reported that northeastern region had the best scores of TE and acceptance of productivity among the four different regions in 2006-2015. This suggests that the northeastern region is best suited for rice production. On the other hand, southern region has the worst efficiency performance; thus, faced a critical problem of rice technology production. The main reason is an input-output combination, of which in this region there is an excessive use of input factors leading to low efficiency. In addition, environmental factors have significant effects on rice production. Therefore, it is necessary to adjust the inputs in second-stage of the model and to perform degrading influence of environmental factors. This study suggests that focus should be to improve the efficiency of rice production, especially in the southern region followed by northern, central and northeastern regions, respectively. From the above observation, we recommend the following; pay attention to zoning areas for rice production and the land holdings to improve farmers’ efficiency performance, which is the most valuable resource management. Second, the government should focus on the useful policies to support facilities, modern agricultural machinery and training of advance technology to farmers; so, they can acquire new knowledge and new machinery to develop their own farms. Furthermore, this study can provide critical information to farmers, agricultural planners and the Thai government departments to determine strategies that are useful and practical in raising efficiency performance in each region and to help increase the trend of rice productivity index in some areas of Thailand.
A
CKNOWLEDGMENTWe would like to thank the Thai government agencies for the data and the reviewers of this paper for their valuable comments.
R
EFERENCES[1] Muthayya S., Sugimoto J.D., Montgomery S. & Maberly G.F. An overview of global rice production, supply, trade, and consumption. Annals of the New York Academy of Sciences. (2014) 1324, 7-14.
[2] Van Nguyen N. & Ferrero A. Meeting the challenges of global rice production. Paddy and Water Environment. (2006) 4, 1-9.
[3] Rai M. Rice culture in agriculture: Indian perspective.
Science, Technology, and Trade for Peace and Prosperity. (2009), 89-100.
[4] Titapiwatanakun B. The Rice Situation in Thailand. Technical Assistance Consultant’s Report, Asian Development Bank. (2012) 1, 1-29.
[5] National Statistical Office. Statistical Yearbook Thailand. National Statistical Office, Office of the Prime Minister, Bangkok, Thailand, 2016.
[6] Food and Agriculture Organization. 2016. Rice Market
Monitor. Avaliable online:
http://www.fao.org/fileadmin/templates/est/COMM_M ARKETS_MONITORING/Rice/Images/RMM/RMM-Oct16_H.pdf (accessed on 13 October 2016).
[7] Office of Agricultural Economics. Agricultural statistics of Thailand in 2015. Ministry of Agriculture and Cooperative, Bangkok, Thailand, 2016.
[8] Longpichai O., Perret S.R. & Shivakoti G.P. Role of livelihood capital in shaping the farming strategies and outcomes of smallholder rubber producers in southern Thailand. Outlook on Agriculture. (2012) 41, 117-24.
[9] Wijnhoud J., Konboon Y. & Lefroy R.D. Nutrient budgets: sustainability assessment of rainfed lowland rice-based systems in northeast Thailand. Agriculture, Ecosystems & Environment. (2003) 100, 119-27.
[10] De Koeijer T., Wossink G., Struik P. & Renkema J. Measuring agricultural sustainability in terms of efficiency: the case of Dutch sugar beet growers. Journal of environmental management. (2002) 66, 9-17.
[11] Nowak A., Kijek T. & Domanska K. Technical efficiency and its determinants in the European Union agriculture. Agric Econ(Zemedelská Ekonomika). (2015) 6, 275-83.
[12] Rahman S. & Rahman M. Impact of land fragmentation and resource ownership on productivity and efficiency: The case of rice producers in Bangladesh. Land Use Policy. (2009) 26, 95-103.
[13] Sherlund S.M., Barrett C.B. & Adesina A.A. Smallholder technical efficiency controlling for environmental production conditions. Journal of Development Economics (2002) 69, 85-101.
[14] Dhungana B.R., Nuthall P.L. & Nartea G.V. Measuring the economic inefficiency of Nepalese rice farms using data envelopment analysis. Australian Journal of Agricultural and Resource Economics. (2004) 48, 347-69.
158 [16] Masuda K. Optimization Model for Mitigating Global
Warming at the Farm Scale: An Application to Japanese Rice Farms. Sustainability. (2016) 8, 593.
[17] Nassiri S.M. & Singh S. Study on energy use efficiency for paddy crop using data envelopment analysis (DEA) technique. Applied Energy. (2009) 86, 1320-5.
[18] Sexton T.R. The methodology of data envelopment analysis. New directions for program evaluation. (1986) 1986, 7-29.
[19] Waduge T., Edirisnghe J., Fernando A., Herath H. & Jayasinghe-Mudalige U. Labour and weather related risks in smallholder rubber production: evidence from Kalutara district. Tropical Agricultural Research and Extension. (2015) 16, 88-92.
[20] Banker R.D. & Morey R.C. Efficiency analysis for exogenously fixed inputs and outputs. Operations Research. (1986) 34, 513-21.
[21] Estelle S.M., Johnson A.L. & Ruggiero J. Three-stage DEA models for incorporating exogenous inputs. Computers & Operations Research. (2010) 37, 1087-90.
[22] Charnes A., Cooper W.W. & Rhodes E. Evaluating program and managerial efficiency: an application of data envelopment analysis to program follow through. Management science. (1981) 27, 668-97.
[23] Ferrier G.D. & Lovell C.K. Measuring cost efficiency in banking: econometric and linear programming evidence. Journal of econometrics. (1990) 46, 229-45.
[24] Fried H.O., Lovell C.K., Schmidt S.S. & Yaisawarng S. Accounting for environmental effects and statistical noise in data envelopment analysis. Journal of productivity Analysis. (2002) 17, 157-74.
[25] Kao C. Efficiency decomposition for general multi-stage systems in data envelopment analysis. European Journal of Operational Research. (2014) 232, 117-24.
[26] Chauhan N.S., Mohapatra P.K. & Pandey K.P. Improving energy productivity in paddy production through benchmarking—an application of data envelopment analysis. Energy Conversion and Management. (2006) 47, 1063-85.
[27] Yao R.T. & Shively G.E. Technical change and productive efficiency: irrigated rice in the Philippines. Asian Economic Journal. (2007) 21, 155-68.
[28] Travers L. & Ma J. Agricultural productivity and rural poverty in China. China Economic Review. (1994) 5, 141-59.
[29] Krasachat W. Technical efficiencies of rice farms in
Thailand: A nonparametric approach. Hawaii International Conference on Business, Honolulu, June. 2003, p. 2003.
[30] Tung D.T. Regional Differences in Measuring the Technical Efficiency of Rice Production in Vietnam: A Metafrontier Approach. Journal of Agricultural Science. (2014) 6, 147.
[31] Mohammadi A., Rafiee S., Jafari A., Keyhani A., Dalgaard T., Knudsen M.T., et al. Joint Life Cycle Assessment and Data Envelopment Analysis for the benchmarking of environmental impacts in rice paddy production. Journal of Cleaner Production. (2015) 106, 521-32.
[32] Liu J.S., Lu L.Y., Lu W.-M. & Lin B.J. Data envelopment analysis 1978–2010: A citation-based literature survey. Omega. (2013) 41, 3-15.
[33] Barros C.P. & Leach S. Performance evaluation of the English Premier Football League with data envelopment analysis. Applied Economics. (2006) 38, 1449-58.
[34] KOČIŠOVÁ K. Application of the DEA on the measurement of efficiency in the EU countries. Agric Econ–Czech. (2015) 61, 51-62.
[35] Charnes A., Cooper W.W. & Rhodes E. Measuring the efficiency of decision making units. European journal of operational research. (1978) 2, 429-44.
[36] Banker R.D., Charnes A. & Cooper W.W. Some models for estimating technical and scale inefficiencies in data envelopment analysis. Management science. (1984) 30, 1078-92.
[37] Rho S. & An J. Evaluating the efficiency of a two‐stage production process using data envelopment analysis. International transactions in operational research. (2007) 14, 395-410.
[38] Ruggiero J. On the measurement of technical efficiency in the public sector. European Journal of Operational Research. (1996) 90, 553-65.
[39] Simar L. & Wilson P.W. Estimation and inference in two-stage, semi-parametric models of production processes. Journal of econometrics. (2007) 136, 31-64.
[40] Huguenin J.-M. Data Envelopment Analysis and non-discretionary inputs: How to select the most suitable model using multi-criteria decision analysis. Expert Systems with Applications. (2015) 42, 2570-81.
[41] Zeng S., Hu M. & Su B. Research on investment efficiency and policy recommendations for the culture industry of China based on a three-stage DEA. Sustainability. (2016) 8, 324.
heteroskedasticity-159 consistent standard error estimators in OLS
regression: An introduction and software implementation. Behavior research methods. (2007) 39, 709-22.
[43] Aigner D., Lovell C.K. & Schmidt P. Formulation and estimation of stochastic frontier production function models. Journal of Econometrics. (1977) 6, 21-37.
[44] Gstach D. Another approach to data envelopment analysis in noisy environments: DEA. Journal of Productivity Analysis. (1998) 9, 161-76.
[45] Hossain M., Kamil A., Masron T. & Baten M.A. Impact of environmental factors on efficiency of rice production in Bangladesh. Journal of Applied Sciences. (2013).
[46] Karim Z., Hussain S. & Ahmed M. Assessing impacts of climatic variations on foodgrain production in Bangladesh. Climate Change Vulnerability and Adaptation in Asia and the Pacific. Springer. 1996, pp. 53-62.
[47] Portela M.S., Thanassoulis E. & Simpson G. Negative data in DEA: A directional distance approach applied to bank branches. Journal of the Operational Research Society. (2004) 55, 1111-21.
[48] Liu H.-H., Chen T.-Y., Chiu Y.-H. & Kuo F.-H. A comparison of three-stage DEA and artificial neural network on the operational efficiency of semi-conductor firms in Taiwan. (2013).