6650
Process Capability Analysis In Filling Operation –
A Case Study
Arzak M. E., A. Wazeer, Essam K. Saied Ayman A. Abd-Eltwab
Abstract: The aim of this study is to conduct process capability analysis in filling operation. A process capability index can be described as identifying the behavior of a process compared to the engineering specifications. These measures are often called capability or performance indices. Capability indices is applied widespread in industries. The objective of this study is to conduct process capability analysis for filling operation. Industrial example to illustrate filling process monitoring using process capability analysis is presented. The results showed that, the process capability analysis is able to monitor the filling process quality.
Keywords: Process capability analysis, statistical process control, filling operation, control chart.
————————————————————
1 INTRODUCTION
Measuring of a process capability is to know how well the process will meet specification and level of control necessity. Process capability expresses also the ability of the integration of machine, material, people, and methods to obtain a product that will regularly meet engineering specifications. The techniques used for the process capability analysis are histograms, probability plots, and control charts. Control charts and process capability are the effective process monitoring analysis methods (Sagawa & Yamada, 2013). Before analyzing the process capability, the process must be in statistical quality control condition. After the process stability (the process in state of statistical control) has been approved, normality tests must be applied on the process data. Histogram and probability plot are used to test the normality of the data. Process capability can be measured by capability indices. Process capability indices measures the ability of process to meet the required engineering specifications, the most common capability indices used in the manufacturing industries are CP, Cpk, Cpm, and Cpmk for
evaluating the process performance. Pearn and Lin (Pearn & Lin, 2004) studied the process capability indices such as Cp,
Cpk, and CPm. They concluded that, the process capability
index Cpm is better for customer protection. Hsin-Hung (WU, 2004)studied the relationship among loss function, process capability indices and control charts. He stated that by applying the target cost philosophy the quality of products is improved. Rezaie et al (Rezaie, Ostadi, & Taghizadeh, 2006) showed how to use the process capability indices and predict the performance of the process. They stated that, the Cp value of 1.33 is the most commonly acceptable, and Cpk greater than 1.33 means the process is capable. Ghasemi and Zahediasl (Ghasemi & Zahediasl, 2012) presented the procedures for checking normality of data in statistical analysis.
They stated that, the assumption of normality needs to be checked and if the P-value in the P-P plot greater than 0.05 indicates normal distribution of data. Subramani and balamurali (Subramani & Balamurali, 2012) proposed capability-based control charts method in industrial application for on-line process control. This method is simple to apply and does not warrant any tedious computation for control charts and process capability. Sagawa and Yamada (Sagawa & Yamada, 2013) stated that, the application of statistical process control tools such as control charts and process capability allowed improving the production process. Orssatto et al (ORSSATTO, VILAS BOAS, NAGAMINE, & URIBE-OPAZO, 2014) used control charts and process capability ratios to evaluate the performance of the production process. Swamy and Nagesh (Wooluru, Swamy, & Nagesh, 2014) showed the importance of process capability analysis for monitoring and ensuring the production quality. They concluded that, the process must be shown under statistical control and process data is normally distributed before evaluating the process capability. Mondal and Kundu (Mondal & Kundu, 2014) stated that, the data which are collected from the production process must to be normally distributed and the process must to be statistically controlled. Singh and Masuku (Singh & Masuku, 2014) stated that, normality is one of the most important aspects for statistical analysis. Babagana (Modu, 2015) presented the statistical performance of some capability indices such as Cp and Cpk. He stated that, Cp and Cpk are greater than one, and then the process has the potential to meet the specifications as long as the mean is probability centered. Nihan and sundus (Nihan & Sundus, 2015) stated that process capability analysis is an effective method for evaluating the process performance. Raheem et al (Maruf et al, 2016) illustrated the importance of statistical quality control in measuring quality performance in manufacturing industries. The objective of this research is to conduct process capability analysis for filling operation. this study applied through experimental tests results obtained from carbonated drink company as a case study for filling operation.
2 MATERIALS AND METHODS
1.
Theoretical AnalysisThe statistical treatment will be applied in order to optimize the quality of manufacturing processes output. By application of the statistical methods the pest procedures for manufacturing process can be chosen to achieve the required
______________________________
Arzak M. E., A. Wazeer, Essam K. Saied Ayman A. Abd-Eltwab
6651
level of quality. The various computational formula involved in constructing the control charts and for the computational of process capability indices are presented in the following sections.
2.
Control chartA control chart is a graphical display of quality characteristics that has been measured from a sample versus the sample number. The chart contains a center line (CL) which represents the average value of the quality characteristic. Two controls limits: upper control limit (UCL) and lower control limit (LCL) are chosen when the process is in control, all the sample points will fall between them when the process in state of statistical control.
3.
-chart is based on the mean of sample taken from the process under study. To construct a mean chart, we first need to construct the center line (CL) of the chart which is computed as the mean of all in sample means (Montgomry, 2009);
̿
(1)
Where m represents the number of samples. To estimate the upper and lower control limits of the ̅ - chart, the following formulas are used;
Upper control limit (UCL ) =
̿ ̅ ... ( )
Lower control limit (LCL )
= ̿- ̅ (3)
Where:
̿= The Grande average of the sample means. ̅= The sample rang of all m samples.
̅ . .
(4)
4.
The Range (R) chart- - . ( ) and the upper and lower control limits are computed as following (Montgomry, 2009);
CLR = ̅
UCLR =
D4̅ . (5)
LCLR = D3̅
. .. (6)
Whereas
the values of A2, D3 and D4 are obtained from table
1(Montgomry, 2009).
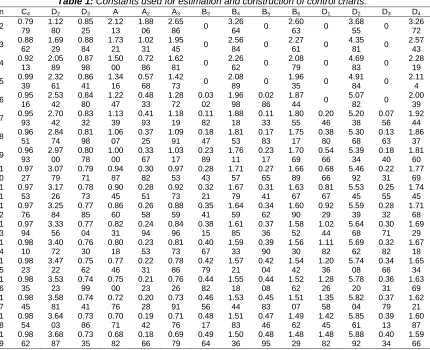
Table 1: Constants used for estimation and construction of control charts.
n C4 D2 D3 A A2 A3 B3 B4 B5 B6 D1 D2 D3 D4
2 0.79 79 1.12 80 0.85 25 2.12 13 1.88 06 2.65 86 0
3.26 64 0
2.60 63 0
3.68 55 0
3.26 72 3 0.88
62 1.69 29 0.88 84 1.73 21 1.02 31 1.95
45 0 2.56
84 0 2.27
61 0 4.35
81 0 2.57
43 4 0.92
13 2.05 89 0.87 98 1.50 00 0.72 86 1.62
81 0 2.26
62 0 2.08
79 0 4.69
83 0 2.28
19 5 0.99
39 2.32 61 0.86 41 1.34 16 0.57 68 1.42
73 0 2.08
89 0 1.96
35 0 4.91
84 0 2.11
4 6 0.95
16 2.53 42 0.84 80 1.22 47 0.48 33 1.28 72 0.03 02 1.96 98 0.02 86 1.87
44 0 5.07
82 0 2.00
39 7 0.95
93 2.70 42 0.83 32 1.13 39 0.41 93 1.18 19 0.11 82 1.88 18 0.11 33 1.80 55 0.20 46 5.20 38 0.07 56 1.92 44 8 0.96
51 2.84 74 0.81 98 1.06 07 0.37 25 1.09 91 0.18 47 1.81 53 0.17 83 1.75 17 0.38 80 5.30 68 0.13 63 1.86 37 9 0.96
6652 2
0 0.98
70 3.73
55 0.72
87 0.67
08 0.17
96 0.67
97 0.50
96 1.49
04 0.50
29 1.47
09 1.54
94 5.92
16 0.41
48 1.58
52 2
1 0.98
75 3.77
79 0.72
42 0.65
47 0.17
33 0.66
29 0.52
31 1.47
69 0.51
66 1.45
86 1.60
53 5.95
05 0.42
49 1.57
51 2
2 0.98
82 3.81
97 0.71
99 0.63
96 0.16
74 0.64
72 0.53
49 1.46
51 0.52
87 1.44
77 1.66
00 5.97
94 0.43
46 1.56
54 2
3 0.98
87 3.85
80 0.71
59 0.62
55 0.16
21 0.63
27 0.54
51 1.45
49 0.53
90 1.43
84 1.71
03 6.00
57 0.44
33 1.55
67 2
4 0.98
92 3.89
56 0.71
21 0.61
24 0.15
72 0.61
91 0.55
55 1.44
45 0.54
95 1.42
89 1.75
93 6.03
19 0.45
16 1.54
84 2
5 0.98
96 3.93
08 0.70
84 0.60
00 0.15
26 0.60
63 0.56
39 1.43
61 0.55
81 1.42
11 1.80
56 6.05
60 0.45
93 1.54
07
5.
Process Capability IndicesProcess capability is identified by capability indices. Process capability indices measure the ability of process to meet engineering limits. process capability indices are only significant for process in control condition. Process capability indices have been widely used in industries for evaluating the process performance. The most common capability indices used in the manufacturing are Cp, Cpk, Cpm and Cpmk. The
techniques used for the process capability analysis probability plots, control charts. Control charts are used to determine whether a process operates under statistical control or not. The process capability indices Cp, Cpk, Cpm, and Cpmk are
considered in this study, these indices explained and estimated in the following sections.
6.
Process capability index CpIt evaluates the performance of the process related to the production specifications. If the value of process capability index Cp greater than 1.00 then the process is capable, and it
is located between the specification limits. It is not able to evaluate the process centering. The formulation of the Cp
index is given as (Wooluru, Swamy, & Nagesh, 2014),
- 6 (7)
Where,
USL = The upper specification limit of the quality characteristic.
LSL = The lower specification limit of the quality characteristic.
.
7.
Process capability index CpkThis capability index takes into consideration the process location. This index does not consider whether the process location deviates from the target, Cp index equals to Cpk index
when the process is centered. The Cpk index estimated by the
following formulation (Wooluru, Swamy, & Nagesh, 2014): Cpk = Min [ Cpu or Cpl] (8)
Where,
- ̿
3 (9)
̿-
3 (10)
8.
Process capability index CpmIt is known as the taguchi capability index. This capability index reflects the process loss. Also, Cpm based on the
difference between process mean and the target value. It can establish more information than Cpk about the location of the
process mean. The Cpm index estimated by the following
formulation (Wooluru, Swamy, & Nagesh, 2014):
√ (̿- )
(11)
Where,
T= The target value of the quality characteristic.
9.
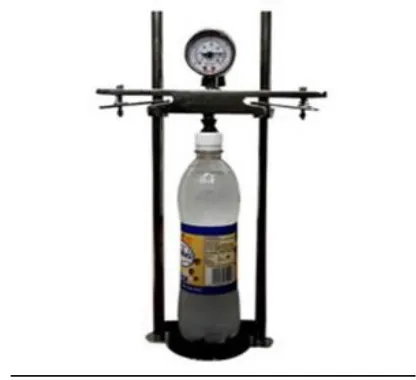
Experimental WorkAn experimental program was designed to conduct process capability analysis for filling operation. Tests were carried out on the products of the machine which used to fill bottles with a carbonated drink beverage. Subgroups of five bottles were sampled regularly from the products and the fill volume measured for each bottle in ml. Twenty-five subgroup of size five bottles were used in the analysis. For measuring the fill volume of the tested samples, Zahm Carbonation tester was used, see figure 1. Tests were carried out in quality control laboratory of carbonated drink beverage company, Beni – Suef, Egypt.
Figure 1. Zahm Carbonation Tester
3 RESULTS AND DISCUSSION
6653
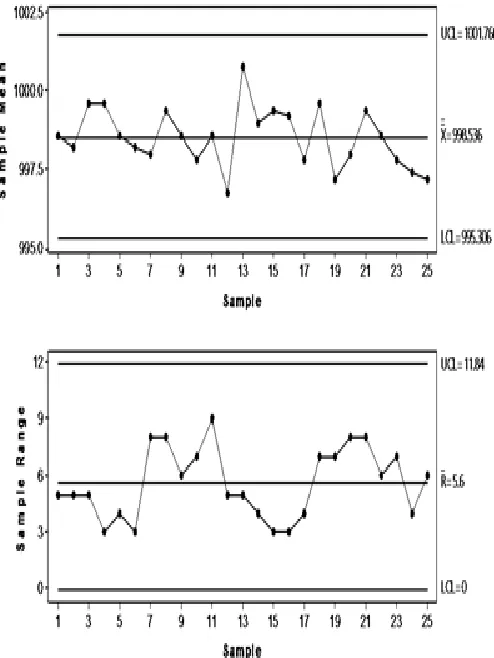
limit (LCL) respectively for R- chart. The calculated values of UCL, CL and LCL are 11.84 ml 5.6 ml and 0.0 respectively. Figure 2 shows the -chart and R-chart for the case study data. It has been observed from figure 2 that, all plotted sample mean, and range values are within the control limits -chart and R-chart and no indication of shift has been noticed. Hence, it is concluded that the process is under statistical control and operating under the influence of only chance causes of variation. The process must be shown under statistical control before evaluating the process capability, according to Orsatto et al.
1.
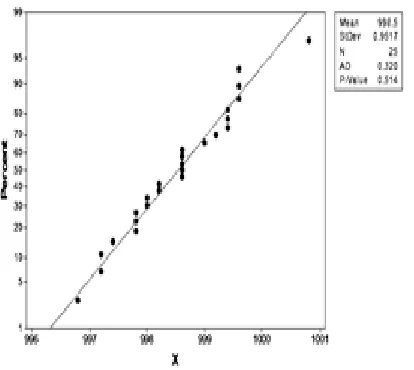
Normal probability plot and histogramFor validating the normality of the case study data, graphical methods including the histogram and normal probability plot were used in this study. Figure 3 displays the histogram and figure 4 displays the normal probability plot for the case study data. From figures 3 and 4, it is clear that, the sample data appears to be normal. Test results for normal probability plot for the data from MINITAB-17 statistical software output shows the process mean = 998.7 ml, standard deviation = 0.9517 ml, Anderson darling test statistic value = 0.320 and P-value = 0.514. The P-value is greater than the significance (α 0.05) y. Thus, it is concluded that the sample data can be regarded as taken from a normal process. The process data must be shown normally distributed before evaluating the process capability according to Orssato et al, Mondal, singh and masukn.
Table 2. The measured values of the fill volume in the tested bottles (Target value = 1000 ± 15 ml)
Sample No.
Measurements
X1 X2 X3 X4 X5 ̅ R
1 996 997 999 1000 1001 998.6 5
2 997 998 996 1001 999 998.2 4
3 998 997 1002 1000 1001 999.6 5 4 1000 998 999 1001 1000 999.6 3
5 998 997 999 998 1001 998.6 4
6 1000 998 998 997 998 998.2 3
7 998 999 994 997 1002 998 8
8 1003 1001 1000 998 995 999.4 8 9 998 999 1000 1001 995 998.6 6 10 994 996 1001 1000 998 997.8 7 11 1003 1000 1001 995 994 998.6 9
12 996 998 999 994 997 996.8 5
13 1002 1003 1001 1000 998 1000.8 5 14 1001 998 997 999 1000 999.0 4 15 999 998 1001 1000 999.0 999.4 3 16 998 1000 1001 998 999.0 999.2 3 17 997 998 996 998 1000 997.8 4 18 1003 999 996 997 1003 999.6 7 19 1000 1001 995 994 996 997.2 7
20 998 999 994 997 1002 998 8
21 1003 1001 1000 998 995 999.4 8 22 998 999 1000 1001 995 998.6 6 23 994 996 1001 1000 998 997.8 7
24 999 996 995 998 999 997.4 4
25 995 1001 999 996 995 997.2 6
Figure 2 ̅ – chart and R – chart for the case study data.
6654 Figure 4 Normal probability plot for the case study data.
2.
Process Capability analysisMINITAB-17, statistical software has been used to perform process capability analysis, Process capability analysis for the case study data shown in figure 5. From this figure, Cp = 5.07,
Cpk = 4.57, and Cpm= 2.82. This case study analysis reveals
that Cp is not equal Cpk which implies that the process is not
exactly centered. Also, Cp, Cpk, and Cpm are not very nearer in
their magnitude and hence it can be state that process under study is not exactly centered. The process capability indices values for the study case are very good and meet 6 requirements. When the process capability Cpand Cpkare
greater than one, the process has the potential to meet the specification according to Modu 2015.
Figure 5 Process capability analysis for the case study data
4 CONCLUSION
1. The case study was conducted in filling industry and examined using CP, Cpk, Cpm and Cpmk index to
illustrate the importance of process capability analysis for monitoring and ensuring the products quality to satisfy the customers' requirements.
2. The validation of process state of control and the normal distribution of the quality characteristic must be tested before estimating the process capability. 3. Process capability index Cpmk does provide more
capability assurance with respect to process yield and process loss to the customers than the other two indices Cpk and Cpm.
5 ACKNOWLEDGMENT
The authors would like to thank Beni-Suef University and Industrial Education College for helping in the research procedures.
6 REFERENCES
[1]. Ghasemi, A., & Zahediasl, S. (2012). Normality Tests for statistical Analysis: A Guide for Non-Statisticians. Int. J. Endocrinol Metab., 486-489. [2]. Maruf Ariyo Raheem, Aramide Titilayo Gbolahan,
Itohowo Eseme Udoada. Application of Statistical Process Control in a ProductionProcess. Science Journal of Applied Mathematics and Statistics. Vol.
4, No. 1, 2016, pp. 1-11. doi:
10.11648/j.sjams.20160401.11
[3]. Modu, B. (2015). Simulation for Performance Analysis of Some Capability Indices on Net-Volume Content of 35cl Coca-Cola Soft Drinks. Scholars Journal of PHYSICS, Mathematics and Statistics, 283-288.
[4]. Mondal, S. C., & Kundu, S. (2014). Application of process capability indices to measure performance of a multistage manufacturing process. AIMTDR, 36.1-36.6.
[5]. Montgomry, D. (2009). Introduction to Statistical Quality Control. John Wiley & Sons, Inc.
[6]. Nihan, K., & Sundus, D. (2015). process performance Analysis in the Production of Medical Bottles. the international journal of Business and management, 159-167.
[7]. ORSSATTO, F., VILAS BOAS, M. A., NAGAMINE, R., & URIBE-OPAZO, M. A. (2014). Shewhart's control charts and process capability ratio applied to a sewage treatment station. Engenharia Agrícola, 770-779.
[8]. Pearn, W., & Lin, P. (2004). Measuring Process Yield based on the Capability index Cpm. International Journal Adv. Manuf. Technol., 503-508.
[9]. Rezaie, K., Ostadi, B., & Taghizadeh, M. (2006). Applications of process Capability and process performance Indices. Journal of Applied Sciences, 1186-1191.
[10]. Sagawa, J. K., & Yamada, R. I. (2013). The Application of Statistical Quality Control Tools To Monitoring Ethanol Process Production. XXXVII National Meeting of Production Engineering, 1-14. [11]. Singh, A. S., & Masuku, M. B. (2014). Normality and
Data Transformation for Applied Statistical Analysis. International Journal of Economics, commerce and Management, 1-11.
6655
[13]. Wooluru, Y., Swamy, D., & Nagesh, P. (2014). The Process Capability Analysis- aTool for Process Performance Measures and Metrics – a Case Study. International Journal for Quality Research, 399-416.