EXAMINING CRASH VARIABLE BASED ON COLLISION TYPE
FOR PREDICTING CRASH SEVERITY ON URBAN HIGHWAYS
Govindaraju Vijay1, Ramesh Adepu21, Kumar Molugaram3
1,2 Department of Civil Engineering, VNR Vignana Jyothi Institute of Engineering and Technology,
Hyderabad, Telangana, India
3 Department of Civil Engineering, University College of Engineering Osmania University, Hyderabad,
Telangana, India
Received 1 April 2016; accepted 11 July 2017
Abstract: Transportation facilities are the backbone for any economic growth in country’s development. However, presently highways are the biggest threat to the world as they account for the largest number of road crashes. As a highway engineer emphasis should be made on reducing the occurrence of road crashes and understanding the causative factors. It is also important to understand the relationships between the severities of a road crash in the context with collision types. Several studies were carried on factors that influence on severity of crashes. The present paper attempts to explore the various factors associated with crash prediction on Indian highway. The study was conducted on National Highway NH-44 in Hyderabad city of Telangana State. Multinomial logit model was used for assessing the variables that influence the crash severity. The model reveals that vehicle type plays a major role in increasing the severity of the crash on highways. The model will be useful for the highway planner while improving the road section reducing the number of crashes.
Keywords: crash, collision, highway, multinomial logit.
2 Corresponding author: [email protected]
1. Introduction and Review of Literature
An in-depth understanding of the random nature of crash process is one of the most interesting as well as essential aspects of traffic safety analysis. These will be widely used in practical implications for providing a safe transportation facility. In India, the highest number of fatal road crashes occurs on National Highways (NH) as 32.6% followed by State Highways (SH) as 27.8% fatality (NCRB, 2014). Understanding ‘the random nature of crash process’ on highway segments is of utmost importance as this can pave way for timely interventions to save precious lives. In this context a study was
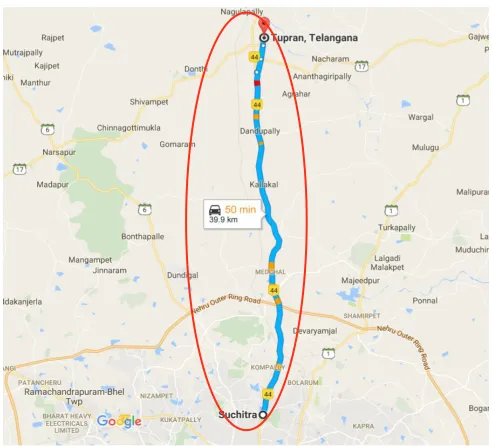
conducted on NH 44 from Suchitra to Tupran for about 40kms in length in Hyderabad city of Telangana State. It is observed that 802 crashes have occurred during the last 5 years period on this highway segment. This paper explains the causative factors that influence the collision pattern for occurrence of crash. Several studies were carried during a decade period for developing crash prediction models through statistical tools.
a single crash model. Khattaket al., (1998) estimated binary probit models to analyse severity of crashes during adverse weather conditions and identified that the frequency of crashes is higher during adverse weather but their severity is low. Dissanayake and Lu (2002) explained that a set of binary logistic regression models for single-vehicle crash data and identified important factors that result in higher crashes and severe injuries. Abdel-Aty (2003) analysed the severity of crashes at different locations using ordered probit models and identified variables that significantly cause severe injuries for that particular location. Donnell and Mason (2004) developed logistic regression models for cross-median and median crashes by considering the severity of a crash as ordinal response and nominal response respectively. Lordet al., (2005) utilized zero-inflated Poisson and negative models on crash data and concluded that these are the most reliable models when crash count data has a large number of samples that are ‘perfectly safe’. Lord (2006) fitted Poisson-gamma models on crash data that has a low sample mean and small sample size and showed that they have a very serious effect on the estimated parameters of the model and reduce the reliability of the model. Qinet al., (2006) investigated the relationship between crash occurrence and hourly volume by fitting binary regression models. He has concluded that the relationship between crash types and independents is non-linear in nature. Kim et al.,(2007) applied multilevel binomial logistic models in order to predict the probability of different crashes based on the hypothesis that the intersection crashes are hierarchical in nature. Huanget al.,(2008) established a Bayesian hierarchical binomial logistic model and identified that light weight vehicles cause major injuries. Quddus et al., (2009) used ordered-response models to
observe the effect of traffic congestion on crash severity and found that there is no relationship between them. Geedipally et al., (2010) developed multinomial logit models for different crash types and found that predicting crash counts by specific crash type is the best among the existing methods. Ramesh and Kumar (2011) explained the current road safety level in Hyderabad city. Multinomial regression analysis was carried for analysing accident prediction model. Black spots were also identified using statistical methods. Yasmin and Eluru (2013) compared various crash data models and concluded that mixed generalized ordered logit competes with mixed multinomial logit in modelling crash type data. Ye and Lord (2014) examined the effect of sample size and concluded that ordered probit model can work efficiently for smaller sample sizes. De Luca (2015) worked on accident data using multivariate analysis and artificial neural networks and concluded that multivariate analysis is more efficient in the analysis of blackspots. Nivedithaet al., (2015) explained that logit models are suitable for prediction of the crash. The results explain that shoulder condition is an affecting factor for the occurrence of non-fatal crashes in the city.
2. Methodology
Multinomial Logit (MNL) Modelwas used in predicting the impact of crashes on the basis of collision type. This is accomplished by establishing a relationship between the severity of the crash and crash variables. Table 1 provides the crash variables and its code used for model development.
H o s m e r a n d L e m e s h o w (2 0 0 0) mathematical expressions were used for model development, where Y is considered as severity of the crash and x1, x2, x3, x4, x5
as crash variables. Y consists of 4 levels namely non injury, minor injury, grievous injury and fatal injury. We have three logit functions as logit1, logit2, logit3, expressed
mathematically as below.
(1)
(2)
(3)
Where: logit1 represents a logit function
for Minor Injury versus Non-Injury, logit2
for Grievous Injury versus Non-Injury and logit3 for Fatal Injury versus Non-Injury.
β10,β20,β30 represent the intercepts and the
remaining β’s represent the coefficients of the characteristics.
The odds ratio is the exponent of the coefficient obtained for characteristic in the logit model. When odds ratio < 1, there is a higher chance for occurrence of non-injury. If the odds ratio > 1, it implies that an increase in the level of crash variable/ characteristic leads to a higher chance of
occurrence of crash severity, i.e. minor injury for logit1, grievous injury for logit2 and fatal
injury for logit3. MNL model is tested for
its significance using likelihood ratio. The statistical analysis was implemented by multinom() in nnet package of R 3.3.1.
3. Data Collection
Fig. 1.
Study Location for Crash Analysis
It is observed from the data that crash is influencing the following collision types:
a) Head-on Collision b) Rear-end Collision c) Side swipe Collision.
The true impact of collision type shall be used in assessing the severity of the crash. Theseverity of crash in the study locationis observed in four levels (“Severity of Crash/ Code”): Non-Injury/0, Minor Injury/1, Grievous Injury/2, Fatal Injury/3.
Table 1
Variables Influencing Severity of Crash
S.No. Crash characteristic Codes
1 Causes
1 = Drunken Driving 2 = Drowsing 3 = Over speeding 4 = Vehicle out of control 5 = Fault of two-wheeler/pedestrian 6 = Defect in condition of vehicle condition 2 Road curve radius 2 = Slight Curve - 750 ≤ R ≤ 900 m1 = Straight Road
3 = Sharp Curve - 300 ≤ R ≤ 400 m 3 Vehicle responsible 2 = Heavy weight1 = Light weight
4 Pavement Condition 2 = Wet Pavement (Rain)1 = Dry Pavement
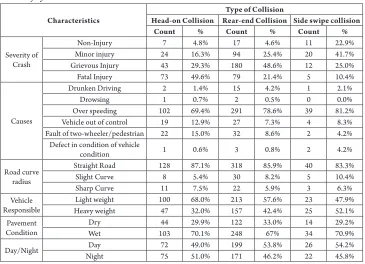
Crash characteristics and severity of crash for each collision type is shown in Table 2.
Table 2
Summary of Crash Characteristics
Characteristics
Type of Collision
Head-on Collision Rear-end Collision Side swipe collision
Count % Count % Count %
Severity of Crash
Non-Injury 7 4.8% 17 4.6% 11 22.9%
Minor injury 24 16.3% 94 25.4% 20 41.7%
Grievous Injury 43 29.3% 180 48.6% 12 25.0%
Fatal Injury 73 49.6% 79 21.4% 5 10.4%
Causes
Drunken Driving 2 1.4% 15 4.2% 1 2.1%
Drowsing 1 0.7% 2 0.5% 0 0.0%
Over speeding 102 69.4% 291 78.6% 39 81.2%
Vehicle out of control 19 12.9% 27 7.3% 4 8.3%
Fault of two-wheeler/pedestrian 22 15.0% 32 8.6% 2 4.2%
Defect in condition of vehicle
condition 1 0.6% 3 0.8% 2 4.2%
Road curve radius
Straight Road 128 87.1% 318 85.9% 40 83.3%
Slight Curve 8 5.4% 30 8.2% 5 10.4%
Sharp Curve 11 7.5% 22 5.9% 3 6.3%
Vehicle
Responsible Heavy weightLight weight 10047 68.0%32.0% 213157 57.6%42.4% 2325 47.9%52.1% Pavement
Condition DryWet 10344 29.9%70.1% 122248 33.0%67% 1434 29.2%70.9%
Day/Night Day 72 49.0% 199 53.8% 26 54.2%
Night 75 51.0% 171 46.2% 22 45.8%
4. Model Interpretation and Findings
Four Multinomial logistic models are developed to predict the severity of the crash. The first MNL explains on total Collisions and the remaining three models explain on Head-on Collision, Rear-end Collision and Sideswipe Collision respectively. The coefficients of characteristics along with their Standard Errors (SE) and odds ratios are computed for each model. A Z-statistic with its p-value is observed for estimated coefficients which explain the influence of crash variables in the model. These are presented in the tables 3-7.
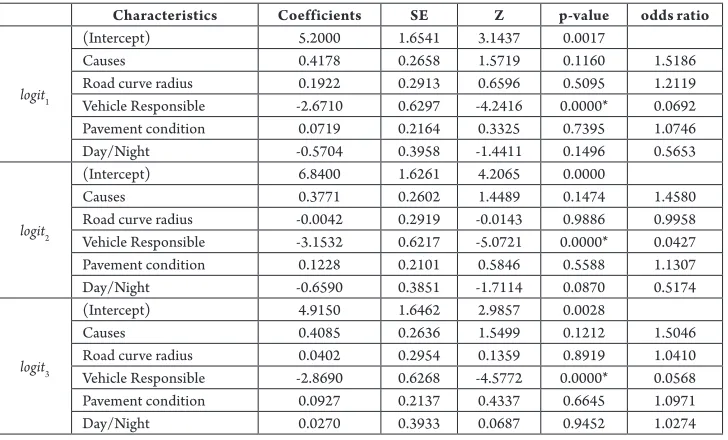
Table 3 interprets that for logit1, the
and day/night indicating a higher chance for non-injury when the values of these characteristics increase.
In case of logit2 two characteristics namely
causes and pavement condition have positive coefficients implying that a unit increase in these characteristics results in an increase in the chance of grievous injury. A unit decrease in road curve radius, vehicle responsible and day/night leads to an increase in the chance of grievous injury. The odds ratios of causes and pavement condition are greater than 1 implying that a grievous injury has a higher chance of occurrence as the values of these characteristics increase. The odds ratios for road curve radius, vehicle responsible and day/night are less than 1 indicating that the chance of occurrence of non-injury increases as the values of these characteristics increases.
In logit3, all characteristics except vehicle
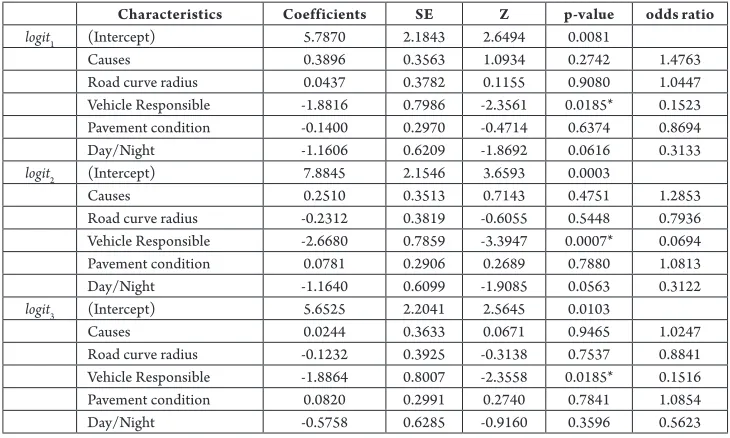
responsible have positive coefficients indicating that a unit increase in each of these characteristics implies a corresponding increase in the chance of fatal injury. The characteristic vehicle responsible has a negative coefficient implying that a unit increase in this characteristic decreases the chance of fatal injury. The odds ratio of causes, road curve radius, pavement condition and day/night is greater than 1 depicting that an increase in the values of these characteristics results in a higher chance for occurrence of fatal injury. The odds ratio of vehicle responsible is less than 1 which means that increase in the value of this characteristic leads to a higher chance of non-injury. Tables 4, 5 and 6 interpret for head-on, rear-end and side swipe collision types with the characteristics influencing severity of crash.
Table 3
Estimated Coefficients, Standard Errors and Their Odds Ratios for Total Collisions MNL Model
Characteristics Coefficients SE Z p-value odds ratio
logit1
(Intercept) 5.2000 1.6541 3.1437 0.0017
Causes 0.4178 0.2658 1.5719 0.1160 1.5186
Road curve radius 0.1922 0.2913 0.6596 0.5095 1.2119
Vehicle Responsible -2.6710 0.6297 -4.2416 0.0000* 0.0692
Pavement condition 0.0719 0.2164 0.3325 0.7395 1.0746
Day/Night -0.5704 0.3958 -1.4411 0.1496 0.5653
logit2
(Intercept) 6.8400 1.6261 4.2065 0.0000
Causes 0.3771 0.2602 1.4489 0.1474 1.4580
Road curve radius -0.0042 0.2919 -0.0143 0.9886 0.9958
Vehicle Responsible -3.1532 0.6217 -5.0721 0.0000* 0.0427
Pavement condition 0.1228 0.2101 0.5846 0.5588 1.1307
Day/Night -0.6590 0.3851 -1.7114 0.0870 0.5174
logit3
(Intercept) 4.9150 1.6462 2.9857 0.0028
Causes 0.4085 0.2636 1.5499 0.1212 1.5046
Road curve radius 0.0402 0.2954 0.1359 0.8919 1.0410
Vehicle Responsible -2.8690 0.6268 -4.5772 0.0000* 0.0568
Pavement condition 0.0927 0.2137 0.4337 0.6645 1.0971
Day/Night 0.0270 0.3933 0.0687 0.9452 1.0274
Table 4
Estimated Coefficients, Standard Errors and Their Odds Ratios for Head-on Collision MNL Model
Characteristics Coefficients SE Z p-value odds ratio
logit1 (Intercept) 22.9207 1.4946 15.3357 0.0000
Causes 1.1562 1.1556 1.0005 0.3170 3.1778
Road curve radius 0.0376 0.5668 0.0663 0.9472 1.0383
Vehicle Responsible -12.5530 1.8545 -6.7691 0.0000* 0.0000
Pavement condition 0.0913 0.5560 0.1643 0.8695 1.0957
Day Night -1.2169 1.0094 -1.2055 0.2280 0.2962
logit2 (Intercept) 22.8150 1.3140 17.3634 0.0000
Causes 1.2176 1.1400 1.0681 0.2855 3.3791
Road curve radius -0.0968 0.5549 -0.1745 0.8615 0.9077
Vehicle Responsible -12.4542 1.8444 -6.7523 0.0000* 0.0000
Pavement condition -0.0495 0.5266 -0.0940 0.9251 0.9517
Day Night -0.6088 0.9497 -0.6410 0.5215 0.5440
logit3 (Intercept) 21.7772 1.2442 17.5024 0.0000
Causes 1.2411 1.1337 1.0947 0.2736 3.4595
Road curve radius 0.0548 0.5342 0.1026 0.9183 1.0564
Vehicle Responsible -12.5286 1.8492 -6.7752 0.0000* 0.0000
Pavement condition 0.0588 0.5150 0.1141 0.9092 1.0605
Day Night 0.1499 0.9308 0.1611 0.8720 1.1618
‘*’ indicates a significant characteristic
Table 5
Estimated Coefficients, Standard Errors and Their Odds Ratios for Rear-end Collision MNL Model
Characteristics Coefficients SE Z p-value odds ratio
logit1 (Intercept) 5.7870 2.1843 2.6494 0.0081
Causes 0.3896 0.3563 1.0934 0.2742 1.4763
Road curve radius 0.0437 0.3782 0.1155 0.9080 1.0447
Vehicle Responsible -1.8816 0.7986 -2.3561 0.0185* 0.1523
Pavement condition -0.1400 0.2970 -0.4714 0.6374 0.8694
Day/Night -1.1606 0.6209 -1.8692 0.0616 0.3133
logit2 (Intercept) 7.8845 2.1546 3.6593 0.0003
Causes 0.2510 0.3513 0.7143 0.4751 1.2853
Road curve radius -0.2312 0.3819 -0.6055 0.5448 0.7936
Vehicle Responsible -2.6680 0.7859 -3.3947 0.0007* 0.0694
Pavement condition 0.0781 0.2906 0.2689 0.7880 1.0813
Day/Night -1.1640 0.6099 -1.9085 0.0563 0.3122
logit3 (Intercept) 5.6525 2.2041 2.5645 0.0103
Causes 0.0244 0.3633 0.0671 0.9465 1.0247
Road curve radius -0.1232 0.3925 -0.3138 0.7537 0.8841
Vehicle Responsible -1.8864 0.8007 -2.3558 0.0185* 0.1516
Pavement condition 0.0820 0.2991 0.2740 0.7841 1.0854
Day/Night -0.5758 0.6285 -0.9160 0.3596 0.5623
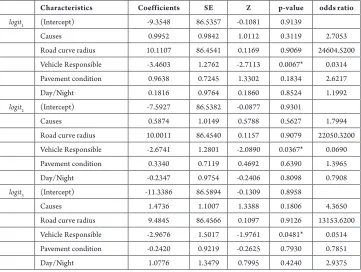
Table 6
Estimated Coefficients, Standard Errors and Their Odds Ratios for Side Swipe Collision MNL Model
Characteristics Coefficients SE Z p-value odds ratio
logit1 (Intercept) -9.3548 86.5357 -0.1081 0.9139
Causes 0.9952 0.9842 1.0112 0.3119 2.7053
Road curve radius 10.1107 86.4541 0.1169 0.9069 24604.5200
Vehicle Responsible -3.4603 1.2762 -2.7113 0.0067* 0.0314
Pavement condition 0.9638 0.7245 1.3302 0.1834 2.6217
Day/Night 0.1816 0.9764 0.1860 0.8524 1.1992
logit2 (Intercept) -7.5927 86.5382 -0.0877 0.9301
Causes 0.5874 1.0149 0.5788 0.5627 1.7994
Road curve radius 10.0011 86.4540 0.1157 0.9079 22050.3200
Vehicle Responsible -2.6741 1.2801 -2.0890 0.0367* 0.0690
Pavement condition 0.3340 0.7119 0.4692 0.6390 1.3965
Day/Night -0.2347 0.9754 -0.2406 0.8098 0.7908
logit3 (Intercept) -11.3386 86.5894 -0.1309 0.8958
Causes 1.4736 1.1007 1.3388 0.1806 4.3650
Road curve radius 9.4845 86.4566 0.1097 0.9126 13153.6200
Vehicle Responsible -2.9676 1.5017 -1.9761 0.0481* 0.0514
Pavement condition -0.2420 0.9219 -0.2625 0.7930 0.7851
Day/Night 1.0776 1.3479 0.7995 0.4240 2.9375
‘*’ indicates a significant characteristic
The results interpret that the above characteristics influence the severity of the crash. The crash variable vehicle responsible is observed as the major factor influencing crash severity. For all collision types, four-wheeler vehicles and below are considered as
light weight vehicles and all vehicles above four-wheelers are considered as heavy weight vehicles in the analysis. It is observed from the results that light weight vehicles have a higher severity of crashes as opposed to heavy weight vehicles.
Table 7
Goodness-of-fit Statistics
Collision type log-likelihood Chi-Square p-value
Total -791.760 73.689 <0.0001
Head-on -168.760 28.706 0.017
Rear-end -432.840 48.983 <0.0001
The log-likelihood measure values for total collisions, head-on, rear-end and Sideswipe are significant at 5% level of significance which concludes that these models provides a good fit to the data.
5. Conclusions
The paper introduces a model-based mechanism to establish relationships between the nature of collisions and various characteristics, namely; causes of crashes, road curve radius, vehicle type, pavement conditions and time of the crash. The severity of crashes is considered to be the systematic component of the nature of collisions in this study. Multinomial logit models are developed to understand the effect of these characteristics on the level of severity of the crash.
Statistical analysis and model interpretations conclude that the type of vehicle responsible for the crash plays an important role in determining the level of crash severity. This holds good for all the types of collisions considered in the study.
MNL model ser ves as an aid to the policymakers in framing norms to ensure that roads transform to safer spaces. Placement of warning signs, reflective mirrors and improved infrastructure design will improve safety for road users. The above model helps in predicting the level of severity of the crash based on the observed characteristics. This will pave way for timely interventions to save precious lives.
References
Abdel-Aty, M. 2003. Analysis of Driver Injury Severity Levels at Multiple Locations Using Ordered Probit Models, Journal of safety research 34(5): 597-603.
Dissanayake, S.; Lu, J. 2002. Analysis of Severity of Young Driver Crashes: Sequential Binary Logistic Regression Modelling, Transportation Research Record:
Journal of the Transportation Research Board (1784): 108-114.
Donnell, E.; Mason Jr. J. 2004. Predicting the Severity of Median-Related Crashes in Pennsylvania by Using Logistic Regression, Transportation Research Record:
Journal of the Transportation Research Board (1897): 55-63.
Geedipally, S.; Patil, S.; Lord, D., 2010. Examination of Methods to Estimate Crash Counts by Collision Type,
Transportation Research Record: Journal of the Transportation
Research Board (2165): 12-20.
Hosmer, D.W.; Lemeshow, S. 2000. Applied Logistic
Regression (2nd ed.).Wiley. New York. USA. 369 p.
Huang, H.; Chin, H.C.; Haque, M.M. 2008. Severity of Driver Injury and Vehicle Damage in Traffic Crashes at Intersections: A Bayesian Hierarchical Analysis, Accident
Analysis & Prevention 40(1): 45-54.
Khattak, A.; Kantor, P.; Council, F. 1998. Role of Adverse Weather in Key Crash Types on Limited-Access: Roadways Implications for Advanced Weather Systems,
Transportation Research Record: Journal of the Transportation
Research Board (1621): 10-19.
Kim, D.G.; Lee, Y.; Washington, S.; Choi, K. 2007. Modeling Crash Outcome Probabilities at Rural Intersections: Application of Hierarchical Binomial Logistic Models,
Accident Analysis & Prevention 39(1): 125-134.
Lord, D. 2006. Modelling Motor Vehicle Crashes Using Poisson-Gamma Models: Examining the Effects of Low Sample Mean Values and Small Sample Size on the Estimation of the Fixed Dispersion Parameter, Accident
Analysis & Prevention 38(4): 751-766.
De Luca, M. 2015. A Comparision between Prediction Power of Artificial Neural Networks and Multivariate Analysis in Road Safety Management, Transport 1-7. NCRB. 2014. National Crime Records Bureau ‘Crash Statistics on Indian National and State Highways, New Delhi. Available from internet: <http://ncrb.nic.in/ index.htm>.
Niveditha, V.; R amesh, A.; Kumar, M. 2015. Development of Models for Crash Prediction and Collision Estimation. A Case Study for Hyderabad city, International Journal of Transportation Engineering 3(2): 143-150.
Qin, X.; Ivan, J.N.; Ravishanker, N.; Liu, J.; Tepas, D. 2006. Bayesian Estimation of Hourly Exposure Functions by Crash Type and Time of Day, Accident
Analysis & Prevention 38(6): 1071-1080.
Quddus, M.A.; Wang, C.; Ison, S.G. 2009. Road Traffic Congestion and Crash Severity: Economic Analysis Using Ordered Response Models, Journal of Transportation
Engineering 136(5): 424-435.
Ramesh A.; Kumar M. 2011. Road Accident Models for Hyderabad Metropolitan City of India, Journal of Indian
Highways 39(7): 17-30.
Shankar, V.; Mannering, F.; Barfield, W. 1995. Effect of Roadway Geometrics and Environmental Factors on Rural Freeway Crash Frequencies, Accident Analysis
& Prevention 27(3): 371-389.