203
Volume LIX 24 Number 4, 2011
DEMOGRAPHIC DEVELOPMENT IN
SELECTED MICROREGIONS
M. Palát
Received: March 8, 2011
Abstract
PALÁT, M.: Demographic development in selected microregions. Acta univ. agric. et silvic. Mendel. Brun., 2011, LIX, No. 4, pp. 203–218
The paper is aimed at the population development analysis of the Běleč, Lučina, Cézava and Podluží regions. In the studied period an increase in the mid-year population occurred, the proportion of women was predominant. As for demographic indicators, following parameters were evaluated: the number of population, the structure of population according to sex and age, death rate, birth-rate, marriage rate, divorce rate and migration. To express the development prediction of these indicators methods of time series were used. The population is getting older due to the extending live expectancy and decreasing mortality rate. The demographic aging of the population brings about a number of economic and social impacts, which require treatment both on the all-society and regional level. population development, microregion, demography, demographic indicators
A voluntary association of villages is termed as a microregion. It originates on the basis of the initiation of particular villages, not on the ground of the decision of a governing body or by law. Villages involved in it strive together for economic, cultural and social development. The high rate of the interconnection of particular villages is necessary for the successful achievement of the development of all villages in the microregion. Particularly due to this integrity an integrated rural microregion diff ers from the simple association of villages. Main advantages of a microregion are as follows: the microregion can obtain money for the association development and also through the sharing of fi nancial as well as non-fi nancial sources of more villages; the microregion can also use fi nancial sources, which cannot be used by particular villages.
MATERIAL AND METHODS
The aim of the paper is to analyse the population development of the Běleč and Lučina microregions within the monitored period of 1991–2008, the Cézava microregion in 1990–2007 and the Podluží microregion in 1990–2007. During this period, demographic indicators such as birth rate, death
rate, marriage rate, divorce rate, abortion, total increase, natural increase and increase through migration were analysed.
Time series of demographic indicators were fi tted using suitable regression functions (Marková, Palát, 2009; Palát, 2008, 2009; Palát, Maca, 2004, 2005; Svatošová, 2009, 2010). Databases of the Czech Statistic Offi ce available on www.czso.cz were the source of data.
RESULTS AND DISCUSSION
Microregion Běleč
The Běleč microregion consists of following villages: Biřkov, Červené Poříčí, Chocomyšl, Chudenice, Dolany, Ježovy, Kaničky, Křenice, Mezihoří, Němčice, Poleň, Švihov, Úboč, Únějovice, Vřeskovice and Všepadly.
The highest fall in the number of inhabitants was noted in 1991. The number of inhabitants decreased by 86 persons, ie from 5 231 in 1990 to 5 145 in 1991. The most marked increase in the number of inhabitants occurred in 2007 when the number of inhabitants in the region increased by 111 per2sons. In microregion Běleč in 1991–2005, the proportion of females in population is evident (Fig. 2).The proportion of males in population decreased until 2000. On the contrary, it is possible to note the increasing proportion of males in the region population since 2001. The number of females in the population decreased yearly till 1999. For the rest of the monitored period, the number of females showed alternately an increasing and decreasing trend.
The number of males and females in the region was nearly balanced in the course of last three monitored years. In 2008, the number of men even exceeded the number of females in the region. Between 1991 and 2008, the proportion of women in the population decreased by 3.1%. The number of men in the population increased by 105 persons during the monitored period, ie an increase by 4.2%.
When comparing the age structure of the microregion inhabitants with the population of the Plzeň region (Tab. II) it is possible to note that the microregion population grows old faster than the region population. The proportion of persons in preproductive age in the total population of the Běleč microregion was higher at the end of the monitored period than in the region (14.8% in the microregion as against 13.8% in the region),
4850 4900 4950 5000 5050 5100 5150 5200
1991 1992 1993 1994 1995 1996 1997 1998 1999 2000 2001 2002 2003 2004 2005 2006 2007 2008
Populatio
n
Populationasof31/12ͲBĢleē
1: Development in the number of inhabitants as of 31 December in the Běleč microregion in 1991–2008 (data source: ČSÚ/Czech Statistical Office/, processed by the paper author)
2350 2400 2450 2500 2550 2600 2650 2700
1991 1992 1993 1994 1995 1996 1997 1998 1999 2000 2001 2002 2003 2004 2005 2006 2007 2008
Populatio
n
Populationasod31/12Ͳmales Populationasod31/12Ͳfemales
however, the proportion of seniors was markedly higher in the microregion (16.2 as against 15.2% in the region). On the other hand, the proportion of an active component in the total population was lower in the microregion than in the region. Between 1991 and 2008, the proportion of persons aged 15–64 years increased by 4.5% in the microregion and by 3.8% in the region.
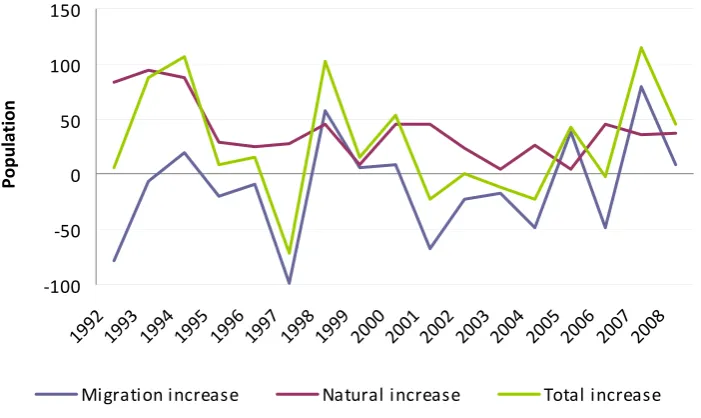
During the monitored period, the total increase of population in the microregion reached largely negative values the positive increase of inhabitants being noted in 2000–2002 and 2005–2008.
Migration showed considerable proportion in this development reaching positive values in the major part of the period. Only in 1992, 1993, 1997, 2001, 2002 and 2004, negative migration balances were obtained. On the contrary, at the natural increase of inhabitants, the number of died persons exceeded the number of born persons for most of the period (Fig. 3).
A view of the number of inhabitants in particular villages shows (Fig. 4) that the village of Švihov increased most (population increase by 6%). The village of Křenice noted the least favourable development. In the course of the monitored period, a fall by 50% occurred there as compared to the number of inhabitants in 1991.
The natural change of inhabitants is evaluated by means of the indicator of crude birth rates and death rates. The monitored microregion shows favourable birth rates. The number of live-born children per 1 000 inhabitants of the mid-year population reached the highest value in 2004 (12.5 live-born children/1 000 inhabitants of the mid-year population) and the lowest value in 1998 (5.74 live-born children/1 000 inhabitants of the mid-year population). Comparing the crude birth rate (hmp) of the Běleč microregion with region values it is possible to note that in 1997, 2000–2002 and 2004, the microregion values of crude birth rate (hmp) ranged above the region values. In other years, the microregion birth rate did not reach the region values being, therefore, substandard (Fig. 5). In the Plzeň region, the crude birth rate ranged on average about 9.7 live-born children per 1000 inhabitants of the mid-year population).
Mortality evaluated according to the number of died persons per 1 000 inhabitants of the mid-year population ranges above the Plzeň region mortality (Fig. 6). In the Běleč microregion, the fall of mortality occurred during the monitored period, which was demonstrated both by the decrease of died persons and the decline of the indicator of the crude death rate. In absolute numbers, the number of inhabitants who died in 2008, was lower by 24 as compared with 1991 (ie fall by 30%).
I: The structure of population according to selected age groups (data source: ČSÚ /Czech Statistical Offi ce/)
Age/Year 1991 1995 1999 2004 2008
Microregion Běleč
0–14 17.0 15.8 14.6 14.6 14.8
15–64 64.5 65.4 67.5 69.5 69.0
65 + 18.6 18.9 18.0 16.0 16.2
Region Plzeň
0–14 19.9 17.8 16.1 14.6 13.8
15–64 67.1 68.6 69.7 70.8 70.9
65 + 13.0 13.6 14.2 14.6 15.2
Ͳ80 Ͳ60 Ͳ40 Ͳ20 0 20 40 60 80 100 120
1992 1993 1994 1995 1996 1997 1998 1999 2000 2001 2002 2003 2004 2005 2006 2007 2008
Populatio
n
Migrationincrease Naturalincrease Totalincrease
Ͳ200
Ͳ150
Ͳ100
Ͳ50 0 50 100
Dolan
y
Chud
enice
Changeinpopulationasagainst1991
4: Changes in the number of inhabitants in particular villages of the Běleč microregion as against 1991 (data source: ČSÚ/Czech Statistical Office/, processed by the paper author)
5 6 7 8 9 10 11 12 13
1991 19921993 1994 1995 19961997 1998 1999 2000 2001 2002 2003 2004 20052006 2007 2008
‰
CrudebirthrateͲmicroregionBĢleē CrudebirthrateͲPlzeŸregion
5: Development of the crude birth rate in 1991–2008 (data source: ČSÚ/Czech Statistical Office/, processed by the paper author)
10 11 12 13 14 15 16 17
1991 199 2
1993 199 4
1995 199 6
1997 199 8
1999 20002001 20022003 20042005 20062007 2008
‰
CrudedeathrateͲmicroregionBĢleē
CrudedeathrateͲPlzeŸregion
The crude death rate noted a decline from 14.5 to 10.4 persons per 1 000 inhabitants of the mid-year population in the microregion. Similar development of the crude death rate (hmú) can be also noted in the Plzeň region where the hmú value decreased from 12.6 to 10.2‰.
The fi gure shows that with the exception of 1992, 1993, 1997, 2001 and 2004, values of the natural increase of population ranged below values of the population increase due to migration (Fig. 7). Thus, the total increase of inhabitants was largely aff ected by migration.
In the Běleč microregion, the predominance of emigrated over immigrated persons or vice versa is alternatively evident during the monitored period (Fig. 8). Generally, 2 181 inhabitants immigrated to the microregion and 2080 persons emigrated from the region in 1992–2008. Thus, a total migration gain amounted to 101 inhabitants.
In the course of the monitored period 1991–2008, the number of population increased by 24 persons in the Běleč microregion. Migration participated in
90% of the population increase. With the exception of 2004 and 2008, the natural increase of population reached negative values. In the Běleč microregion, the predominance of females in population is evident; however, their proportion in the total population slightly decreases. At the beginning of monitoring, the proportion of females in the region population amounted to 51.7% while in 2008, females participated “only” in 49.9 per cent.
Microregion Lučina
The Lučina microregion consists of following villages: Brod nad Tichou, Broumov, Ctiboř, Částkov, Dlouhý Újezd, Halže, Chodský Újezd, Kočov, Lesná, Lom u Tachova, Milíře, Obora, Studánka, Tachov, Tisová and Zadní Chodov.
Based on Fig. 9, it is evident that the number of population increased in the Lučina microregion from 1991 to 1996. In 1997, a slight decline was noted in the number of inhabitants. This fall was followed by the increase in the region population
Ͳ80
Ͳ40 0 40 80 120
1992 1993 1994 1995 1996 1997 1998 1999 2000 2001 2002 2003 2004 2005 2006 2007 2008
Populatio
n
Naturalincrease Migrationincrease
7: Comparison of the natural increase and increase by migration in the Běleč microregion in 1992–2008 (data source: ČSÚ/Czech Statistical Office/, processed by the paper author)
0 50 100 150 200 250
1992 1993 1994 1995 1996 1997 1998 1999 2000 2001 2002 2003 2004 2005 2006 2007 2008
Populatio
n
Immigrantstotal Emigrantstotal
until 2000. In 2001–2004, the number of inhabitants in the microregion slightly decreased. From 2005, the indicator of the population number showed an increasing trend. In the period 1991–2008, the number of population increased by 440 persons. In relative values, it refers to a 2.5% increase. The highest fall in the number of inhabitants was noted in 1997 when population decreased by 71 persons, ie from 18 099 in 1996 to 18 028 in 1997. The most marked increase in the number of inhabitants occurred in 2007 when the number of inhabitants in the region increased by 115 persons.
In the Lučina microregion, there is the predominant proportion of males in population. It is possible to note the increasing proportion of females in the region population throughout the monitored period (Fig. 10). From 1992 to 1994, the
proportion of males population slightly increased. For the rest of the period, the number of males in the population showed increasing and decreasing trends. Between 1991 and 2008, the proportion of females in the population increased by 4.3%. The number of men in the population decreased by 0.6% during the monitored period.
When comparing the age structure of the Lučina microregion population with the Plzeň region population (Tab. II), it is possible to note that the region population grows old faster than the microregion population. The proportion of persons in preproductive age in the total Lučina microregion population was higher than in the region at the end of the monitored period (14.9 as against 13.8%), but the proportion of seniors was markedly higher in the region (15.2 in the region as against 11.9% in the 17800
17900 18000 18100 18200 18300 18400
1991 1992 1993 1994 1995 1996 1997 1998 1999 2000 2001 2002 2003 2004 2005 2006 2007 2008
Populatio
n
Populationasof31/12ͲLuēina
9: Development in the number of inhabitants as of 31 December in the Lučina microregion in 1991–2008 (data source: ČSÚ/Czech Statistical Office/, processed by the paper author)
8850 8900 8950 9000 9050 9100 9150 9200 9250 9300
1991 1992 1993 1994 1995 1996 1997 1998 1999 2000 2001 2002 2003 2004 2005 2006 2007 2008
Populatio
n
Populationasod31/12Ͳmales Populationasod31/12Ͳfemales
microregion). On the other hand, the proportion of an active component in the total population was higher in the microregion than in the region. Between 1991 and 2008, the proportion of persons aged 15–64 years both in the microregion and region increased by 3.8%.
During the monitored period, the total increase of population of the Lučina microregion reached largely positive values, negative increase of population being noted in 1997, 2001, 2003, 2004 and 2006. Natural increase of population showed considerable proportion in this development. The increase reached positive values throughout the monitored period and the number of life-born children exceeded the number of died persons. On the other hand, as for an increase by migration, negative migration balance was reached nearly throughout the monitored period (Fig. 11). A view of the development of population in particular villages shows that the village of Lom near Tachov increased most, namely by 39%. The village of Tachov noted the least favourable development. During the monitored period, the number of inhabitants
decreased by 2.6 per cent as against the population in 1991 (Fig. 12).
The monitored region shows favourable birth rates, the number of life-born children per 1 000 inhabitants of the mid-year population reached the highest value at the beginning of the monitored period, ie in 1991 (11.9 life-born children/1 000 inhabitants of the mid-year population) and the lowest value in 1999 (8.1 life-born children /1 000 inhabitants of the mid-year population).
When comparing the crude birth rate in the Lučina microregion with region values, it is possible to note that in 1999, 2005 and 2007, microregional values of hmp (crude birth rate) ranged below regional values, in other years, the microregional values exceeded regional values being, therefore, above-average (Fig. 13). In the Plzeň region, hmp values ranged about 9.7 life-born children/1 000 inhabitants of the mid-year population.
Mortality evaluated according to the number of died persons ranges below the Plzeň region mortality (Fig. 14). In the Lučina microregion, the increase of mortality occurred demonstrated both by the number of died persons and an increase in the number of values of the crude rate of mortality.
In absolute values, 27 more persons died in 2008 compared with 1991, ie an increase by 17.6%. The crude rate of mortality noted an increase from 8.6 to 9.8‰ died persons per 1000 inhabitants of the mid-year population. The opposite development of the crude rate mortality indicator can be noted also in the Plzeň region where the value decreased from 12.6 to 10.2‰.
Fig. 15 shows that with the exception of 1998, 2005 and 2007, values of the natural increase of population ranged above values of the increase of population due to migration. Thus, the total II: The structure of population according to selected age groups (data
source: ČSÚ/Czech Statistical Offi ce/)
Age/Year 1991 1995 1999 2004 2008
Region Lučina
0–14 22.8 20.7 18.2 16.2 14.9
15–64 69.5 70.8 72.1 73.1 73.3
65 + 7.8 8.5 9.7 10.6 11.9
Region Plzeň
0–14 19.9 17.8 16.1 14.6 13.8
15–64 67.1 68.6 69.7 70.8 70.9
65 + 13.0 13.6 14.2 14.6 15.2
Ͳ100 Ͳ50 0 50 100 150
1992 1993 1994 1995 1996 1997 1998 1999 2000 2001 2002 2003 2004 2005 2006 2007 2008
Populatio
n
Migrationincrease Naturalincrease Totalincrease
Ͳ350
Ͳ300
Ͳ250
Ͳ200
Ͳ150
Ͳ100
Ͳ50 0 50 100 150
Brod
nad
Ticho
u
Broumo
v
Lom
uTac
hova Obora
Tacho
v
Changeinpopulationasagainst1991
12: Changes in the number of inhabitants in particular villages of the Lučina microregion as against 1991 (data source: ČSÚ/Czech Statistical Office/, processed by the paper author)
8 9 10 11 12 13 14 15
199 1
199 2
199 3
199 4
199 5
199 6
199 7
199 8
1999 2000 200 1
2002 200 3
2004 200 5
2006 200 7
2008
‰
CrudebirthrateͲmicroregionLuēina CrudebirthrateͲPlzeŸregion
13: Development of the crude birth rate in 1991–2008 (data source: ČSÚ/Czech Statistical Office/, processed by the paper author)
7 8 9 10 11 12 13
199119921993199419951996199719981999200020012002200320042005200620072008
‰
CrudedeathrateͲmicroregionLuēina
CrudedeathrateͲPlzeŸregion
increase of population was mostly aff ected by an increase resulting from birth rate.
In the Lučina microregion, the predominance of emigrated over immigrated persons and vice versa is evident in the course of the monitored period (Fig. 16). Generally, in 1992–2008, 8 419 inhabitants immigrated and 8 616 persons emigrated from the microregion. The total migration loss amounted to 197 inhabitants.
Microregion Cézava
The Cézava microregion is situated on the area of three districts, namely Brno-venkov, Břeclav and Vyškov being, thus, created by villages Blučina, Kobylnice, Měnín, Moutnice, Nesvačilka, Nikolčice, Otmarov, Otnice, Rajhradice, Sokolnice, Telnice, Těšany, Újezd u Brna, Žatčany and the town of Židlochovice.
According to the last population census (1/3/2001), the Cézava microregion showed 20.2 thousand resident inhabitants, which represented about 13% proportion in the Brno-venkov district population.
The area of the monitored region (156.6 km²) creates 14% area of the whole Brno-venkov district. The population density is rather high (129 inhabitants per 1 km2) being a little lower compared
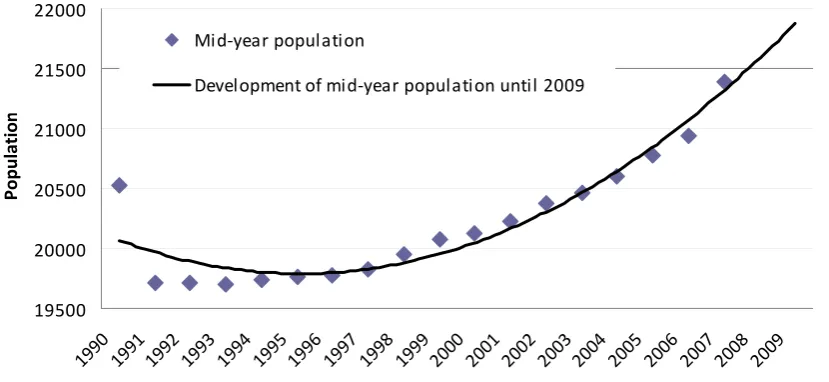
with the district density. However, it is quite comparable with the whole Czech Republic average (130 inhabitants per 1 km²). As of 31/12/2007, 21 721 inhabitants lived in the region, out of the total number 10 688 males and 11 033 females. Generally, the number of inhabitants increased by 897 persons from 1990 to 2007. During the monitored period 1990–2007, the number of inhabitants always increased. An increase by 897 mid-year population occurred (from the original population 20 524 in 1990 to 21 421 in 2007). The highest increase by 422 inhabitants occurred in 2007. Fig. 17 shows an evident increasing trend of the mid-year population development in the Cézava microregion.
The time series of the mid-year population development was compared by the second-degree polynomial (y’ = 10.924x2 − 131.59x + 20 187).
The mid-year population prediction for 2009 is 21 925 inhabitants. Based on the analysis of the Ͳ120
Ͳ70 Ͳ20 30 80 130
1992 1993 1994 1995 1996 1997 1998 1999 2000 2001 2002 2003 2004 2005 2006 2007 2008
Populatio
n
Naturalincrease Migrationincrease
15: Comparison of the natural increase and increase by migration in the Lučina microregion in 1992–2008 (data source: ČSÚ/Czech Statistical Office/, processed by the paper author)
development of values of the index of ageing we can come to a conclusion on the population ageing in the monitored microregion. The proportion of women in the population predominates. There are more boys than girls at an age of 0–14 years and the same applies to a group of 15–64 years. At an age of ≥ 65 years, females markedly predominate. It is caused by the higher mortality of males.
Fig. 18 shows that the population structure in the Cézava microregion can be specifi ed as regressive, ie the children generation does not reach the post-reproduction generation proportion and a diff erence between these generations steadily increases.
The development of birth rate showed a decreasing trend in the Cézava microregion from 1990 until 1996. A er 1997, the number of life-born children fl uctuated and then a decline occurred again. Since 2003, the birth rate trend development is only increasing. Age-groups of the 70s, which delayed the establishment of a family to a later date, begin to reproduce. The crude rate of mortality fl uctuates from 14.86‰ in 1990 to 9.07‰ in 1999. At the end of the monitored period in 2007, the crude rate of mortality reached a value of 11.06 ‰. This decreasing trend results from the higher expectation of survival. A clearly decreasing trend can be also found at the development of abortion. In 1992, a value of the crude rate of abortion was 7.36‰ while in 2007, it reached only 2.05‰. The number of abortions decreased to 30% of the year 1992.
Although the marriage rate slightly increased in the monitored microregion from 2003, in general, the decreasing trend of development could be noted from 1991. The lowest number of marriages (74) occurred in 2001. The crude rate of marriage in this year was 3.65 marriages per 1 000 inhabitants. This
increasing trend is associated with the development of the divorce rate. The lowest values were reached in 1992 (28 divorces) and the highest values in 2006 (69 divorces). The all-republic trend in the birth-rate decline in the 90s became also evident in the Cézava microregion. With the exception of 1991 and 1998, the natural increase of population ranges in negative values since 1996. An opposite development was noted at the statistics of immigrated and emigrated persons where it was possible to fi nd constantly positive migration balance for the monitored period. The time series of values of the total population increase (Fig. 19) was fi tted with the polynomial of the second degree (y’= 1.6109 x2 − 8.9288 x +
5.0196). Similarly, the time series of values of the natural increase of population (y’= 0.5737 x2 −
11.634 x + 7.201) and the time series of values of the population increase by migration (y’= 1.0373 x2 + 2.7055 x − 2.1814). The highest increase of
population by migration occurred in 2007, namely by 610 inhabitants. For the future, it is possible to expect that this trend of development will continue.
Villages of the Cézava microregion enlarge, satellite small towns or housing construction originate there. With respect to the vicinity of Brno, it is an attractive locality for inhabitants of the city searching for new possibilities of living.
In the monitored period 1990–2007, an increase in the mid-year population occurred in the Cézava microregion. The proportion of women predominated. The balance of migration is positive. The life expectancy at birth and the population ageing increase. The abortion, death rate and marriage rate show a decreasing trend, however, the divorce rate increases. In recent years, the birth rate also increases.
19500 20000 20500 21000 21500 22000
1990 19911992 1993 1994 19951996 1997 1998 19992000 2001 2002 20032004 2005 2006 2007 2008 2009
Populatio
n
MidͲyearpopulation
DevelopmentofmidͲyearpopulationuntil2009
Microregion Podluží
The Podluží microregion consists of following villages: Dolní Bojanovice, Hrušky, Josefov, Kostice, Ladná, Lanžhot, Lužice, Moravská Nová Ves, Moravský Žižkov, Nový Poddvorov, Prušánky, Starý Poddvorov, Tvrdonice and Týnec.
In the Podluží microregion, an increase in the mid-year population by 1.2% occurred in the period 1994–2007. The prediction of future development expects an increase in the mid-year population (Tab. III, Fig. 20).
0 2000 4000 6000 8000 10000 12000
1991 1992 1993 1994 1995 1996 1997 1998 1999 2000 2001 2002 2003 2004 2005 2006 2007
Population
of
age
generatio
n
Childrengeneration(0Ͳ14) Reproductiongeneration(15Ͳ49) PostͲreproductiongeneration(50+) 5800
18: The proportion of children, reproduction and post-reproduction generations in the Cézava microregion (data source: ČSÚ/Czech Statistical Office/, processed by the paper author)
Ͳ200 Ͳ100 0 100 200 300 400 500 600
199 0
199 1
199 2
199 3
199 4
199 5
199 6
199 7
199 8
199 9
2000 2001 2002 2003 2004 2005 2006 2007 2008 2009
Populatio
n
TotalincreaseͲCézava
Developmentoftotalpopulationincreaseuntil2009
19: Development of the total increase of inhabitants in the Cézava microregion (data source: ČSÚ/Czech Statistical Office/, processed by the paper author)
III: The mid-year population of the Podluží microregion and South-Moravian Region (data source: ČSÚ/Czech Statistical Offi ce)
Year 1994 1996 1998 2000 2002 2004 2006 2007 2007/1994 (%)
Microregion Podluží
total 23 048 23 136 23 189 23 311 23 217 23 226 23 227 23 324 101,20
males 11 151 11 212 11 265 11 378 11 356 11 358 11 383 11 426 102,47
females 11 897 11 924 11 924 11 934 11 862 11 869 11 845 11 898 100,00
South-Moravian Region
total 1 148 892 1 147 700 1 145 604 1 143 491 1 130 181 1 129 912 1 131 461 1 136 549 98,93
males 555 664 555 492 554 901 554 338 547 691 548 155 549 601 552 870 99,50
The time series of the mid-year population development was fi tted with the third-degree polynomial (y’ = 0.502 x2 − 13.24 x + 22 923).
A prediction of the mid-year population is 23 398 inhabitants for 2009.
Particularly migration aff ects the population increase. There is the predominance of women in the population; however, their proportion slightly decreases (Fig. 21). It is demonstrated by the index of feminity, which fi rst reached a value of 1 066 in the region and then gradually decreased down to 1 041, ie, 1 000 males correspond to 1 041 females. The fall of the indicator is expected also in the future. The proportion of males and females changes with increasing age in favour of females. At the age category of 0–14 years, males predominate, at an age of 15–64 years; the proportion of males and females is nearly balanced. However, at the age category of ≥ 65 years, females markedly predominate. This development can be explained by a fact that more boys are born in the long term and, on the other hand, females reach higher age. Similarly as in the South-Moravian Region also in
the Podluží microregion, we can meet the problem of population ageing. It is also demonstrated by the index of ageing, which showed an increasing trend for the whole period (Fig. 22).
The time series of the index of ageing of the Podluží microregion was fi tted using a line (y’ = 1.643 x + 74.17). The time series of the ageing index development of the South-Moravian region was fi tted also by a line (y’ = 2.712 x + 70.22). The prediction of the mid-year population for 2009 is 100.5 for the Podluží microregion and 113.6 for the South-Moravian region. Thus, the Podluží microregion increased from a value of 76 up to a value of 100. Also in the future, it is possible to expect the growth of values of this indicator. The problem of population ageing is related to a number of measures, which have to be carried out in order to precede many negative impacts (eg, the old-age pension system and the fi eld of health service). At the regional level, it is necessary to select the suitable capacity of public domiciliary services and health and educational institutions.
23000 23100 23200 23300 23400
1994 1995 1996 1997 1998 1999 2000 2001 2002 2003 2004 2005 2006 2007 2008 2009
Populatio
n
MidͲyearpopulation
DevelopmentofmidͲyearpopulationuntil2009
20: Prediction of the mid-year population development in the Podluží microregion (data source: ČSÚ/ Czech Statistical Office/, processed by the paper author)
11000 11200 11400 11600 11800 12000
1994 1995 1996 1997 1998 1999 2000 2001 2002 2003 2004 2005 2006 2007
Populatio
n
The marked decrease of mortality is a favourable phenomenon. It is demonstrated both by the decline in the number of died persons and the fall of the indicator of the crude rate of mortality, which decreased from the original value of 12.67 to fi nal 10.12‰ in the Podluží microregion. The reason of death consists most frequently in diseases of the circulatory system. These diseases aff ect more than 50% of the total number of died. Tumor diseases cause roughly a quarter of all deaths. The fall of the death rate is caused particularly by the systematic development of medicine, availability and quality of medical care, attitude to health and using preventive measures.
The development of birth rate in the fi rst half of the monitored period can be characterized by a decreasing trend, however, in the second half of the period, the gradual increase in the number of childbirths occurs and thus, the growth of the indicator of the crude birth-rate. Until 2009, the value of this indicator should increase in both monitored regions. The growth of birth rate in recent years is caused by the occurrence of mothers coming from heavy population age-groups of the 70s. In consequence of the marriage delay trend to
later age the age of mothers (primaparas) increases. Fast increase in the number of children born out of marriage also occurs. Rapid decline of the number of abortion in the Podluží microregion is also a positive report. The decline decreased by 55.4% in the Podluží microregion and by 35.3% in the South-Moravian region. This favourable development is also demonstrated by decreasing values of the crude rate of abortion, which can be explained by the high degree of religiosity in the region (Fig. 23).
The time series of development of the crude rate of abortion was fi tted by the second-degree polynomial (y’ = 0.014 x2 − 0.410 x + 5.624). The prediction of the
crude rate of abortion is 2.65 for 2009, which means 2.65 abortions per 1 000 inhabitants of the mid-year population. Reasons resulting in the decline of the number of abortions consist particularly in the total population climate associated with the considerable expansion of modern contraceptive devices.
The marriage rate noted a slight decrease in the Podluží microregion in the course of the monitored period. Reasons of the marriage rate decline are related to total changes in the life style of a young generation a er 1989. People prefer o en individual interest and priorities such as to obtain education,
70 80 90 100 110 120
1994 1995 1996 1997 1998 1999 2000 2001 2002 2003 2004 2005 2006 2007 2008 2009
Populatio
n
IndexodageingͲPodluží
IndexodageingͲSouthͲMoravianregion
22: Development of the index of ageing in the Podluží microregion and in the South-Moravian region (data source: ČSÚ/Czech Statistical Office/, processed by the paper author)
study or work abroad, better working possibilities and making a career. They delay the beginning of a family life to a later date a er achieving a certain economic level and solving (at lest partly) the question of housing. The phenomenon of present time consists in consensual unions, which do not markedly diff er from offi cial unions both from the aspect of stability and the number of children.
The divorce rate in the Podluží microregion fl uctuates in particular years but, from the long-term aspect, it is possible to note that it decreases. On the contrary, in the South-Moravian region, the divorce rate increases. The crude rate of divorce in the microregion reached lower values than in the whole South-Moravian region. Reasons can consist in the higher accent on family, marked eff ects of religion and traditions in the Podluží microregion.
Development of the total population increase can be specifi ed as favourable. In the Podluží, it reached positive values for most of years. Migration showed the highest eff ect on this positive development because it acquired exclusively positive values throughout the period (Fig. 24). On the other hand,
at natural increase, the number of died exceeded the number of born throughout the period.
The time series of the total increase was fi tted by the third-degree polynomial (y’ = 0.566 x3 − 11.37 x2
+ 59.51 x − 34.52) as well as fi tting the time series of the natural increase development (y’ = −0.116 x3 +
3.483 x2 − 27.11x − 10.75) and the time series of the
migration increase (y’ = 0.683 x3 − 14.87 x2 + 86.62
x − 23.76). According to the short-term prediction of further development until 2009, an increase in the total population is expected to 325 inhabitants, migration balance being 353 and natural loss 28. Further increase in the total number of inhabitants is expected. Also in the future, migration should be the most marked component of this indicator (Fig. 25).
The time series of the total increase was fi tted by the third-degree polynomial (y’ = 0.566 x3 − 11.37 x2
+ 59.51 x − 34.52) as well as fi tting the time series of the natural increase development (y’ = −0.116 x3 +
3.483 x2 − 27.11x − 10.75) and the time series of the
migration increase (y’ = 0.683 x3 − 14.87 x2 + 86.62
x − 23.76). According to the short-term prediction of further development until 2009, an increase in Ͳ150
Ͳ100 Ͳ50 0 50 100 150 200 250 300
1994 1995 1996 1997 1998 1999 2000 2001 2002 2003 2004 2005 2006 2007 2008 2009
Populatio
n
Migrationincrease Naturalincrease Totalincrease
24: Development of the total, natural and migration increase of inhabitants in the Podluží microregion (data source: ČSÚ/Czech Statistical Office/, processed by the paper author)
the total population is expected to 325 inhabitants, migration balance being 353 and natural loss 28. Further increase in the total number of inhabitants is expected. Also in the future, migration should be the most marked component of this indicator (Fig. 25).
A reason of the higher infl ow of inhabitants to the Podluží microregion consists in a present trend when people migrate from large cities to towns and villages. Smaller seats, which, however, correspond to a town by their infrastructure and which are moreover connected with a city by easy and available
public transport, become most attractive. Just the Podluží microregion meets these conditions. The technical infrastructure of the whole region is at a good level. As for the transport availability, this microregion shows a very good connection to a freeway going to Prague, Vienna or Bratislava. An international rail junction in Břeclav is of fundamental importance for transport functions and services. Thus, good position and a very good transport availability of the microregion can facilitate higher business activities and the creation of job opportunities.
SUMMARY
The aim of the paper was to assess disparities in the development of demographic characteristics of selected microregions. Following demographic indicators were assessed: death rate, birth rate, marriage rate, divorce rate and migration. To express prediction of the development of indicators mentioned above methods of time series were used. Owing to the increasing life expectancy and the decline of mortality population ageing occurs.
In the Běleč microregion, an increase in the mid-year population occurred in the monitored period 1991–2008. The proportion of women was predominant. During the period, the level of death rate occurred whereas the level of birth rate increased as well as the total number of inhabitants. The Běleč microregion population grows old, which corresponds to trends noted both in the Plzeň region and in the Czech Republic.
In the Lučina microregion, the proportion of men in population was prevailing during 1991–1995. Within the whole period of monitoring in 1991–2008, it was, however, possible to note the increasing proportion of women in the region population. The natural increase of population reached positive values for the whole period and the number of born children exceeded the number of died persons. On the contrary, an increase by migration reached negative migration balance nearly throughout the monitored period. Mortality evaluated according to the number of died persons per 1000 inhabitants of the mid-year population ranges below the death rate of the Plzeň region. In the Lučina microregion, an increase in the death rate occurred during the monitored period.
In the Cézava microregion, an increase in the mid-year population occurred in the period 1990–2007 the proportion of women being dominant. The balance of migration is positive. The life expectancy increases and the population get older. Abortion, death rate and marriage rate are of a decreasing trend. However, divorce rate increases. In recent years, the birth rate increases.
In the Podluží microregion, an increase in the mid-year population occurred during the monitored period 1994–2007 the proportion of women being dominant. The balance of migration is positive. The life expectancy increases and the population get old. Abortion, death rate and marriage rate show a decreasing trend. In recent years, the growth of birth rate appears. The demographic development of the Podluží microregion corresponds to the demographic development of the South-Moravian region in the same time period. A diff erent development was noted only in the divorce rate.
The demographic aging of the population brings about a number of economic and social impacts, which require treatment both on the all-society and regional level. The population ageing should be compensated for by a number of measures, which should minimize negative impacts of this phenomenon. For example, at a regional level, the capacity of public domiciliary services and health and educational institutions should be suitably selected.
Acknowledgement
REFERENCES
MARKOVÁ, A., PALÁT, M., 2009: Analýza popu-lačního vývoje mikroregionu Běleč. [CD-ROM]. In: Sborník příspěvků z odborného semináře Možnosti řešení disparit v regionu Podluží. 61–69. ISBN 978-80-7375-367-2.
PALÁT, M., 2008: Analýza disparit indikátorů pohybu obyvatelstva mezi kraji České republiky. In: Mezinárodní vědecký seminář Kvantitativní metody v ekonomii, metodologické a praktické aspekty výzkumu. České Budějovice, 91–96.
PALÁT, M., 2008: Analýza střední délky života mužů a žen ve vybraných regionech ČR. In: Firma a konkurenční prostředí 2008 – 1. část. Brno: MSD, spol. s r. o., 2008, s. 329–334. ISBN 978-80-7392-020-3.
PALÁT, M., 2009: Populační vývoj v okrese Blansko v kontextu Jihomoravského kraje. In: Firma a konkurenční prostředí. – 3. část. Brno: MSD, spol. s r. o., 154–161. ISBN 978-80-7392-086-9.
PALÁT, M., MACA, E., 2004: Analysis of the development and prediction of the population movement indicators in the Czech Republic. Acta Universitatis Agriculturae et Silviculturae Mendelianae Brunensis. 52: 3, 17–34. ISSN 1211-8516.
SVATOŠOVÁ, L., 2009: Diff erentiation of demo-graphic development in CR regions. Acta univ. agric. et silvic. Mendel. Brun. LVII, 6: 261–266.
SVATOŠOVÁ, L., 2010: Comparison of demographic development in the CR and the EU countries. Agric. Econ. – Czech, 56, 4: 176–182.
http://www.czso.cz.
Address