OTOLITH FUNCTION IN HUMAN SUBJECTS:
PERCEPTION OF MOTION, REFLEX EYE MOVEMENTS AND
VISION DURING LINEAR INTERAURAL ACCELERATION
by Claire Cécile GIANNA
MRC, Human Movement and Balance Unit,
National Hospital for Neurology and Neurosurgery
Queen Square, London
Thesis submitted for the degree o f PhD,
in the Faculty o f Science o f the University o f London.
ProQuest Number: U108141
All rights reserved
INFORMATION TO ALL USERS
The quality of this reproduction is dependent upon the quality of the copy submitted.
In the unlikely event that the author did not send a complete manuscript and there are missing pages, these will be noted. Also, if material had to be removed,
a note will indicate the deletion.
uest.
ProQuest U108141
Published by ProQuest LLC(2016). Copyright of the Dissertation is held by the Author.
All rights reserved.
This work is protected against unauthorized copying under Title 17, United States Code. Microform Edition © ProQuest LLC.
ProQuest LLC
789 East Eisenhower Parkway P.O. Box 1346
ABSTRACT
The thesis investigates how the otolith organs of the vestibular system, specifically the utricles, assist motion perception and aid visual stabilization, during translational lateral whole-
body acceleration.
It was found that high gradients of acceleration facilitate the detection of motion and that, for low acceleration gradients, motion perception in normal subjects relies on a ‘velocity’ threshold detection process. Experiments in patients without vestibular function indicated that, for the stimuli employed, the somatosensory system could be as sensitive to linear motion as the vestibular system.
The interaction between the horizontal linear vestibulo-ocular reflex (LVOR) and visual
context was characterized in the following experiments.
Subjects were accelerated transiently in darioiess, or while viewing earth-fixed or head-fixed targets. From onset, the eye velocity response to head translation was enhanced with acceleration level and target proximity, but was only slightly reduced by fixation of head-fixed targets. This suggested that the gain of the LVOR pathway was adjusted before or immediately after motion onset by a parameter depending mainly on viewing distance and less on the knowledge of probable relative target motion. For high relative target velocities, LVORs improved ocular fixation over what would be attained by pursuit alone, although fully compensatory eye movements were not
always produced.
The LVORs of patients who underwent unilateral vestibular deafferentation suggested that the utricular area generating transaural LVORs is the macular region lateral to the striola.
Psychophysical ejq)eriments based on a reading task established the functional role of the LVOR for stabilising vision during high-frequency sinusoidal whole-body acceleration. Unlike normal subjects, visual acuity in patients without vestibular function was not better during self- motion than during display oscillation.
ACKNOWLEDGMENTS
I am a part o f all that I have met. Alfred Tennyson (Ulysses)
A friend told me once that life is like a game of poker, where each of us is dealt a certain number of cards and told to play the game. Sometimes, you exchange a card for another one and try to play better, more satisfactorily or just differently. Some of the players you meet along the way, you will never forget: because they helped you to become what you are today, because they cared for you. The five years I spent at the Medical Research Council have constituted a fruitful, stimulating and a most pleasant period of my life. My first acknowledgments will therefore go to Michael Gresty and Adolfo Bronstein for putting their trust in me and accepting me among their staff. So doing, they provided me with the wonderful opportunity to meet many interesting people from around the world, physicians, non-clinical scientists and engineers. Before presenting more specific acknowledgments, which are bound to be incomplete, I would like to e>qjress my sincere gratitude to all those colleagues who introduced me to their projects, showed interest in my studies and created such a nice environment to work in.
This last sentence holds true for my supervisor Michael Gresty who, from my first days in his laboratory, has shown a huge dedication to my work which has never faded away. He has provided invaluable advice, help, motivation and guidance for my projects, from experimental design to the writing of all the papers presented at the end of this thesis. I also wish to acknowledge my ‘unofficial’ supervisor, Adolfo Bronstein for his constant support, constructive comments and skepticism which eventually improved the quality of my work, and for his concern and understanding expressed during many most enjoyable conversations. Michael and Adolfo suggested the concept of four out of the five experiments reported in this thesis and therefore even if they had not been such nice supervisors, I would still be immensely grateful to them for allowing me to work on these projects! In this paragraph concerning my ‘Doktor Vâter’, I would like to include Thomas Lempert, a German neurologist and co-author of five p ^ e rs, for sharing his enthusiasm in our findings and for his readiness to answer my questions about physiology in general and about the directional polarization of the utricle in particular. (Yes Adolfo, I did learn something about the brain after all...).
Among the technical, scientific and administrative staff, I am particularly indebted to Mary Faldon, Clive Wolsley, Bill Cameron, David Buckwell, Michael Marriott, Peter Burchill, Karen Brooks and Janet Mills. They provided support to carry out the different research projects but above all made me feel welcome in the laboratory. Their patience, tolerance for my imperfect command of the English language and role in improving my knowledge of the British culture were greatly appreciated.
Josq)hine Shallo-Hoffmann for the everyday attention she provided me with: ^All who jo y would win must share it,— happiness was bom a twin. Lord Byron (Don Juan).
Contents
TABLE OF CONTENTS
Title-page 1
Abstract 2
Acknowledgments 3
Table of contents 5
List of tables 10
List of figures 12
Abbreviations 15
Chapter One: General introduction
A. The vestibular system 16
B. Earlier major findings on the vestibular system 17
C. Aims of the thesis 19
Chapter Two: Materials and methods common to several experiments described in
this thesis
A. Linear acceleratory device 22
B. Eye movement recording techniques 24
1. Electro-oculography 24
2. Scleral search-coils 24
3. Infra-red comeal reflection detectors 25
C. Subject-Target configurations for eye movement studies 26
1. Experiments in the light 27
(a). VIS-VOR condition 27
(b). FIX-VOR condition 27
(c). VIS condition 28
2. Experiments in the dark 28
(a). PASSIVE GAZE condition 29
(b). IMAGINARY TARGET condition 29
3. Determination of relative target motion 29
D. Analysis of eye movement recordings 30
1. Desaccading 30
2. Averaging 30
3. Curve fitting 31
Contents
Chapter Three: Perception of motion direction during passive lateral whole-body
translation
A. Abstract 32
B. Introduction 33
C. Materials and methods 34
1. Apparatus 34
2. Experiment 1: acceleration steps 35
(a). Stimuli 35
(b). Threshold determination 35
3. Ejqjeriment 2; linear and parabolic accelerations 37
(a). Stimuli 37
(b). Threshold determination 39
4. Subjects and instructions 39
(a). For acceleration steps 39
(b). For linear and parabolic accelerations 40
D. Results 40
1. Acceleration thresholds 41
(a). For acceleration steps 41
(b). For linear and parabolic accelerations 42
2. Velocity thresholds 44
(a). For acceleration steps 44
(b). For linear and parabolic accelerations 44
3. Intra-subject variability in the detection of motion for identical stimuli 44
4. Did the motion stimuli evoke eye movement reflexes? 45
E. Discussion 45
1. Thresholds for motion perception; comparison with the literature 45
(a). Acceleration thresholds 45
(b). Velocity thresholds 47
(c). Effect of initial acceleration gradients 47
(d). Parameters influencing motion perception 48
(e). Variability between studies, between subjects, and within subjects 48 (f). Perception of tilt during translational acceleration 49 2. Can motion perception be attributed to utricular stimulation? 49
3. Conclusion 51
Chapter Four: Reflex eye movements evoked by transient lateral acceleration: visual
enhancement and suppression
A. Abstract 52
Contents
C. Materials and methods 55
1. Summary table of the various experiments 55
2. Experiments with search-coil recordings 56
(a). Stimuli 56
(b). Visual target 56
(c). Subjects 57
(d). Bye movement analysis 57
3. Experiments with BOG recordings 59
(a). Stimuli 59
(b). Visual target 60
(c). Subjects 60
(d). Eye movement analysis 60
D. Results 61
1. Horizontal eye movements 61
(a). Qualitative analysis 61
(b). Latencies of the slow-phases 64
(c). Latencies of the first quick-phases 65
(d). Ocular responses evoked within 100 ms of motion onset 66 (e). Ocular responses evoked from 100 ms after motion onset 70
2. Vertical eye movements 75
3. Torsional eye movements 76
(a). Slow-phase responses preceding the first quick-phases 76
(b). Quick-phases 78
E. Discussion 78
1. Horizontal eye movements 78
(a). Ocular responses evoked within 100 ms of motion onset 78 (b). Ocular responses evoked from 100 ms after motion onset 78
2. Torsional eye movements 80
3. Conclusion 82
83
Chapter Five: Translational vestibulo-ocular reflex after unilateral vestibular
deafferentation
A. Abstract 84
B. Introduction 84
C. Materials and methods 86
D. Results 87
1. Summary of the measurements obtained in normal subjects and patients 87
2. Velocities and asymmetries of the LVOR in patients 89
Contents
(b). One week after surgery 89
(c). Six to ten weeks after surgery 90
E. Discussion 91
1. Is the LVOR asymmetry a canalicular effect? 91
2. The LVOR after unilateral vestibular deafferentation 91
3. Functional organisation of the LVOR 92
4. Compensation of the LVOR 93
5. Conclusion 94
Chapter Six: Psychophysics of the utricular control of visual stabilisation
A. Abstract 95
B. Introduction 96
C. Materials and methods 97
1. Patients’ clinical data 97
2. Eye movement recordings 98
3. Measurements of dynamic visual acuity 99
4. Statistical analysis 100
D. Results 101
1. Translational vestibulo-ocular reflexes 101
2. Dynamic visual acuities 103
3. Oscillopsia ratings 108
E. Discussion 108
1. Otolith ftmction assessed with eye movement recordings 108
2. Dynamic visual acuity in normal subjects 109
3. Diagnosis of otolith dysfunction using dynamic visual acuity tests 110 4. Oscillopsia in patients with deficient vestibular ftmction 111
5. Conclusion 111
F. Appendices 112
1. Results obtained in normal subjects and patients for the dynamic visual acuity test 112 2. Justification for approximating the exact relative target velocity 116
Chapter Seven: Interaction between linear and angular vestibulo-ocular reflexes
during transient motion
A. Abstract 117
B. Introduction 118
C. Materials and methods 119
1. Stimuli 119
2. Visual targets 120
Contents
4. Relative target displacements 120
5. Eye movement analysis 121
D. Results 122
1. Ocular responses in the dark 123
2. Ocular responses in the light 125
E. Discussion 127
1. Gains of the vestibulo-ocular reflexes 127
2. Stimulation of the utricles during eccentric rotation by interaural acceleration 127 3. Eye movements during eccentric rotation: combination of linear and angular 128 vestibulo-ocular reflexes or enhanced angular VOR by stimulation of the utricles?
4. Conclusion 129
Chapter Eight: General conclusion 130
References 133
Appendices
A. Declaratory note 143
Tables
LIST OF TABLES
Chapter Two: M aterials and methods common to several experiments described in this thesis
Table 2-1: Configurations between subject and target used in eye movement studies. 26
Chapter Three: Perception of motion direction during passive lateral whole-body translation
Table 3-1: Summary of the patients’ clinical data. 40
Table 3-2: Acceleration thresholds, proportions of correct responses indicated at deceleration onset 43 (Analysis 1) or proportions of correct initial responses (Analysis 2).
Table 3-3: Thresholds (cm/s^) for detection of motion in the horizontal plane along the subject’s X 46 or Y axes.
Chapter Four: Reflex eye movements evoked by transient lateral acceleration: visual enhancement and suppression
Table 4-1: Test conditions and eye movement recording techniques 55
Table 4-2: Latencies measured on individual averages for the different test conditions in the light. 65
Table 4-3: Latencies of the first saccade observed among the ten ocular responses produced by each 65 subject for each test condition.
Table 4-4: Relative target velocities and eye velocities for VIS-VOR and FEX-VOR, at 80 ms after 67 motion onset.
Table 4-5: Ratios (eye velocity/relative target velocity) at 80 ms after motion onset during VIS- 69 VOR, FIX-VOR and PASSIVE GAZE.
Table 4-6: Slow-phase eye velocities measured on individual averages at 400 ms after motion onset 70 for experiments in darkness.
Table 4-7: Relative target velocities, velocity gains and ratios of eye velocity/head acceleration at 71 400 ms after motion onset for experiments in darkness.
Table 4-8: Desaccaded and raw eye movements produced at 500 ms after motion onset during 72 lateral accelerations of 0.05g, 0.1 g and 0.2g (IMAGINARY TARGET at 60 cm).
Table 4-9: Time after stimulus onset when the slow-phase eye velocities reached compensatory 73 levels.
Table 4-10: Proportions of slow-phases constituting the overall ocular responses assessed from the 75
grand averages obtained for VIS-VOR, FIX-VOR and VIS, at 300 ms after motion onset.
Tables
C hapter Five: Translational vestibulo-ocular reflex after unilateral vestibular deafferentation
Table 5-1: LVOR velocities before and after unilateral vestibular deafferentation, at 400 ms after 88 motion onset (PASSIVE GAZE).
Chapter Six: Psychophysics of the utricular control of visual stabilization
Table 6-1: Summary of the patients’ clinical data. 98
Table 6-2: Velocities, asymmetries and latencies of the LVOR in patients with absent caloric 101 responses.
Table 6-3: Categorisation of the performances (good, average, bad) observed in 14 normal subjects 106 during the visual acuity tests, for 1.5 Hz oscillation.
Table 6-4: Review of previous studies of the LVORs evoked by linear acceleration in patients with 108 bilaterally absent caloric responses.
Table 6-5: Numbers of misses and false recognitions for each visual acuity test. A: in 14 normal 112 subjects; B: in 14 patients with absent responses to caloric testing.
Table 6-6: OTOLITH SCORES in 14 normal subjects and 14 patients with vestibular failure. 114
Table 6-7: Summary tables of the numbers of errors and OTOLITH SCORES observed for each 115 visual acuity test. A: in 14 normal subjects; B: in 13 patients with absent caloric responses.
Chapter Seven: Interaction between linear and angular vestibulo-ocular reflexes during transient motion
Table 7-1: Amplitudes and velocities of the slow-phase ocular responses evoked in darkness during 123 pure translation, combined linear and angular displacement and isolated rotation.
Table 7-2: Relative target displacements and velocities calculated with a target distance of 150 cm, 124 for the different stimuli.
Figures
LIST OF FIGURES
Note; for presentation purposes, upward/downward deflections o f the recordings shown in the figures were not associated to leftward/rightward movements. For eye movement studies, chair motion was in opposite direction to the slow-phases of the ocular responses.
Chapter One: General introduction
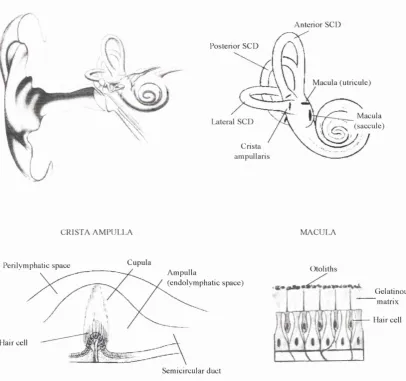
Fig. 1-1 : Anatomy of the vestibular system and of its sensory receptors, the crista ampulla and the 17 macula.
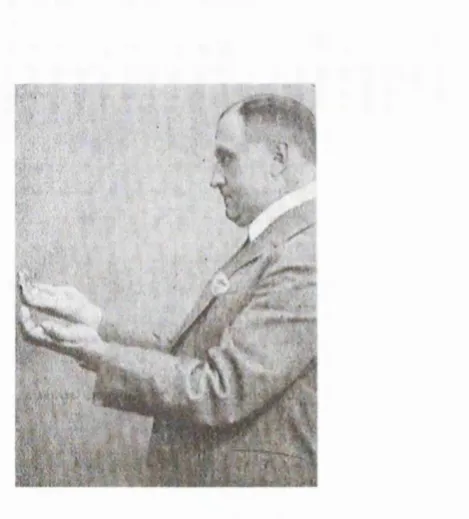
Fig. 1-2: Representation with the hands of the sh^e and position of the utricular macula for an 19 upright head position (from Quix 1929).
Chapter Two: Materials and methods common to several experiments described in this thesis
Fig. 2-1: Bogie employed to dispense the linear acceleration stimuli. 23
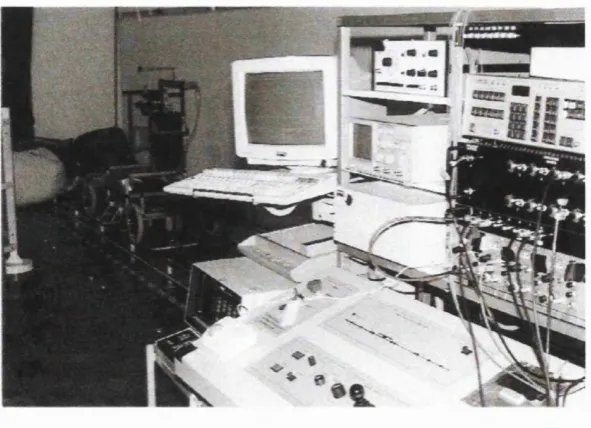
Fig. 2-2: Control panel and computer used to carry out the experiments (bogie in the background). 23
Fig. 2-3: Configuration of head clamping and bitemporal EOG recordings employed in the 24 majority of studies.
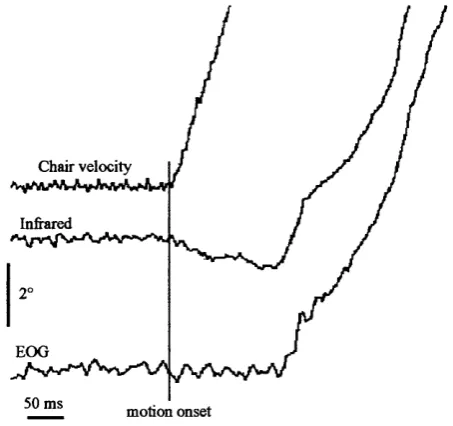
Fig. 2-4: Infrared and EOG recordings obtained in a patient without vestibular function during 25 translational lateral acceleration of 0.2g and ocular fixation on a 60 cm-distant earth-fixed target.
Artifact starting at motion onset and lasting about 150 ms can be observed on the infrared signal.
Fig. 2-5: Subject/target configurations (VIS-VOR, FIX-VOR, VIS) employed in eye movement 27 studies.
Fig. 2-6: Removal of a saccade from traces of eye position and eye velocity. 30
Fig. 2-7: Calculation of the distance of the plane on which the subject’s eyes converged. 31
Chapter Three: Perception of motion direction during passive lateral whole-body translation
Fig. 3-1: Pressure pads preventing differential movements of parts of the body and curtain 34 excluding visual cues and feeling of air-flow during whole-body translation.
Fig. 3-2: Proportions of correct responses vs. acceleration levels in one subject. 36
Fig. 3-3: Velocities, accelerations and gradients of acceleration associated to acceleration steps, 38 linear accelerations (SlowR and FastR) and parabolic acceleration (Par).
Fig. 3-4: Psychometric functions fitted to the average proportions of correct responses vs. 41 acceleration levels, for 8 normal subjects and 5 LDs. Bars at the bottom of the graph show the percentages of stimuli dispensed around one acceleration level.
Figures
Chapter Four: Reflex eye movements evoked by transient accelerations: visual enhancement and suppression.
Fig. 4-1: Acceleration transients used to evoke LVORs during interaural lateral motion. 56
Fig. 4-2: Procedure used to determine response latencies shown on the eye velocity average 58 record obtained for FIX-VOR, 30 cm - G.2g, in one subject (Search-coil recordings).
Fig. 4-3: Procedure used to measure ‘suppression’ latencies shown on the eye velocity average 59 record obtained for FIX-VOR, 30 cm - 0.2g, in one subject (Search-coil recordings).
Fig. 4-4: Latency and velocity measurements made on EOG recordings of ocular responses to 61 0.2g acceleration steps.
Fig. 4-5: Examples of raw eye movements recorded in darkness for 0.2g acceleration steps. 62
Fig. 4-6: Raw position records for the left and right eyes and averages of the velocities of both 62 eyes showing the nystagmic eye movements obtained in two subjects during 0.2g acceleration in darkness (PASSIVE GAZE).
Fig. 4-7: Examples of raw position recordings for the left and right eyes obtained with 0.2g 63 accelerations during VIS, VIS-VOR and FIX-VOR; target at 30 cm.
Fig. 4-8: Examples of raw recordings obtained in a normal subject and a patient without 64 vestibular function during 0.2g acceleration step and a 30 cm-distant earth-fixed target.
Fig. 4-9: Grand averages of the horizontal eye velocities recorded within 150 ms of stimulus 67 onset, i.e. before any saccadic contribution to target fixation, for 0.2g acceleration steps.
Fig. 4-10: Ratios {Grand average of slow-phase eye velocity/relative target velocity) for the first 68 300 ms following motion onset, during VIS-VOR, FIX-VOR and VIS.
Fig. 4-11: Grand averages of the desaccaded eye movements evoked in darkness (IMAGINARY 70 TARGET and PASSIVE GAZE) during 0.05g, O.lg and 0.2g acceleration steps
Fig. 4-12: Slow-phase eye velocities for VIS-VOR and FIX-VOR {grand averages) vs. RTVs 74 calculated for VIS-VOR, O.lg - 60 cm and 0.2g - 30 cm, for the first 300 ms following motion
onset.
Fig. 4-13: Averages of the horizontal and torsional right eye positions recorded in one subject 77 during VIS-VOR, FIX-VOR and VIS, for 0.2g acceleration and a target at 30 cm. Only the slow-
phases present before saccades were generated are shown. A: temporal responses; B. torsional vs. horizontal responses.
Chapter Five: Translational vestibulo-ocular reflex after unilateral vestibular deafferentation
Fig. 5-1: Vestibulo-ocular pathway for head rotation in the horizontal plane. 85
Fig. 5-2: Hair cell orientations of the right utricular macula. 85
Fig. 5-3: LVOR slow-phase velocities in 21 normal subjects. 87
Figures
Fig. 5-5: Average recordings, for each direction of motion, of the desaccaded LVORs evoked in a 90 patient before, one week after and ten weeks after leftsided vestibular nerve section.
Fig. 5-6: Proposed pathway for the horizontal LVOR. 93
C hapter VI: Psychophysics of the utricular control of visual stabilization
Fig. 6-1: Examples of motion stimulus, target display and responses from one subject during VIS- 100 VOR at 1 Hz (peak chair velocity of 42 cm/s and peak head acceleration of 2.6 m/s^).
Fig. 6-2: Examples of individual averages of the LVOR responses recorded in a normal subject, 102 and in patients with vestibular deficit.
Fig. 6-3: Means and quartile ranges of the number of errors made for each test condition by 14 103 normal subjects and 13 patients with absent caloric responses.
Fig. 6-4: OTOLITH SCORES during linear motion at 1.5 Hz vs. LVOR latencies in 14 patients 104 with absent caloric responses. The shadowed box indicates the ranges obtained in normal subjects.
Fig. 6-5: Three-dimensional plots of the number of errors (FIX-VOR vs. VIS vs. VIS-VOR at 1.5 105 Hz) made by 14 normal subjects (left plot) and 13 patients with vestibular loss (right plot).
Fig. 6-6: Superposition of the three-dimensional plots showing the number of errors (FIX-VOR 107 vs. VIS vs. VIS-VOR at 1.5 Ife) made by 14 normal subjects and 13 patients with vestibular loss.
Fig. 6-7: Justification for approximating the exact relative target velocity. 116
Chapter Seven: Interaction between linear and angular vestibulo-ocular reflexes during transient motion.
Fig. 7-1: Subject’s position during rotational stimuli, head centered and head eccentric. 119
Fig. 7-2: Geometry of ocular compensation during eccentric rotation. 121
Fig. 7-3: Determination of relative target displacements from chair velocity feedback. 122
Fig. 7-4: Examples of raw eye movements recorded in one subject during pure translation, pure 123 rotation and combined angular and linear motion.
Fig. 7-5: Grand averages of the slow-phase eye movements obtained in darkness. The lower 125 traces compare the eye movements produced during pure translation to the difference in ocular responses during head centered and head eccentric rotations.
Fig. 7-6: Grand averages of the slow-phase eye movements obtained in the light. The lower traces 126 compare the eye movements produced during pure translation to the difference in ocular responses
during head centered and head eccentric rotations.
ABBREVIATIONS
AL VOR: Vestibulo-ocular reflex in response to linear and angular motion AVOR: Angular vestibulo-ocular reflex
EOG: Electro-oculography
g: magnitude of the gravity vector (9.81 m/s^) IR: Infrared
LD: Labyrinthine defective subject LED: Light-emitting diode
LVOR: Linear vestibulo-ocular reflex N: Number of subjects
RTV: Relative target velocity RTD: Relative target displacement
SD: Standard deviation
VGEM: Visually-guided eye movement VOR: Vestibulo-ocular reflex
Chapter One - General introduction
1
General introduction
Several sensory systems contribute to the maintenance of balance and orientation in space, but the vestibular system of the inner ear evolved exclusively for this purpose. Vestibular signals indicate head position and movement in space and, in addition to providing the perception of head motion/orientation also subserve reflexes controlling eye, head and body position.
A. THE VESTIBULAR SYSTEM
The sensory receptors of the vestibular system are located in a complex of canals and vesicles (the membranous labyrinth which is filled with endolymph) surrounded by perilymph in turn encased by the osseous labyrinth. The vestibular apparatus consists of three semicircular canals (lateral, anterior and posterior) and two otolith organs, the utricle and sacculc (Fig. 1-1). The three canals which are approximately oriented at right angles to each others, with the horizontal canal parallel to the orbitomeatal plane, sense coplanar angular acceleration (Curthoys et al. 1977). The semicircular canals of the two ears operate in pairs, the anterior duct of one side being in the same plane as the posterior duct of the opposite side. The otolith organs are approximately oriented in a vertical plane for the saccule and in a horizontal plane for the utricle, each of them detecting coplanar linear acceleration. The receptor end organs which perform the transduction of head motion into neural signals are the crista ampulla for the semicircular canal and the macula for the otolith organs. Each receptor is made up of aggregations of sensory cells from which hairs project into a gelatinous substance (called cupula for the crista ampulla); it is the bending of these cilia which stimulates the receptor cells. For instance, during rotational head acceleration, the endolymphatic fluid within the semicircular ducts lags behind the canal rotation, because of its inertia. This fluid movement within the semicircular canal results in the bending of the cupula which activates the receptor cells of the ampulla. The gelatinous matter embedding the cilia of the utricular and saccular maculae is further covered by a layer of calcium carbonate crystals called otoliths (also statoliths, otoconia, statoconia). During linear acceleration, a sliding movement of the otolith layer occurs, since the latter has a higher density than the surrounding endolymph, which
Chapter One - General introduction
produces a bending of die sensory hairs sdmulating the sensory nerve ending. The inputs from die ampuUa and macula receptors are conveyed via the fibers of the vestibular nerve mainly to the vesdbular nuclei within the brainstem but also to the ipsilateral cerebellar cortex. This information on head motion and head position with respect to gravity is analyzed by the central nervous system in conjunction with information from the visual system and from general proprioceptive receptors throughout the body. As a result of this analysis, motor outputs are generated to maintain equilibrium.
A ntenor SCD
Posterior SCD
Macula (utricule)
Macula \ (saccule) Crista
ampullaris
C RISTA A M PU L L A M A C U L A
Cupula Perilymphatic space
Am pulla
(endolym phatic space)
Hair cell
Semicircular duct
Otoliths
G elatinous “matrix Hair cell
Fig. 1-1: Anatomy of the vestibular system and of its sensory receptors, the crista ampulla and the macula. SCD: semicircular duct.
B. EARLIER MAJOR FINDINGS ON THE VESTIBULAR SYSTEM
Chapter One - General introduction
publications (more details and references to articles published before 1935 are to be found in Stevenson and Guthrie 1949).
Despite an early application of the term ‘labyrinth’ to the inner ear in the century by the Greek Galen, the anatomy of the ear, and in particular the vestibular system, was only precisely described during the XVII**’ and XVni* centuries through the works of Duvemey (1683), who gave an accurate account of the bony labyrinth, Cotunni (1760), who showed that the labyrinth was entirely filled with fluid, and Scarpa (1789), who discovered the membranous labyrinth, described the saccule and utricle, and distinguished the fluid contents of the bony and membranous labyrinth as perilymph and endolymph. However, it was not until the middle of the XIX* century that the physiology of the auditory and of the vestibular system was elucidated. Flourens (1830) found that section of the semi-circular canals in pigeons produced head movements varying according to the canal injured and suggested that the acoustic nerve consisted of a cochlear part concerned with hearing, and a vestibular part concerned with equilibrium. A few years later, Meniere (1861) observed that vertigo could be due to an affection of the inner ear. Meanwhile, Von Helmholtz (1862) elucidated the mechanism of hearing and recognized that the semicircular canals played no part in hearing (1862) in contrast with Duvemey’s hypothesis that the cochlea was the site of the actual organ of hearing, while the semicircular canals acted as amplifiers. In 1874, Breuer noted that animals subjected to rotation exhibited head movements similar to those observed by Flourens in pigeons and was the first to point out that the movements of the eyes during rotation in humans was a labyrinthine reflex. The same year, Crum Brown suggested that the canals were associated with the sense of position. However, it was not until later than Bérâny (1907) worited out a series of tests for semicircular canal function. Tests for the otolith organs were first proposed by ()uix (1929) who also provided an interesting way to visualize their topology, as reported below for the utricular
macula;
'‘Faites une flexion dans I ’articulation entre la première et la seconde phalange des doigts
jusqu ’à ce que l ’angle entre les deux dernières phalanges et la première, qui reste dans le plan de
la paume, soit de 140°. La surface du plan des deux dernières phalanges est un peu plus petite que
la moitié de celle de la première phalange et de la paume de sorte que le rapport entre les deux
plans de la main correspond à celui des deux parties du lapillus.
Pour placer la main, après lui avoir donné la forme d ’un lapillus, dans la même situation
dans l ’espace q u ’à un lapillus dans la position ordinaire de la tête, serrez les deux bras
verticalement contre les côtés du corps, puis donnez aux avant-bras une supination de sorte que les
paumes soient tournées vers le haut et qu ’elles se trouvent dans le plan horizontal; enfin faites une
flexion dans l ’épaule en avant de 19°. '
Chapter One - General introduction
English version: 'Fold your fingers to create an angle o f 140° between the medial and
proximal phalanges (which stay coplanar to
the palm). To position the hand, now a
scaled-representation o f the otoconial layer,
in the same orientation as the macula for an
upright head position, bring your upper arms
to your sides and your forearms in the
horizontal plane with your palms turned
upwards. Then rotate your shoulder 19°
forM’ards. ’
Fig. 1-2: Representation with the hands of the shape and position of the utricular macula for an upright head position (from Quix 1929).
At the time, many discussions were held about whether pressure (Quix 1923). traction (Magnus 1924) or shearing forces (Breuer 1891, Steinhausen 1935) on the otoconial layer upon the underlying surface of the sensory epithelium was the adequate stimulus for the otolith organs. Shearing forces acting parallel to the surface of the macula were established as the adequate stimulation following X-ray observ ations of otolith membrane movement in fish by de Vries (1950) and Vilstrup and Vilstrup (1952) and studies in human of oculomotor responses and motion perception produced by linear acceleration (e.g. Miller 1962, Bos et al. 1963).
C. AIMS OF THE THESIS
Chapter One - General introduction
translational head acceleration but also change in head orientation with respect to the gravitational vector (Gresty 1996, for review). Thus, perceptual testing includes perception of the subjective vertical, of linear translatoiy acceleration and of the visual vertical. Eye movement studies include responses to linear translation, linear motion combined with angular motion, head tilt and off- vertical axis rotation. More recently, motor reflexes in the limbs, neck and trunk have also been under examination. The number of current studies related to the otolith organs reflects the growing interest of the scientific community in this part of the vestibular system and in its role for the maintenance of equilibrium.
The work presented hereafter concentrates on the utricular detection of translational interaural head acceleration. The reason for employing lateral accelerations was that earlier e?q)eriments performed in the laboratory had shown that such stimuli were adequate in evoking strong linear vestibulo-ocular reflexes (LVORs) and therefore investigations using this type of stimuli seemed worth pursuing. As mentioned previously, vestibular signals not only trigger reflex responses but also produce the perception of motion. Both aspects were investigated in the present work as indicated in the following brief presentation of the ch ^ters of this thesis.
Chapter 2 introduces the main techniques and equipments employed to carry out the different experiments.
Chapter 3 describes tests exploring the effect of stimulus waveforms on perception of passive motion. The concept of these experiments was inspired by the description of macular afferent response to linear forces, showing that otolithic neurons comprise regular units responding to acceleration and irregular units responding to acceleration and its gradient (Fernandez and Goldberg 1976). Thus, this part of the thesis investigates if such neural findings are mirrored at a perceptual level, with a dependency of thresholds for detection of linear motion on acceleration profiles.
The next ch^ters (4-7) focus on ocular reflex responses to head translation. During head motions occurring in everyday life, the pursuit, optokinetic and vestibular systems interact to preserve visual stability. As visually-guided eye movements are limited in frequency to around 1 Hz, in velocity to around 50°/s and have a response latency above 100 ms, it is around and above these limits that vestibulo-ocular reflexes (VORs) can play a useful role for the maintenance of ocular fixation. Up to now, most studies of the LVOR have concentrated on the frequency response to oscillatory motion, while short-latency responses have been neglected. The LVORs evoked within the first hundred milliseconds of interaural head acceleration were therefore chosen as the main subject of the eye movement studies (Chapters 4, 5, 7).
Chapter 4 studies the influence of visual context on the LVORs and investigates whether short-latency oculomotor responses to head translation depend on the distance of ocular fixation and on the motion of the object of regard, as would be e?q)ected from geometrical consideration.
C h u te r 5 describes LVORs evoked in patients during transient interaural acceleration in darkness, before and shortly after they had undergone unilateral vestibular neurectomy. These
Chapter One - General introduction
patients with acute unilateral loss of vestibular function were tested in order to explore any directional organization of the horizontal LVOR pathway.
Eye movement recordings are essential in describing the dynamics of VORs but they only provide indirect estimates of the functional role of these reflexes for the maintenance of visual stability. To obtain a more direct evidence that LVORs do contribute to visual stability, a psychophysical ejq>eriment was designed (Chapter 6); subjects were asked to recognize numbers intermittently presented on a display, during sinusoidal whole-body motion, target motion or
concomitant target and subject motion.
All the chapters introduced so far deal with isolated linear interaural acceleration. As linear accelerometers, the otolith organs respond similarly to head tilts which produce ocular-
counterrolling and to head translations which evoke eye movements in opposite direction to head acceleration. Thus, a decision on the type of eye movements required to corrq)ensate for the actual head motion/position has to be made at a central level. To do so, information from other sensory systems and in particular from the other part of the vestibular system, the semicircular canals, could be used to determine the origin of the otolithic signal: head tilt or head translation. This idea has previously been advanced to explain that, during oscillatory motion, LVOR gains are enhanced by concurrent semicircular canal stimulation. The experiments reported in Chapter 7 investigate the latency for such an interaction between utricular and canalicular activation; eye movements evoked during transient combined translational and rotational acceleration are compared to the short latency responses evoked during isolated linear and rotational accelerations.
In Chapters 3-6, patients with defective vestibular function were tested to estimate the role of the vestibular system in the responses observed in normal subjects. The potentials of the various experiments presented in this thesis for the establishment of a routine clinical test of otolith dysfunction are discussed in the general conclusion (C huter 8).
References not found in Stevenson and Guthrie 1949 and not included in the list of references
at the end of this thesis:
Breuer J (1874) Ueber die funktion der Bogengange des Ohrlabyrinthes. Med. Jb., Wien, 6: 762-124
Breuer J (1891) Uber die Funktion der Otolithen-apparates. Pflueger Arch. Ges. Physiol. 48: 195-
306
Quix FH (1923) L ’examen clinique de la fonction des otoliths. Ann. Mal. Oreil. Larynx 62, no. 3
Steinhausen W (1934-1935) Über die durch die Otolithen ausgelôsten Krâfte. Pflügers Arch. Ges.
Chapter Two - Materials and methods
Materials
and
methods
common
to
several
experiments described in this thesis
The difierent e?q)eriments presented in this thesis investigated the perception of motion and the eye movements produced by translational accelerations delivered along the subjects’ interaural axis. The first part of this chuter describes the acceleratory device used to generate the various translational stimuli. Then, the techniques adopted to record ocular responses are introduced. This is followed by the definition of the configurations between subjects and visual targets which were enq)loyed in eye movement studies (Ch^ters 4-7). The end of this chuter describes the techniques involved in the analysis of eye movement recordings; the data analysis process was similar for all studies involving eye movemait recordings since they all enç)loyed transient stimuli. Techniques or ^ a r a tu s ^ecific to one e^eriment are described in the associated chapter.
A. LINEAR ACCELERATORY DEVICE
Translation along the interaural axis was provided by a bogie mounted on wheels with pneumatic tyres and powered by two linear motors (Davy Linear Motors Ltd). The bogie ran on a precision levelled 7-m long linear track (Fig. 2-1). The motor thrust units were located in the lower
part of the bogie, on each side of a reaction plate which was situated along the middle of the track. The motors were servo-controlled by velocity feedback from a tacho-generator driven by a friction wheel ruraiing on the track. The chair could be moved by the experimenter with a joystick on the control panel, by the subject wiüi a joystick on the bo^e or via an analogue iiçut coimected to a conqjuter.
Subjects were seated içright with their knees and torso restrained with pressure pads. Their head was either fixated with clanqrs ^ l i e d laterally around the ears or, for experiments employing search-coil recordings, with a dental bitd)ar secured to the frame of the coil system and a hard rubber head rest In this case, the upper part of the chair which included lateral head clamps was removed and replaced by the finme of the magnetic field.
Chapter Two - Materials and methods
Fig. 2-1: Bogie employed to dispense the linear acceleration stimuli.
A personal computer was used to generate the stimuli and to record the experimental data (e.g. chair velocity feedback from the tacho-wheel. acceleration signals, eye movements). Head and target accelerations in the direction of motion were measured with precision piezo-resistive linear accelerometers, passband DC -> 1 kHz. mounted on a bitebar or secured with surgical tape on the subject’s forehead or target display.
Chapter Two - Materials and methods
B. EYE MOVEMENT RECORDING TECHNIQUES
1. Electro-oculography (EOG)
Most of the experiments employed bitemporal direct current EOG recordings which were filtered at 80 Hz (2"^ order Butterworth filter) and digitally san^led at 250 Hz. A few monocular recordings of both eyes were made but they were rejected due to their high noise levels and drifts which hindered any precise measurements. Before j^plying the electrodes (Biolect-S Ag/AgCl), the skin was cleaned with a prqjaration cream (ARBO-PREP, Medizin Technologie) containing a mildly abrasive substance to reduce skin resistance. To avoid drift on the recording, care was taken to leave the electrodes on the skin for about 10 minutes before starting the e>q3eriment and fans were used to prevent the subjects from sweating Tests were only started after stable eye movement calibrations liad been obtained Also, care was taken to place the electrodes clear fixim the clamps, in order to avoid recording artifacts which might have been produced by an acceleration-created pressure between skin and electrodes. Eye movement calibrations were performed before and after each test session with fixations at 10° or 12° left and right from the target centre. In addition, tlie linearity of the EOG was ascertained on a few subjects from 0° to ±7° in 1° steps and from 0° to ±30° in 5° steps.
Fig. 2-3; Configuration of head clamping and bitemporal EOG recordings employed in the majority of studies.
2, Scleral search-coils
Binocular scleral search coils (C.N.C. Engineering, Seattle USA) were employed to record three-dimensional eye positions (horizontal, vertical and torsional) and to assess vergence. Lenses were applied w ith the help of a comeal anaesthetic; 2 drops applied 5 minutes before lens insertion (Minims
Chapter Two - Materials and methods
Benoxinate hydrochloride 0.4%, Chauvin pharmaceuticals). As the intraocular pressure rises because of the lens suction (Robinson 1963), experiments with search-coils were limited in time to 20 minutes. A third search coU was tq)ed to the subject's forehead to monitor angular head movements which could occur despite the use of a dental bitebar attached to the chair. The open cubic fiame (78 cm wide, 63 cm h i ^ 61 cm deq)) sipportmg the Helmholtz coils was screwed on the top of the chair structure (which had been moditied for the purpose of this e?q)eriment) and secured ûom deforming under acceleration by tensioned stays. The subject's eyes were centred with req)ect to the Helmholtz coils. CoU signals were recorded with a bandwidth of 0-400 Hz (-3 dB, analogue filter) and digitised on-line at 1 kHz. Eye movement calibrations were performed for horizontal and vertical angles of ±2° and ±6.5°. Calibrations of torsional coU movements were performed with a precision gimbal simulating three-dimensional movements of the globe. QfiF-line analysis of the raw signals provided angular eye and head positions in Pick co-ordinates relative to the chair-fixed coU system german et al. 1987).
3. Infra-red corneal reflection detectors
The infia-red detectors (IRIS system, Skalar Medical) were mounted on a dental bite with additional head band siqjpoit Care was taken to fix the head to the fiame of the bogie with clangs which did not encroach on the detector mounting. Nevertheless, recordings indicated anti-conq)ensatory eye movements which were proportional to head acceleration and unrelated to target distance, starting fiom chair acceleration onset and lasting about 100 to 150 ms, as observed during acceleration steps of 0.2g.
Chair velocity
Infrared
EOG
50 ms motion onset
Chapter Two - Materials and methods
Since these anti-compensatoiy responses were also present in a patient without vestibular function (Fig. 2-4), it was concluded that they were artifacts due to slqipage of the infia-red support fiame and not genuine eye movements. The infia-red technique was therefore not adequate to measure short- latency responses. However, this technique was employed for a few experiments in order to measure vergence before stimulus onset and at 400 ms after motion, i.e. when the recordings were not influenced by eariy motion artifacts. Eye movement calibrations were performed on targets at ±5°, ±10° and ±15° in the horizontal plane.
C. SUBJECT-TARGET CONFIGURATIONS FOR EYE MOVEMENT
STUDIES
The effect of visual context on ocular reqx>nses to head acceleration and the interaction between VORs and visual following mechanisms were investigated using different configurations between subjects and targets (Table 2-1).
Experim
VIS-VOR
ents in the tig
FK-VOR
ht
VIS
Experiments it
darkness
PASSIVE GAZE
Î
IT
Chapter 4: Visual modulation of the LVOR
X X X X X
Chapter 5; LVOR after unilateral vestibular deafferentation
X
Chuter 6; LVOR and visual
stability
X X X X
Chuter 7: Interaction between
LVOR and AVOR
X
XTable 2-1: Configurations between subject and target used in eye movement studies (described in the following pages); IT; IMAGB^ARY TARŒT.
When testing a subject, the configuration (i.e. VIS-VOR, FTX-VOR, VIS, PASSIVE GAZE, IMAGINARY TARGET) was only altered once all the motion stimuli had been delivered for aU selected target distances.
1. Experiments in the light
Chapter Two - Materials and methods
(a). VIS-VOR condition
Subject acceleration only, earth-fixed target. The subject was translated and asked to keep looking at the centre of an earth-fixed target; VORs and VGEMs were expected to be generated.
Note: I ’GKM = Visually-guided eye movement
(b). FIX VOR condition
Chapter Two - Materials and methods
/(c). VIS condition Target translation only. The subject remained stationary, head restrained, while visually pursuing the target physically displaced by the bogie on which a load of 70 kg was placed to produce similar chair displacements as during VIS-VOR: VGEMs were tested in isolation.
Alternatively, the subject sat on the bogie which remained stationary in front of a tangent screen on which the target was back- projected via a mirror-galvanometer.
Previous recordings of chair velocity feedback were used to calculate the position command fed to the mirror galvanometer in order to provide compzunble RTDs as during VIS-VOR.
Note: RTD = Relative target displacement
Fig. 2-5: Subject/target configurations (VIS-VOR, FIX-VOR, VIS) employed in eye movement studies.
Note: fhe target distance from the subjects’ nasion was 30, 40, 60 or 280 cm.
2. Experim ents in the dark
The linear track was located in a windowless room in which direct and liuninescent lights were covered with black tape (or fabric). Room lights were extinguished 1 s before chair motion and reilluminated once the displacement was completed. Subjects were either instructed to gaze passively ahead or to imagine an earth-fixed target
Chapter Two - Materials and methods
(a). PASSIVE GAZE condition
To minimise the effect of target distance which may modulate the LVOR, a grey screen (1.2 m X 1.2 m) was placed at 1.5 m from the subjects who were instructed ‘to look at the screen without fixating any particular point on it, and to gaze passively ahead once in total darkness \
(b). IMAGINARY TARGET condition
Before each stimulus, the subjects were positioned in front of a target situated at 60 cm from their nasion, a distance making a compromise between ease of fixation and proximity (parameter enhancing LVOR reqx)nses). They were required to keq) their eyes in the direction of this target once they were put in total darkness.
3. Determination of relative target motion
For all e?q)eriments in the light, subjects were asked to keep watching the target central point. The quality of ocular fixation was estimated by comparing the oculomotor r e f u s e s to the relative target displacements (°) or velocities (7s).
For VIS-VOR and VIS with the target mounted on the bogie, RTDs and RTVs were calculated as: 1) RTD = arctan(chair position/target distance)
with chair position obtained after digital integration of the bogie velocity feedback.
Since chair velocity feedback was recorded, RTVs were calculated as a direct function of this signal rather than by differmtiating the RTDs, in order to reduce noise and drift due to the digital processing:
2) RTV = (chair velocity/target distance) x cos ^(arctan(chair position/target distance)).
For VIS with the target projected on a tangent screen, the angular position of the mirror was recorded and was therefore used to calculate RTDs and RTVs:
3) RTD = arctan(distance mmor-screen x tan(minor angular position)/distance subject-screen).
4) RTVs were calculated by digitally differentiating the RTDs.
Chapter Two - Materials and methods
D. ANALYSIS OF EYE MOVEMENT RECORDINGS
Recordings were analysed ofT-iine using an interactive computer program (D. Buckwell). Both for EOG and search-coil recordings approximately 10 % of the data were discarded because of blinks, drifts or saccades present during the 200 ms preceding chair motion. Eye velocity signals were obtained from the digitized position recordings by differentiation using a central difference algorithm (±1 point Bahill and McDonald 1983).
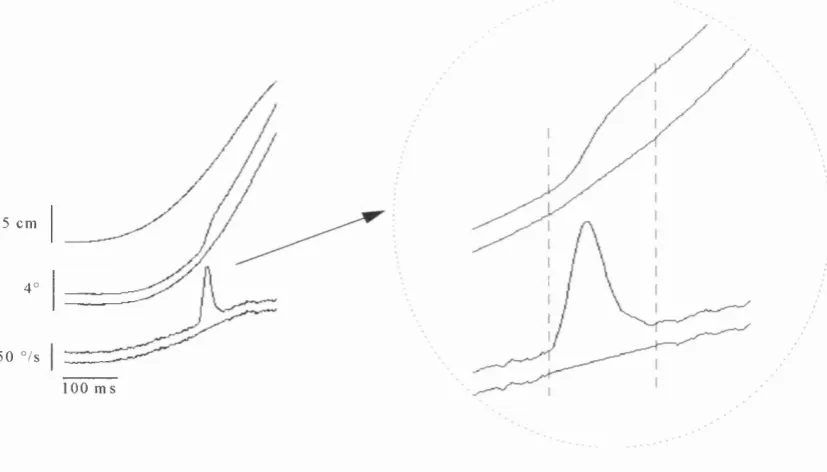
1. Desaccading
Saccades were visually identified both on eye position and eye velocity signals and were removed 1) from the eye position recordings by replacing them with straight lines whose slopes were estimated means of the pre- and post-saccadic slow-phase velocities and 2) from the eye velocity signals by joining the pre- and post- saccadic points with straight lines (Fig. 2-6).
5 cm
4°
50 °/ s
1 00 m s
Fig. 2-6: Removal of a saccade from traces of eye position (middle curves, left picture) and eye velocity (bottom curves, left picture). The top curve of the left picture shows chair displacement, fhe picture on the right zooms in the area surroimding the saccade; the lower curves of the position and velocity recordings are the
desaccaded signals.
2. Averaging
Recordings were averaged separately for each direction of chair motion and for each relative target displacement. Motion onsets were defined with a cursor placed on the velocity feedback signals
Chapter Two - Materials and methods
and were used to synchronize the averages of the recordings Means were made on time records of 1(X)0 ms. including an qx)ch of 250 ms before chair motion, and were digitally filtered at 30 or 75 Hz. The averages for each subject {Individual averages) were pooled together to obtain grand averages describing the mean responses from a group of subjects.
3. Curve fitting
Cur\ e filling tecluiiques wliich used a least-square error estimation procedure (CSS-Statistica, StatSoft USA) were employed; 1) to reduce tlie influence of noise on the measurements made on the recordings and 2) to find the best algebraic functions describing sets of experimental data.
4. Vergence and plane of ocular fixation
Vergence was defined as the position of the right eye subtracted from the position of the left eye. When subjects fixate a tangent screen, changes in gaze direction will usually modify vergence while the distance of the plane of ocular fixation which is parallel to the inter-ocular axis remains constant. In our experiments employing pure linear acceleration, tlie relative target displacements were parallel to the subjects’ inter-ocular axis and therefore, to assess if the subjects were looking at the correct planes of target translation, vergence was not measured on its own but was used to determine the distance behveen the inter-ocular axis and the plane of visual fixation. This distance (d) which takes both vergence and direction of gaze into account was calculated as;
d = (Inter-ocular distance)/(tan(Leye + a) - tan(Reye - a)) where Leye and Reye are the angular deviations of botli eyes from primary gaze and a is the angular eye position in primary gaze (Fig. 2-7).
Leye/A Reye.
K
X---Fig. 2-7: Calculation of the distance (d) of the plane on which the subject’s eyes converged.
K: inter-ocular distance; a and -a: angular {position of tlie left/right eye in primary gaze; Leye and Reye; horizontal
deviation of the left/right eye from primarv gaze.
Chapter Three - Perception of linear motion
Perception of motion direction during passive lateral
whole-body translation
A. ABSTRACT
This study investigated whether perception of lateral displacement is related to the dynamic response of the otolith organs to acceleration. To do so, thresholds for detection of direction of whole-body interaural acceleration were determined for various stimulus profiles, in normal subjects and patients without vestibular function (LDs). For acceleration steps, acceleration thresholds at 67% correct detection of motion direction were similar for eight normal subjects (mean 4.84 cm/s^ (range 2.9-6.3)) and five LDs (mean 5.65 cm/s^ (4.85-6.6)). Velocity thresholds were 7.93 cm/s for normal subjects (73% of correct responses) and 9.67 cm/s for LDs (69% of correct responses). For linear and parabolic accelerations, acceleration thresholds for 74% of correct responses were in normal subjects (N = 9), 12.1 cm/s^ (7.3-20.4) for a ramp with gradient of acceleration = 2.8 cm/s^, 19.2 cm/s^ (10.4-35.3) for a ranq) with gradient = 7.9 cm/s^ and 16.7 cm/s^ (10.5-25) for a parabola with gradient rising from 0 to 13.5 cm/s^. The respective thresholds for two of the three LDs who were able to detect motion direction were 13.2 and 20 cm/s^; 21.4 and 30.6 cm/s^;18.4 and 19.1 cm/s^. The corresponding velocity thresholds for normal subjects were 21.2 cm/s (5.2-50.3), 22.0 cm/s (7-56.6) and 22.2 cm/s (9.5-43.7). In normal subjects, the lowest thresholds were obtained for acceleration steps, indicating that higji acceleration gradients facilitate motion perception (peak gradients of 22 cm/s^ for liminal acceleration steps). For linear and
parabolic accelerations, mean velocity thresholds were conq)arable, which suggested that the process of motion perception follows an integration of acceleration, but a high inter-subject
variability was observed. For all stimuli, the ranges of thresholds for normal subjects and LDs overtyped showing that detection of motion was not a sole prerogative of the otolith organs but could also be performed using somatosensory cues.
Chapter Three - Perception o f linear motion
B. INTRODUCTION
The reliability of tests using ‘perceptual’ estimates of self-rotation to evaluate semicircular canal function is now well established (Metcalfe and Gresty 1992, Brookes et al. 1993, Brookes et al. 1994, Kanayama et al. 1995). Such perceptual tests can provide useful alternatives to vestibulo- ocular testing, particularly for assessing vestibular function in patients with abnormal eye movements, such as congenital, nystagmus, ophthalmoplegia. No similar tests are presently being used to evaluate otolith dysfunction, despite the existence of numerous studies on perception of linear acceleration; perception of verticality (during sustained linear acceleration as produced by a centrifuge, or sustained gravitational force as generated by a tilting device) or perception of linear horizontal/vertical whole-body motion with the subjects positioned in various orientations relative to the axes of motion (Guedry 1974 for review).
One of the first extensive studies on perception of linear motion (Walsh 1960, 1961) reported thresholds for the detection of sinusoidal lateral accelerations in LDs that were nearly ten times higher than in normal subjects, and concluded that normal subjects relied on vestibular signals to detect their motion direction. These promising findings did not however result in the establishment of a routine clinical test of otolith function. Despite the potential of other sensors to perform the task, such as skin mechanoreceptors or, as suggested by Mittelstaedt (1992), gravity receptors located in the trunk, later studies on motion perception were carried out with normal subjects and usually assumed that the otolith organs were responsible for the process of motion detection. This assumption seemed justified by a study in normal subjects showing that detection thresholds of linear motion increase as stimulus frequencies decrease (Benson et al. 1986b). This frequency dependency of the thresholds was similar to the frequency response of the irregular otolith units described by Fernandez and Goldberg (1976); they recorded the activity of otolith neurones in monkeys subjected to linear forces and demonstrated the existence of regular units responding to acceleration and of irregular units responding to acceleration and its gradient. However, in contrast with Benson's results which indicated that both acceleration and its gradient play a role in motion detection, Melvill Jones and Young (1978) reported that sensitivity to motion direction of linear acceleration steps was dependent on velocity. This suggests that the process of motion perception might be influenced by acceleration profile characteristics since different stimuli were used in these two independent studies. If motion perception does depend on stimulus waveforms, some acceleration profiles may activate more specifically the vestibular organs and therefore provide a better basis for the design of a test of otolith function.
Chapter Three - Perception of linear motion
C. MATERIALS AND METHODS
1. Apparatus
Sensitivity to motion is affected by cues from the visual, auditory, proprioceptive and somatosensotory systems. For the present experiment, some of these cues were removed or limited to try to isolate the contribution of the vestibular system to motion perception. The bogie described in chapter 2 (section A) was used to deliver the translational stimuli.
'
Fig. 3-1: Pressure pads preventing differential movements of parts of the body and curtain excluding visual cues and feeling of air-flow during whole-body translation.
The subject’s head was restrained by wide lateral pressure pads (circular surface of 16 cm in diameter), Fig. 3-1. Any noise from the environment was totally masked with ear defenders located inside the pressure pads. However, some sounds from the bearings could still be heard as they were transmitted through the head clamps; they did not give any indication of motion direction but to hinder the subjects from concentrating on these sounds, white noise (sound intensity of 65
Chapter Three - Perception of linear motion
dB) was dispensed through earphones located inside each ear defender. Experiments were conducted in total darkness; before each stimulus, the room light was switched off and a lightproof curtain enveloping the chair prevented the subjects from discerning any light from the laboratory
environment For chair motion with high velocity, the curtain also excluded the feeling of air-flow. Chair vibrations could not be excluded; their magnitude increased with chair velocity and reached up to 45 cm/s^ peak along the axis of motion for the linear and parabolic accelerations described hereafter. Since vibrations alone could produce sensations of motion, subjects were asked to indicate the direction rather than the perception of motion.
2. Experiment 1: acceleration steps
(a). Stimuli
Fifty unidirectional stimuli were randomly dispensed to the right and to the left (25 stimuli for each direction). The various levels of acceleration were obtained by multiplying the amplitude of a 'reference' waveform which was an acceleration step of 26.2 cm/s^ lasting 3.7 s and followed by a short period of deceleration (overall chair displacement of 239 cm). Due to static friction of the chair over the track, a reduction of the acceleration level resulted in a decrease of the acceleration period down to 2.3 s for an amplitude of 2.6 cm/s^ (overall chair displacement of 6.6 cm). The subjects received feedback of the direction they had moved, from the short deceleration phases as well as from the returns of the chair at supra-liminal accelerations to the track centre.
(b). Threshold determination
The acceleration threshold was defined as the acceleration which would yield a proportion of correct detection equals to 0.67. An adaptive psychophysical procedure was employed in order to find a precise estimate of the threshold in a limited number of stimuli. Adaptive procedures are characterised by a set of rules determining the evolution of the test so that a maximum number of stimuli are dispensed at liminal levels (Hall 1981):
1. Starting point: an initial acceleration of 10.6 cm/s^ was chosen in order to assess the proportion of correct detections at accelerations higher than the estimated threshold of around 6 cm/s^, and to give the subjects some easy stimuli to start with.
Chapter Three - Perception of linear motion
was too far from the threshold, the stimulus amplitude was decreased if w was positive and increased otherwise. An initial step of +/- 8 dB corresponding to a multiplicative coefficient of 0.4 or 2.5 was used to modify the stimulus amplitude. For each change in step direction, the step size was halved up to a minimum size of 1 dB corresponding to a multiplication factor of 0.89 or 1.12. 3. End of the experiment; after 50 stimuli.
4. Threshold determination: the proportion of correct responses was calculated for each acceleration level. Then, a psychometric function P(x) was fitted to the data using a least square error estimation procedure.
P(x)= 1/(1 + exp(-(x-a))/6)
where P(x) is the proportion of correct responses at an acceleration level x, a corresponds to the midpoint of the psychometric function and b to its spread.
The acceleration threshold was determined as the abscissa of the point corresponding to P(.x) = 0.67 (Fig. 3-2).
100
-I
Oc
o
•E
f
P(x) = 1/(1 + exp(-(x - a)/b))
10
2 4.85
Acceleration (cm/s-)
Fig. 3-2: Proportions of correct responses vs. acceleration levels in one subject. The data points (circles) were fitted with the psychometric function defined by a = 4.087 cm/s^ and b =0.693 cm/s^ (Coefficient o f
correlation = 0.99). The threshold o f 4.85 cm/s* was obtained by finding the point o f the psychometric
function whose ordinate was 67%.
Chapter Three - Perception of linear motion
3. Experiment 2: linear and parabolic accelerations
(a). Stimuli
This experiment did not enq)loy an adaptive procedure for the following reasons. Firstly, the minimum number of 100 stimuli required (2 profiles x 50 stimuli) was not compatible with a reasonable test duration. Secondly, due to chair stiction on the track, the multiplication of a reference waveform would have produced inaccurate acceleration onsets which would have been sensed as small jolts. Thirdly, the limited track length of 7 meters prevented the use of suprathreshold accelerations which are necessary with adaptive psychophysical techniques, bearing
in mind that smooth motion onsets had to be delivered.
Instead of using an adaptive procedure, 3 fixed waveforms, 2 linear and 1 parabolic accelerations, were generated. They all included a signal compensating for the chair stiction, thus assuring smooth and controlled motion onsets: this signal lasting 1.5 s was conq)osed of three velocity ramps which created slight chair vibrations without generating motion. The linear stimuli comprised a lower acceleration ramp (SlowR) which attained 28.4 cm/s^ and 1.4 m/s in 9.9 s, constant gradient of 2.8 cm/s^, and a higher acceleration ramp (FastR) which attained 56.2 cm/s^ and 2 m/s in 7.1 s, constant gradient of 7.9 cm/s^. The parabolic waveform (Par) produced an acceleration of 60.4 cm/s^ and a velocity of 1.83 m/s in 8.9 s, with a gradient rising from 0 to 13.5 cm/s^, thus providing the smoothest motion onset and intersecting the gradients of the 2 linear accelerations. These stimuli reached high acceleration levels as preliminary experiments on normal subjects showed that motion detection failed for stimuli with smooth onsets and final accelerations lower than 20 cm/s^. The three acceleration profiles were randomly ordered, and presented ten times to the subjects: 5 times in each direction of motion.
To reach strong accelerations while keeping gentle motion onsets, the maximum length of the track was used. Therefore, before each stimulus, the chair was driven to one end of the track without the subjects being informed of their location. This was done by using a subliminal acceleration consisting of a single cycle sinewave (bell shape for the velocity signal) with a peak value of 2.7 cm/s^, a period of 25 s, and a maximum velocity of 20 cm/s. During these ‘positioning’ stimuli, the subjects were asked to count the number of flashes of a head-fixed light emitting diode
(LED) situated at 40 cm. The LED, switched on and off with a square wave whose frequency varied between 0.4 and 1.4 Hz, reminded the subjects not to indicate their motion direction, and also distracted them from trying to guess their final location. One might suggest that a visual cue could lower the thresholds of motion perception, in which case the accelerations of 2.7 cm/s^ used during the positioning’ stimuli might have been too high. However, the LED could safely be used as Benson and Brown (1989) have shown that head-fixed visual displays do not lower the detection thresholds of linear motion.