ISSN 2348 – 7968
Spectral Angle Mapper Algorithm for Remote Sensing Image
Classification
Rashmi S1, Swapna Addamani1, Venkat1and Ravikiran S2
1
M.Tech, Department of Computer Science and Engineering, GSS Institute of Technology, Bangalore, Karnataka, India
2
Master of Technology in Software Engineering, Bangalore, Karnataka, India
Abstract
The paper aims at explaining the usage of SAM algorithm for satellite image classification. Hyperspectral Image provides pixel spectrum that fetches detailed information about a surface to identify and distinguish between spectrally similar (but unique) materials. The Hyperspectral Image sensor placed on board the Remote Sensing Satellite captures Hyperspectral Images with various bands of spectrum. Experiments are carried out for the implementation of Spectral Angle Mapper (SAM) on Hyper- spectral Images for classification of pixels on the surface. The false color composite of the image is also obtained for better visualization of surface differences. The Hyperspectral Images of various bands are stacked one after the other to form three-dimensional Cube of images for SAM implementation. SAM is a supervised classification algorithm which identifies the various classes in the image based on the calculation of the spectral angle. The spectral angle is calculated between the test vector built for each pixel and the reference vector built for each reference classes selected by the user. Results are obtained to read and reorganize multiple 2-D datasets into a single compact 3D dataset cube. The reference vector is built for performing SAM classification and the angle between the reference vector and pixel vector is calculated to compare with the determined threshold angle value. The color coding is then applied to distinguish between the various classes that have been recognized by the SAM algorithm. Hence using SAM, Hyperspectral images are analyzed to extract thematic information such as land-cover, water bodies, and clouds.
Keywords: Hyperspectral images, Remote Sensing, Spectral Angle Mapper Classifier, Statistical Analysis.
1. Introduction
Space based Remote sensing images of the earth are processed and studied to describe and understand the interactive physical, chemical and biological processes that regulate the earth system. Hyperspectral Images are being used for remote sensing applications particularly for better natural resource management such as mineral mapping and crop assessment. Remotely sensed data is analyzed to extract thematic information. For example, themes may
include land-cover, water bodies, and clouds. Image classification is one of the methods of thematic information extraction. Classification may be performed using supervised and unsupervised approaches. In this approach, classification of the Hyperspectral Image is performed using the Spectral Angle Mapper Algorithm which is a supervised approach. The Spectral Angle Mapper (SAM) algorithm has been widely utilized for remote sensing image. Pixel with minimum or zero spectral angles in comparison to the reference spectrum is assigned to the class defined by reference vector. However, when threshold for classification based on spectral angle is modified, the probability of incorrect object detection may increases. The SAM algorithm is a linear model which does not work well when the classes are overlapped with each other. Hyperspectral images required a newer kind of data format to store the enormous number of bands and data associated with them. The proliferation of data formats was enormous, to an ex- tent, that with each new software and satellite sensor, a new format HDF5 (Hierarchical Data Format 5) is used for analysis.
2. Spectral Angular Mapper Algorithm
ISSN 2348 – 7968
Spectroscopy measures the radiant intensity and energy of the interaction between light and matter to determine its molecular structure. In absorption spectroscopy, the compound that interacts with light behaves as a passive element. It absorbs some of the emitted photons depending on their wavelength, to form the so-called spectral signature. Light which is not absorbed can be transmitted through the sample of the compound or diffusely reflected on it. Once the spectrum of the diffuse reflectance is obtained, it must be processed for the material identification, classification, or discrimination.
Reference
Spectral − Angle Band J
Pixel
Band K
Figure 1: Representation of Reference Angle.
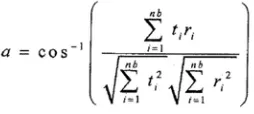
The SAM algorithm generalizes this geometric interpretation to n-dimensional space. SAM determines the similarity by applying the following equation:
Figure 2: Equation for calculating Spectral Angle
Here, nb: the number of bands in the image, t: pixel spectrum, r: reference spectrum and alpha: spectral angle.
3. Thematic Information Extraction -
Supervised Classification
Remotely sensed data may be analyzed to extract useful thematic information. This transforms the data into information. For example, themes may include land-cover, water bodies, and clouds. The classification may be performed using supervised, unsupervised and fuzzy set classification approaches.
In a supervised image classification, the identity and location of some of the land-cover types should be known beforehand through a combination of fieldwork, analysis of aerial photography, maps, and personal experience. The analyst attempts to locate sites in the remotely sensed data that represent homogeneous examples of these known land-cover types. These areas are commonly referred to as training sites because the spectral characteristics of these known areas are used to train the classification algorithm for eventual land-cover mapping of the remainder of the image. Multivariate statistical parameters such as means, standard deviations, and covariance matrices are calculated for each training site. Every pixel both inside and outside these training sites is then evaluated and assigned to the class where it has the highest likelihood of being a member. This is often referred to as hard classification because a pixel is assigned to only one class (e.g., forest), even though the sensor records the radiant flux from a mixture of biophysical materials, for example: 10% bare soil, 20% scrub shrub, 70% forest.
4. Experimentation
ISSN 2348 – 7968
4.1 Image Analysis
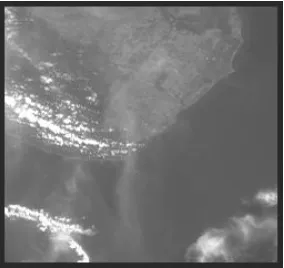
Sample images of random spectrum band 27 and 48 as in figure (3) and figure (4) on display for the experimental Hyperspectral image (HySI). The image helps to under- stand the differences visible with this various band of image spectrum and the necessity for having more number of bands. The Hyperspectral image experimented has 64 bands of spectrum images taken under visible and near infrared spectrum. These 64 bands of continuous image of a surface are stacked one after the other forming a 3-D cube of image for further analysis.
Figure 3: Band 27 of wavelength 639.6nm-656.4nm
Figure 4: Band 48 of wavelength 814.5nm-832.0nm
4.2 False color composite on Images
The False color composite on Images helps for better observation of image featured on the surface. Sample images of the false color composite is as shown in figure ( 6) and figure (7) with various combination of Red, Green and Blue color component of a pixel.
Figure 5: Depiction of 3-Dimensional Cube view
Figure 6: (Red, Green, Blue) = (57, 27, 16)
Figure 7: (Red, Green, Blue) = (20, 61, 56)
4.3 SAM Implementation on Image
ISSN 2348 – 7968
Figure 8: Clear Water
Figure 9: Dense Cloud
Figure 10: Dense Vegetation
Figure 11: Fallow Land
The rule images displayed as in figure (8) - Clear Water, figure (9) - Dense Cloud, figure (10)- Dense Vegetation and figure (11) - Fallow Land gives an idea of how closely the pixel of the image is related to each class. The darker the black color show more relevance to the defined class.
All the rule images of each defined class are cumulated into one colored image as shown in figure (12).
5. Results
The false colour composite of the original image is displayed to observe the differences with the bands easily. The 3-D cube is constructed by considering all the 64 bands of the image at a time. Image classification is per- formed by the application of SAM algorithm which is a supervised classification technique. The resultant of SAM implementation is a set of rule images and a colour composite image. The advantage of SAM is that it uses only the direction of the spectra, and not their length, and hence the method is insensitive to the unknown gain factor, and all possible illuminations are treated equally.
Pixels are grouped into the most relevant class. The pixels are said to be unclassified (represented by black) if it does not belong to any of the classes. All the pixels of the same class are represented by the same colour. The figure represents four classes- clear water, dense cloud, dense vegetation and fallow land, represented by RED, GREEN, BLUE and YELLOW respectively.
ISSN 2348 – 7968
References
[1] Xiaofang Liu and Chun Yang, a Kernel Spectral Angle Mapper Algorithm for Remote Sensing Image Classification, IEEE 2013.
[2] Paul L. M. Geladi, Hans F. Grahn and James E, Multivariate Images, Hyperspectral Imaging: Background and Equipment. [3] John R. Jensen, Introductory Digital Image Processing A
Remote Sensing Perspective Prentice Hall Series in Geographic Information Science, Second Edition.
[4] Joseph P. Hoffbeck and David A. Land- grebe, Classification of Remote sensing Images having High Spectral