117
Coping Mechanisms of Local People to Mitigate
Climate Change Impacts on Water Resources in
Kailali District-Nepal
Deepak Chaulagain, Parshu Ram RimalAbstract: The study was conducted in the Godawori Municipality of Karnali Province to document the coping practices of the local people on the climate change effects. Household surveys, key informant interviews and focus group discussions were used to document the people's perception on climate change impacts. Hydro-meteorological data on temperature, precipitation and water discharge in the river were received from the Department of Hydrology and Meteorology, which were further analyzed statistically. The mean annual temperature is increasing at a rate of 0.01910C/year and annual precipitation is increasing by 1.3513mm/year. However, the precipitation pattern is changing over the years with the notable increase of high precipitation, causing to increase the river water discharge and flood leading to the huge loss of properties including land, stored grains and lives of people. Lack of rainfall in the cropping season lead to excessive extraction of ground water for irrigation. The cost of ground water extraction is also high, which the small farmers can not afford and leave the land barren. The coping practices noted in region are constructing embankments; planted different plants like bamboo (Bambusa vulgaris), Sugarcane (Saccharum officinarum), Typha (Typha latifolia) etc.; storing grains in upper part of the house; extracting ground water for irrigation; changing crops (vegetables instead of paddy and wheat); changing the species of crops and increased use of fertilizers and pesticides.
Index Terms: Climate Change, Coping Practices, Flood, Precipitation, Temperature, Water Discharge
————————————————————
1 INTRODUCTION
The global climate is changing more rapidly in recent years (Vijaya et al., 2011). ISET-N (2009) reported that the average annual temperature of Nepal is likely to increase by 1.40C by 2030, 2.80C by 2060, and 4.70C by 2090. According to Sherestha et al. (1999), Nepal Himalaya is undergoing temperature rise more than the average in recent years, where the temperature increases 0.06°c to 0.12°c per year in most of the middle mountain and Himalayan regions, while the Siwalik and Terai regions indicates warming trends of less than 0.03°c per year from 1971-1994. Intra-annual variability of stream flow is prominent duet to frequent and extreme climate and weather events (Agrawala et al., 2003, Chaulagain, 2006). Additional uncertainty on the hydrological conditions are characterized to challenge further on water resource management. Assessment of the long term river hydrology with climate change impact on it has become imperative in recent years for sustainable water resources management (APN,2008).Climate change impact on water resources represented through considerable reserves of snow and glaciers as well as thousands of rivers and lakes. The effects of Climate change on water resources are being prominent in the form of flood, landslides, drought etc (ICIMOD 2009a). Local people use their traditional knowledge and capabilities to mitigate the impacts of climate change (Maharjan and Sigdel 2011). Some of the notable climate change mitigation measures practices in this area are: construction of sand embankments, stonewalls, and bamboo fences to control floods.
2 MATERIALS AND METHODS
2.1 Study Area
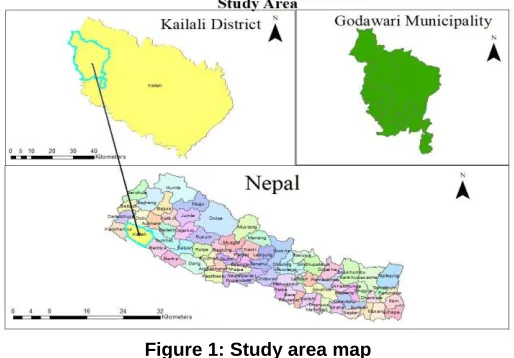
The study was carried out in Godawori Municipality of Kailali district in Far-Western Province of Nepal. 40% of this district lies within Churia range while remaining 60% is in Terai with the elevation ranging from 109m to 1950m above mean sea level with tropical climate in plains and sub-tropical in Siwalik range. The study area lies at an altitude of 109m above mean sea level. The average annual rainfall is 1840mm. Some of the
major rivers of the district are Karnali, Mohana, Khutiya and Godavari. The summer temperature ranges from 240 C to 430 C. While, the winter, temperature ranges from 50 C 190 C.
Figure 1: Study area map
3 METHODOLOGY
Stratified random sampling technique was used during questionnaire survey. The entire study area was clustered into four villages. Sample size was determined following the methodology proposed by Arkin and Colton (1963) and 72 Households were selected for a questionnaire survey. Large number of households was taken in Geta village because of high number of population and its marginal socio-economic and agricultural character and less influenced by the
————————————————
Deepak Chaulagain, College of Applied Sciences,
Tribhuvan University, Environmental Science,
Kathmandu, Nepal. Email:
Parshu Ram Rimal, Universityof Hohenheim, Agriculture
118 governmental and nongovernmental organizations on
development interventions. Information was gathered using structured questionnaires, physical observations, Key Informant Interview (KII), Focus Group Discussions (FGDs) followed by literature review. The data were received from the department of meteorology on precipitation, temperature and river discharge, which were statistically analyzed. The five year moving average method was used to find out the normal trend value for the unit of time falling at the middle of the period covered in the calculation of average.
4 RESULTS
4.1 Pattern and Trends of Climate Change 4.1.1 Change in Temperature
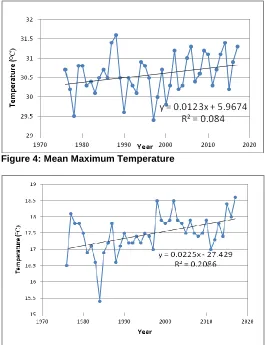
Fig. 2 reflects mean monthly temperature where, maximum monthly temperature reaches its peak value in May while lowest minimum temperature was recorded in January. Similarly, the highest and lowest mean temperature was also noted in June and January respectively. Fig. 3 illustrates that the annual mean temperature trend was increasing with the rate of 0.01910C per year. The temperature was above 240C from the year 1997 to 2017 except 1999, 2006 and 2007. Fig. 4 demonstrates that the mean maximum temperature was increased by 0.01230C annually and the temperature was fluctuating ranging from 29.40C to 31.60C over the study period. Similarly, average maximum temperature was always above 300C since 2001. Fig. 5 shows the trend of mean minimum temperature where, average minimum temperature was increasing in trend and was increased by 0.02250C per annum.
Figure 2: Mean Monthly Temperature
Figure 3: Annual Mean Temperature
Figure 4: Mean Maximum Temperature
Figure 5: Mean Minimum Temperature
4.1.2 Change in Precipitation Table 1: Change in Precipitation (mm/year)
Annual
Pre-Monsoon Monsoon Post-Monsoon Winter
1.3513 0.3671 3.2134 0.8446 0.0474
The precipitation in the area was in increasing trend. The mean annual precipitation was increasing by 1.3513mm/year. The monsoon precipitation was increasing at a greater rate i.e. 3.2134mm/year as compared to pre-monsoon (0.36mm/year) and post-monsoon (0.84 mm/year). The winter precipitation is increasing at the least rate of 0.0474mm/year.
4.2 People’s Perception on Climate Change
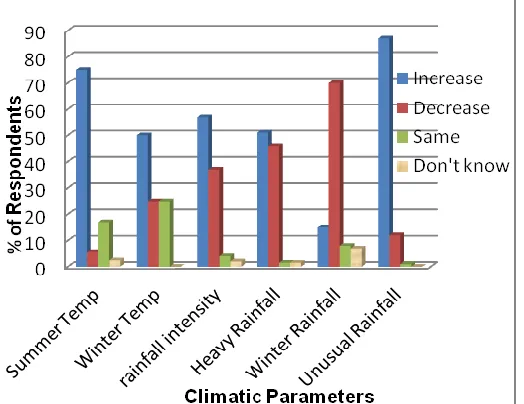
119 winter rainfall has decreased. The respondents reporting to
increase incidence of unusual rainfall account to 87%. During focus group discussion and key informants interview, participants reported that the rain doesn’t occur at the time of cropping season, the water holding capacity of soil is being poor leading to cause maximum discharge to the rivers causing to increase inundation.
Figure 6: People’s Perception on Change in Climatic Parameters.
4.3 Changes in Agricultural Production
About 41.7% of the respondents reported that the agricultural production has decreased while 38.9% told that it has increased. The reason for decrease of production were untimely and less rain, lack of sufficient irrigation, lack of sufficient fertilizer, lack of workforce, diseases, disasters and financial capacities of farmers to spend on crop cultivation measures. Use of ground water irrigation and chemical fertilizers was also noted to increase the crop production, but this was limited to the well-off category of farmers.
Due to less and untimely rainfall, the agricultural production has decreased as the plant dries up and doesn’t give grain as it has to. The participants claimed that due to less rainfall, the paddy field producing 50 kg of rice now gives only 35 kg. Variety of diseases occurrence have also increased in the paddy and wheat. New weed species are also seen in the paddy and wheat field, which were never seen before. About 70.8% of the respondents reported that the invasive weed species have increased. Ageratum houstonium is one of the weed species identified in the study area. These weeds have long roots and they are difficult to control. With the start of using ground water vegetable cultivation practices have been increasing. Respondents reported that they have not changed the cropping calendar. The people don’t wait for the rainfall, because the delay in cropping results to less or no production. Thus, they plant the crops in time with irrigation from the ground water. Most of them use ground water for irrigation but those who can’t afford the cost, wait for the rainwater. However, the yield they receive from their land is not enough for year round household food supply.
4.4 Change in Frequency of Disasters events
36 % respondents stated that the flood is increasing, while 52% said that it is decreasing. There were major flood events in 2003 AD and 2008 AD. The floods claimed huge loss of property and few lives. Some of the villagers became landless due to those floods. There was no early warning system for the flood in the area. Some people received disaster preparedness and response training.
Figure 7: People’s Perception on Change in Frequency of Flood.
Most of the people said increasing trend of frequency of drought. About 38.9% of the respondents think that the cause of the disasters is deforestation while 37.5% think that climatic variability is the reason behind it and 15.3% believe that global warming is leading to the disaster like flood.
Figure 8: People’s Perception on Change in Frequency of Drought.
4.5 Impacts on Water Resources
It was noted that there is no problem of water scarcity in the area as the ground water is sufficient with the usual notice of less ground water in dry season. The water level in the river has decreased, which however has not affected their livelihood.
4.6 Changes in Discharge in Mohana River
120 winter season but it is increasing for the monsoon and
Post-Monsoon.
Figure 9: Monsoon Maximum discharge
Figure 10: Post Monsoon Discharge
Figure 11: Pre Monsoon Discharge
Figure 12: Winter Monsoon Discharge
4.7 Coping strategies Adopted by People
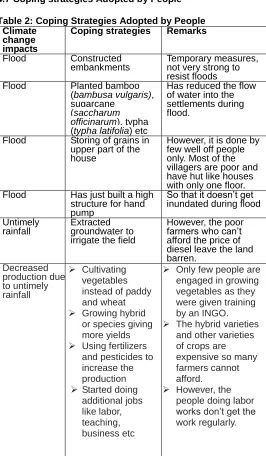
Table 2: Coping Strategies Adopted by People Climate
change impacts
Coping strategies Remarks
Flood Constructed embankments
Temporary measures, not very strong to resist floods Flood Planted bamboo
(bambusa vulgaris), sugarcane
(saccharum officinarum), typha (typha latifolia) etc
Has reduced the flow of water into the settlements during flood.
Flood Storing of grains in upper part of the house
However, it is done by few well off people only. Most of the villagers are poor and have hut like houses with only one floor. Flood Has just built a high
structure for hand pump
So that it doesn’t get inundated during flood Untimely
rainfall
Extracted groundwater to irrigate the field
However, the poor farmers who can’t afford the price of diesel leave the land barren.
Decreased production due to untimely rainfall
Cultivating
vegetables instead of paddy and wheat
Growing hybrid
or species giving more yields
Using fertilizers and pesticides to increase the production
Started doing additional jobs like labor, teaching, business etc
Only few people are
engaged in growing vegetables as they were given training by an INGO.
The hybrid varieties
and other varieties of crops are expensive so many farmers cannot afford.
However, the
people doing labor works don’t get the work regularly.
121 training, they can earn their living through it. Some villagers
have started planting hybrid varieties and new species of paddy that give more production. Farmers must be made aware about these varieties and government should give subsidies to the farmers to make them access of technology and seeds. Some of the villagers have constructed place to store their grains in upper part of their house to protect from the flood water. However, this is limited to some upper class people as small farmers do not have such building.
5 CONCLUSIONS
It was noted that the temperature and precipitation are both increasing in the study area. The average annual temperature is increasing by 0.01910 C per year and annual precipitation is increasing by 1.3513mm/year. Most of the local people are aware of noticeable climatic variability. According to them, both summer and winter temperature and rainfall pattern is increasing. However, unusual rainfall was detected and rain does not occur at the time when needed by the farmers for crop cultivation. The intensity of flood is also increased in the reason in the rainy season.
Farmers have not noticed the shortage of ground water in the study area. The ground water is continually recharged by the rivers flowing year round that pass through Bhabar and hence the changes in the local rain fall do not seem to affect ground water resource. The increase in river discharge however is depended on the rain fall as these small rivers originate from Chure and hence are flooded when rain fall increases. The increase in temperature has no impact on the water resources. However the temperature increase has increased the diseases and pests in the crops and it has decreased the production. The invasive weed species are also increasing. The infrequent and unusual rainfall and temperature has affected the crop production practices and crop yield To cope with flood and other impacts on agriculture and livelihoods, people have adapted a number of coping strategies like constructing embankments, planting Bamboo (Bambusa vulgaris), Sugarcane (Saccharum officinarum), Typha (Typha latifolia) etc, constructing high structure for hand pump, storing grains in the upper part of the house, extracting ground water for irrigating field, shifted to cultivate vegetables, and high yielding and resistant crop varieties. However, these coping strategies are not sufficient to cope with the impacts of climate change. Thus, Climate change not only increases the intensity and frequency of disaster events but also increases the cost of development activities.
6 REFERENCES
[1] VijayaVenkataRaman, Sanjairaj, Sanjairaj Iniyan, and Ranko Goic. "A review of climate change, mitigation and adaptation." Renewable and Sustainable Energy
Reviews 16.1 (2012): 878-897.
[2] Nepal Climate Vulnerability Study Team. "Vulnerability through the eyes of the vulnerable: climate change induced uncertainties and Nepal’s development predicaments." Institute for Social and Environmental Transition, Nepal (ISET-N), Kathmandu and Institute for Social and Environmental Transition (ISET), Boulder, Colorado (2009).
[3] Shrestha, A. B., Wake, C. P., Mayewski, P. A., & Dibb, J. E. (1999). Maximum temperature trends in the Himalaya and its vicinity: an analysis based on temperature records from Nepal for the period 1971–94. Journal of climate, 12(9), 2775-2786.
[4] Agrawala, Shardul, et al. Development and climate change in Nepal: Focus on water resources and
hydropower. Paris: Oecd, 2003.
[5] Chaulagain, Narayan Prasad. "Impacts of climate change on water resources of Nepal: The physical and socio-economic dimensions." IOP Conference Series: Earth and Environmental Science. Vol. 6. No. 29. IOP Publishing, 2009.
[6] Jintrawet, A., and S. Chinvanno. "Climate change in Southeast Asia and assessment on impact, vulnerability and adaptation on rice production and water resource." Asia-Pacific Network for Global Change
Research (APN), Kobe, Japan (2008): 10-21.
[7] ICIMOD (2009a): “Local Responses to Too Much and Too
Little Water in the Greater Himalayan Region. Hill Side Press: Kathmandu.”