Energy Efficient Cluster Head Selection In
Software Defined Networking Using
Improved Particle Swarm Optimization
S.Suganthi, Dr.D.Usha
Abstract:In real world applications internet of things becoming an important role. Most IoT applications are integrated with wireless sensor networks. Usually the wireless sensor networks in IoT require hundreds or thousands of sensors may be deployed and integrated. In this scenario management of networks is the biggest issue. To manage the larger network scenario software defined networking is an added advantage. It gives a promising solution for flexible management of data plane and control plane. Efficient transmission of data with minimum energy is the main goal. So dividing the nodes into multiple clusters and cluster head is needed for manage those clusters. To maximizing the lifetime of the network with minimum energy there is in need of energy efficient cluster head selection. We provide the optimality in cluster head selection by using particle swarm optimization. There are so many researchers are already done this work with PSO but the results are not up to the level. This paper demonstrated the updated PSO algorithm through modified and improved fitness function. The proposed algorithm is experimented in matlab and the results are evaluated to show their supremacy in term of alive nodes, energy expenditure, dead nodes and fitness value.
Index Terms: Sensor network, clustering algorithms, energy, cluster head, particle swarm optimization.
————————————————————
I.
INTRODUCTION
In recent years, the wireless sensor networks become a leading area of research. The device in sensor networks are denoted as sensor which has detect and respond some input from both physical as well as environmental conditions such as heat, pressure etc. the output of the sensor usually an electrical signal which is transmitted to a controller for further processing. For managing and maintaining larger networks the software defined networking is the biggest boon. In a software defined networking the networks are divided into control plane and data plane. Control plane is the centralized control which shapes the network traffic without touch the individual switches. Data plane can carry on the forwarding activity based on the flow table which is predesigned by the controller. So through SDN can get better security because of the controller can monitor traffic and deploy security policies and alsothe controller detects suspicious activity in network traffic, it can reroute or drop the packets. Sometimes the sensor nodes in unattended hostile region recharge of sensor battery is not possible. There are so many energy preserving approaches are available which is mainly focused to extend the network lifetime. To support scalability and lifetime of the network, nodes are often grouped in clusters having a leader, often referred as cluster head (CH). A CH is responsible for not only sending data to base station but also assist the general nodes to send sensed data to target nodes.
The energy consumption of CH is greater than general nodes. Cluster head is a node which is dependable for maintain cluster, collect data from nodes in the cluster and communicate with sink. By using clustering method it has been observed that there is huge quantity of energy that has been saved. Therefore CH selection will affect the lifetime of WSN. The paper proposes an approach for improving network lifetime by using Particle swarm optimization (PSO) in WSN. Particle Swarm Optimization (PSO) is an artificial intelligence technique which is motivated by the social activities of natural species, for instance - swarm of birds, etc. The rest of this paper is organized as follows: the network model and assumptions are briefly outlined in Section II. In Sections III proposed PSO algorithm the simulation results are discussed in section IV. Finally, a projection of future PSO applications in WSNs and concluding remarks are given in Section V.
II.
CLUSTER FORMATION
In this section initially we describe our network scenario. The SDN network is assumed to be a circular geographic region with the coordinates (X,Y) in which the control plane and data plane is separated. The sensor nodes are uniformly deployed in the data plane area dA. The controller console manages the policies of each node in a data plane which is denoted as cA. The initial energy of each node is 𝐸𝑜 = 200. Weight of a node w = 0.9 Cluster radius denoted as 𝐶𝑟 = 30 and sensing range is𝑆𝑟𝑎 = 36. Each node broadcasting the beaconmessage to all other neighboring nodes about theirpresence. The beacon message contains the node id, current region id, cluster membership status, radio range and velocity. If a node Nj receives a beacon message from node Ni, the region id and radio range is same then Nj add Ni to form as a cluster. Then the cluster information is automatically updated in node information table which is maintained by controller. The node information table comprises the ids of all nodes along with their reputation values. Initially _________________________________________
S.Suganthi, Dr.D.Usha Research Scholar, Assistant Professor2,
thereputation value of all the nodes is to some default value. The reputation value is based on the energy and distance among the clustering nodes which is calculated by using non linear programming. If the reputation value R v falls below the threshold then the corresponding node will automatically search other node in another cluster in its neighborhood.
Algorithm 1: Cluster Formation Algorithm
Coordinates: (X, Y), N - Set of all sensor nodes, Cp : Control Plane, Dp : Data Plan e, Cid : Clus ter id,
Bm : Beacon Message, NIF : Node Information
Table, E0 : Energy of node,
W : Weight Cr : Cluster radius, Rra : Radio range, Sra : Sensing range, V : Velocity,
Rid : Region id, Rv : Reputation value, dij : the distance from sensor node i ɛ N to
sensor node, fi : the distance from sensor node i ɛ
N to the Base station BS,
bi : the battery level of sensor node i<n
1. N ← 100 ;
2. Bm ← {Nid, Rid,Cluster Staus,Rra,V} 3. If (Rid(Ni) = Rid(Nj) & Rra(Ni) = Rra(Nj)) then
4. Cid ← { (Ni,Nj) } 5. Update Cid information to Cp
6. Cid (NIF) ← { Nid, Rv} 7. Rv ← (Avg{Energy} & Avg{distance}) Reputation value calculated by non linear programming 8. Rra={1{ 𝑖𝑓𝑎𝑛𝑜𝑑𝑒𝑖𝑎𝑛𝑑𝑛𝑜𝑑𝑒𝑗𝑖𝑠𝑢𝑛𝑑𝑒𝑟𝑙𝑦𝑖𝑛𝑔 specified radio range ∀ i
, j; 1 ≤ i ≤ N, 1 ≤ j ≤ M, 0 otherwise }
𝑁𝑀
∑ ∑𝑗=1(𝐸𝑖𝑅𝑟𝑎)
9. Average Energy(Cid) ← 𝑖=1
∑𝑁,𝑀 Eij(Cid) 𝑖=1,𝑗=1
10. Distance dij ← √(xj − xi)2 + (yj − yi)2
𝑁 𝑀
∑ ∑ (𝑑𝑖𝑗𝑅𝑟𝑎)
𝑗=1 11.Average Distance(Cid) ← 𝑖=1
∑𝑁,𝑀 Dij(Cid) 𝑖=1,𝑗=1
12.if(Avg(dij )(Cid)<T or (Avg(ECid))<T 13.search again all the nodes in corresponding cluster id to find
another neighborhood node to form a cluster
III.
CLUSTER HEAD SELECTION USING
PARTICLE SWARM OPTIMIZER
representing the ith particle Pi of the population is as follows:
PSO algorithm is a global optimization algorithm (PSO)based on natural population search strategy, it has advantages of being easy to carry out,less parameters, fast search speed, etc.and is widely used in scientific research and practical engineering. To optimize the performance of particle swarm algorithm, this paper respectively improve 4 aspects, speed, inertia weight, learning strategy and variability, to improve search precision and stability of the algorithm. Particle Swarm can be specifically described as follows: For prolong a lifetime of a network the cluster head selection is very important because of while receiving and aggregating the information the leader node is crucial one. Thus the cluster head election algorithm has an important role for energy conservation of a sensor node. In order to improve the optimality for electing the cluster head we use
the Particle Swarm Optimization (PSO) algorithm. In
conventional PSO algorithm, particles in the swarm update their position relative to the position and velocity of the group. The notation for
Pi = [ Xi1,Xi2,Xi3……XiD]
Each particle’s position is evaluated using a fitness function which judges the quality of the solution provided in that iteration. The velocity and position of each particle in each iteration Vid and Xid are updated as follows:
𝑖→1 𝑡𝑜 𝑁𝑃
IV.
PROPOSED PSO ALGORITHM
The input hypotheses are plotted in X and Y coordinates and seeded with an energy, weight, cluster radius, sensing range and velocity. Particles move through the solution space and evaluated some fitness function. In every iteration each particle updated two best values such that pbest and gbest. Each time calculate the current position and velocity. The current position of node assigned as Pbest. Theinitial utility function as assigned as 𝑈𝑢𝑡𝑖𝑙𝑖𝑡𝑦 = [𝑣1 𝑣2].
TABLE-I : Initial PSO Parameters
PARAMETER
V A L U E
No.of Particles 100
Inertia weight 0.9 to 0.4 (linear decreasing)
Max.velocity 50
Learning factors C1=c2=2 Maximum iteration 300 RE0/ED0* Cn
Definition 1(Weight) : Let W be the weight of a sensor node, Wmax and Wmin are the maximum and minimum weights of a sensor node. Weight W can
𝑀𝑖𝑛
𝑖𝑑
(𝑘) = lim 𝑘→1 𝑡𝑜 𝑁𝑃
{ 𝑖𝑓 𝐷𝑖(𝑘) < 𝑆𝑟𝑎𝑛𝑔𝑒 0 𝑒𝑙𝑠𝑒
act as a role of balancing local and global search it can be positive constant or positive linear. an inertia weight are
linearly reduced to search proceeds from 0.9 to 0.4. Definition 2(Sensing range): Let SR be the sensing range of a sensor node which is computed based on the distance between sensor deployment point and the particle. Which is assigned as SR=36, SR= ∀ R ∀ i ( Max(distance( SR, Pi)), SR denoted as sensor deployment point, R is the region, Pi denoted as the
Definition 5 (Energy) : The initial energy of node as 200 jules. The average energy of sensor nodes can calculated as
(RE0/ED0 ∗ ) /𝐶𝑛
𝐸0
Definition 6 (Length) The length is calculated by finding the number of arguments of minimum id that is mentioned as length of the live sensor nodes.
Arg(minid)
Calculation of fitness function
particle.
𝐹𝑎𝑐1 = 1 ∑ 𝐷𝑖𝑠𝑡
𝐶𝑛
Definition 3(Distance): The estimated distance between the sensor nodes Xi1,Xi2,Xi3……XiD and
// factor 1 depending upon distance between the node
(𝐸0∗ ) /𝐶𝑛
neighbouring nodes Yi1,Yi2,Yi3……YiD. The method 𝐹𝑎𝑐2 =
𝐸0
for calculating distance between nodes are follows : dij ← √(xj − xi)2 + (yj − yi)2
Definition 4(Index Count): In WSN, the sensor
node distances below from the sensing range that node added into index count. If Cn is zero discard that particular index.
Algorithm 2: PSO Algorithm //factor 2 depending upon the energy
𝐹𝑎𝑐3 = arg (𝑀𝑖 )
//factor 3 depending upon the arguments count of 𝑀𝑖𝑛𝑖𝑑
// finding best position by using above 3 factor
𝐵𝑝𝑟𝑒𝑏𝑒𝑠𝑡𝑝𝑜𝑠 = lim 𝛼1 𝐹𝑎𝑐1𝑖 + 𝛼12𝐹𝑎𝑐2𝑖 + 𝛼3 𝐹𝑎𝑐3𝑖
1. Input: 𝑁𝑜𝑟𝑛𝑜𝑑𝑒 // Node location (x, y) coordinates
2. Output: CH, CM // Computing Cluster Head and Cluster member 3. 1.Initialize the required PSO parameters
𝑖→1 𝑡𝑜 𝑁𝑃 5. 𝑊 = 0.9 // Inertia weight 6. 𝐶𝑟𝑎𝑑 = 30 // Cluster radius
7. 𝑆𝑟𝑎 = 36 // sensing range 8. 𝑤1, 𝑤2, 𝑣1, 𝑣2 → 𝑖𝑛𝑖𝑡𝑖𝑎𝑙𝑖𝑧𝑒 𝑟𝑎𝑛𝑑𝑜𝑚𝑙𝑦
9. 𝑁𝑜𝑑𝑒 𝑝𝑜𝑠𝑖𝑡𝑖𝑜𝑛 = 𝑁𝑜𝑟𝑛𝑜𝑑𝑒 10. 𝑃𝑏𝑒𝑠𝑡 = 𝑁𝑜𝑑𝑒 𝑝𝑜𝑠𝑖𝑡𝑖𝑜𝑛 11. 𝑃𝑝𝑟𝑒𝑣_𝑏𝑒𝑠𝑡 = 𝑃𝑏𝑒𝑠𝑡 12. 𝑈𝑢𝑡𝑖𝑙𝑖𝑡𝑦
= [𝑣1 𝑣2] //initial 𝑀𝑖𝑛 𝑖𝑑
(𝑘) = lim 𝑖→1 𝑡𝑜 𝑁𝑃 lim 𝑘→1 𝑡𝑜 𝑁𝑃
{ 𝑖𝑓 𝐷𝑖(𝑘) < 𝑆𝑟𝑎𝑛𝑔𝑒 0 𝑒𝑙𝑠𝑒
13. 𝑃1 → initialize the ith position 14. 𝑉1 → initialize the ith velocity 15. // fitness function
16. 𝛼1 = 0.5; 𝛼2 = 0.2; 𝛼3 = 1 − 𝛼1 − 𝛼2;
17. Where 𝐷(𝑘) = √ (𝑃1 − 𝑁𝑜𝑑𝑒 𝑝𝑜𝑠𝑖𝑡𝑖𝑜𝑛)2 NP→ Node position
18. If 𝑀𝑖𝑛𝑖𝑑 index is zero discard that particular index 19. 𝐶𝑛−> Calculate the 𝑀𝑖𝑛𝑖𝑑 index count
20. 𝐹𝑎𝑐1
= 1 ∑ 𝐷𝑖𝑠𝑡 // factor 1 depending upon distance between the node 𝐶𝑛
21. 𝐹𝑎𝑐2
= (𝐸0∗ ) /𝐶𝑛 𝐸0
//factor 2 depending upon the energy
22. 𝐹𝑎𝑐3 = arg (𝑀𝑖𝑛𝑖𝑑 ) //factor 3 depending upon the arguments count of 𝑀𝑖𝑛𝑖𝑑 23. // finding best position by using above 3 factor
24. 𝐵𝑝𝑟𝑒𝑏𝑒𝑠𝑡 = lim 𝛼1 𝐹𝑎𝑐1𝑖 + 𝛼12𝐹𝑎𝑐2𝑖 + 𝛼3 𝐹𝑎𝑐3𝑖 25. 𝐶𝑝𝑟𝑒𝑣_𝑏𝑒𝑠𝑡_𝑝𝑜𝑠 = 𝐵𝑝𝑟𝑒𝑏𝑒𝑠𝑡;
26. 𝑈𝑝𝑏𝑒𝑠𝑡_𝑝𝑜𝑠 → finding maximum position from 𝑃𝑝𝑟𝑒_𝑏𝑒𝑠𝑡_𝑝𝑜𝑠
27. 𝑈𝑢𝑡𝑖𝑙𝑖𝑡𝑦 = 𝑊 𝑈𝑢𝑡𝑖𝑙𝑖𝑡𝑦 + 𝑤1(𝑃𝑝𝑟𝑒𝑣_𝑏𝑒𝑠𝑡 − 𝑃𝑏𝑒𝑠𝑡 ) + 𝑤2(𝑃𝑝𝑟𝑒𝑣_𝑏𝑒𝑠𝑡 − 𝑃𝑏𝑒𝑠𝑡 ) 28. // calculate the velocity of particle with position
29. 𝑃𝑏𝑒𝑠𝑡 = 𝑠𝑡 + 𝑈𝑢𝑡𝑖𝑙𝑖𝑡𝑦 // update the position with updated velocity 30. While (p< number of nodes) 31.
p=p+1;
32. Find the 𝐵𝑝𝑟𝑒𝑏𝑒𝑠𝑡𝑝𝑜𝑠
33. If (𝐵𝑝𝑟𝑒𝑏𝑒𝑠𝑡𝑝𝑜𝑠 > 𝐶𝑝𝑟𝑒𝑣𝑏𝑒𝑠𝑡)
34. 𝐶𝑝𝑟𝑒𝑣_𝑏𝑒𝑠𝑡_𝑝𝑜𝑠 = 𝐵𝑝𝑟𝑒𝑏𝑒𝑠𝑡𝑝𝑜𝑠
35. 𝑃𝑝𝑟𝑒𝑣_𝑏𝑒𝑠𝑡 = 𝑃𝑏𝑒𝑠𝑡 36. 𝑒𝑛𝑑 𝑖𝑓
37. 𝐶𝑝𝑟𝑒𝑣_𝑏𝑒𝑠𝑡_𝑝𝑜𝑠 = 𝐵𝑝𝑟𝑒𝑏𝑒𝑠𝑡;
38. 𝑈𝑝𝑏𝑒𝑠𝑡_𝑝𝑜𝑠 → Finding maximum position from 𝑃𝑝𝑟𝑒_𝑏𝑒𝑠𝑡_𝑝𝑜𝑠
V.
SIMULATION AND ANALYSIS
In this paper, we use MATLAB to simulate the algorithm, and compare it with traditional particle swarm optimization. In the simulation, the nodes are deployed in the area of 100m × 100m, which is also the searching area of the particle swarm optimization algorithm. Figure 1. Illustrates that 100 nodes are deployed in X and Y coordinates which is divided into data plane and control plane. Fig.2 illustrates that the cluster are formed using algorithm 1.
Fig.1. Nodes deployed in data plane
Fig.2 Cluster formation
Figure.3 shows the Dead nodes in the Network with respect to the number of nodes. Initially there are 100 nodes. The above figure shows the death node count with respect to the number of nodes increased using Particle Swarm Optimization (PSO).
Fig.3 Number of Nodes vs Dead Node
Figure.4 shows the Alive nodes in the Network with respect to the number of nodes. Initially there are 100 nodes. The above figure shows the alive node count with respect to the number of nodes increased using Particle Swarm Optimization (PSO).
Fig.4 Number of nodes vs Alive node
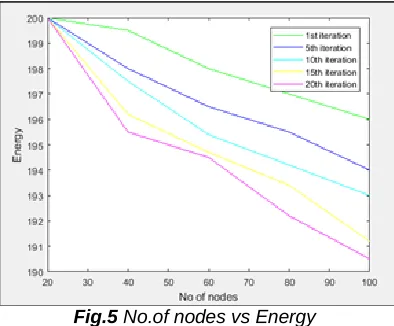
Figure 5. shows the Residual Energy of the Network with respect to the number of nodes in iteration wise. The Initial Energy of the nodes are 0.5J and there are 100 nodes. It is observed that nodes life time was increased by using the Particle Swarm Optimization Algorithm.
Fig.5 No.of nodes vs Energy
Figure 6. shows cluster head versus fitness value according to the modified PSO fitness function.
VI.
CONCLUSION
In this paper, we use non linear programming for cluster formation in SDN network is described. Then an energy efficient clustering scheme for WSN with PSO approach is presented. In the presented algorithm, the energy consumption of CHs is significantly balanced to improve the network lifetime. The presented algorithm is based on derivation of efficient particle encoding method and fitness function derivation. We have carried out thorough simulation. Simulation results clearly states that proposed PSO algorithm excels the existing algorithms.
VII. REFERENCES
[1] Chatterjee A., Siarry P. (2016). Nonlinear inertia weight variation for dynamic adaptation in particle swarm optimization. Computers and Operations Research, 33(3), 859-871.
[2] Chen M.Y., Zhang C.Y., Luo C.Y. (2015). Adaptive evolutionary multi-objective particle swarm optimization algorithm, Control and Decision, 24(12), 1851-1855.
[3] J. Kennedy and R. Eberhart. Swarm Intelligence. Morgan Kaufmann Publishers, Inc., San Francisco, CA, 2001.
[4] M. Jacqueline and C. Richard, Application of particle swarm to multiobjective optimization, Auburn: Auburn University, 1999.
[5] Alfi and H. Modares, ―System identification and control using adaptive particle swarm optimization,‖ Applied Mathematical Modelling, vol. 35, no. 3, pp. 1210–1221, 2011.
[6] L. Li and Y. Du, ―Application of Modified Particle Swarm Optimization in Node Locating of Wireless Sensors Networks‖, Computer Applications and Software, vol. 31, no. 4, (2014), pp. 69-72.
[7] Y. Wang and J. Yang, ―Localization in wireless sensor network based on improved particle swarm optimization algorithm‖, Computer Engineering and Applications, vol. 50, no. 18, (2014), pp. 99-102.
[8] Zungeru, Murtala A, Ang L, Seng KP. Classical and swarm based routing protocols for wireless sensor networks: a survey and comparison. Journal of Network and Computer Applications. 2012 Sep; 5(35):1508–36.
[9] Sundaran K, Ganapathy V. Energy efficient wireless sensor networks using dual cluster head with sleep/active mechanism. Indian Journal of Science and Technology. 2016 Nov; 9(41):1–6.