Therapeutics and Clinical Risk Management
Dove
press
O R i g i n a l R e s e a R C h
open access to scientific and medical research
Open access Full Text article
Clinical analysis of contributors to the delayed
gallbladder opacification following the use of
water-soluble contrast medium
Ming-Chang Ku1,2
Victor C Kok3,4
Ming-Yung lee5
soa-Min hsu1
Pei-Yu lee1
Che-Wei Chang1
Yeu-sheng Tyan6
Chi-Wen Juan7,8
1Department of Radiology, Kuang Tien general hospital, Taichung, 2Department of nursing, Jen-Teh Junior College of Medicine, nursing and Management, Miaoli, 3Department of internal Medicine, Division of Medical Oncology, Kuang Tien general hospital, 4Department of Bioinformatics and Medical engineering, asia University, 5Department of statistics and informatics science, Providence University, 6Department of Medical imaging, Chung shan Medical University hospital, 7Department of emergency Medicine, Kuang Tien general hospital, 8Department of nursing, hungKuang University, Taichung, Taiwan
Objectives: Gallbladder opacification (GBO) on computed tomography (CT) imaging may obscure certain pathological or emergent conditions in the gallbladder, such as neoplasms, stones, and hemorrhagic cholecystitis. This study aimed to investigate the clinical contributing factors that could predict the presence of delayed GBO determined by CT.
Methods: This study retrospectively evaluated 243 consecutive patients who received enhanced CT or intravenous pyelography imaging and then underwent abdominal CT imaging within 5 days. According to the interval between imaging, the patients were divided into group A (1 day), group B (2 or 3 days), and group C (4 or 5 days). Three radiologists evaluated CT images to determine GBO. Fisher’s exact test and multivariate backward stepwise elimination logistic regression were performed.
Results: Positive GBO was significantly associated with the interval between imaging studies, contrast type, contrast volume, renal function, and hypertransaminasemia (P,0.05). Multivariate backward stepwise elimination logistic regression analysis of the three groups identified contrast type and hypertransaminasemia as independent predictors of GBO in group B patients (odds ratio [OR], 13.52, 95% confidence interval [CI], 1.72–106.38 and OR, 3.43, 95% CI, 1.31–8.98, respectively; P,0.05). Hypertransaminasemia was the only independent predictor of GBO in group C patients with an OR of 7.2 (95% CI, 1.62–31.73). Hypertransaminasemia was noted in three patients (100%) who initially underwent imaging 5 days prior to GBO.
Conclusion: Delayed GBO on CT imaging may be associated with laboratory hypertransami-nasemia, particularly in patients receiving contrast medium over a period of $4 days. A detailed clinical history, physical examination, and further workup are of paramount importance for investigating the underlying cause behind the hypertransaminasemia.
Keywords: logistic regression, hemorrhagic cholecystitis, vicarious contrast medium excretion, computed tomography, hypertransaminasemia
Introduction
The excretion of water-soluble contrast medium via the kidneys is a well-known phenomenon. Vicarious contrast medium excretion (VCME) refers to the excretion of water-soluble contrast medium through a route other than renal secretion. VCME is pre-dominantly mediated by the biliary system but may also occur in the small intestine1 and stomach.2 In 1957, two cases of water-soluble contrast medium secretion by the gallblad-der were reported by Arendt and Zgoda.3 Later, Shea and Pfister4 hypothesized that the gallbladder represented an alternate excretory pathway of urographic contrast medium.
Gallbladder opacification (GBO) is present when a radiograph or a computed tomog-raphy (CT) scan demonstrates complete or rarely partial opacification (hyperdensity or Correspondence: Victor C Kok
Division of Medical Oncology, Department of internal Medicine, Kuang Tien general hospital, 117 shatien Road, shalu District, Taichung 43303, Taiwan Tel +886 4 2662 5111
email [email protected] Chi-Wen Juan
Department of emergency Medicine, Kuang Tien general hospital, 117 shatien Road, shalu District, Taichung 43303, Taiwan
Tel +886 4 2662 5111
email [email protected]
Journal name: Therapeutics and Clinical Risk Management Article Designation: Original Research
Year: 2016 Volume: 12
Running head verso: Ku et al
Running head recto: Clinical analysis of contributors to delayed GBO DOI: http://dx.doi.org/10.2147/TCRM.S116899
Therapeutics and Clinical Risk Management downloaded from https://www.dovepress.com/ by 118.70.13.36 on 27-Aug-2020
For personal use only.
Number of times this article has been viewed
This article was published in the following Dove Press journal: Therapeutics and Clinical Risk Management
Dovepress
Ku et al
hyperattenuation) of the entire gallbladder cavity. In the past, clinicians believed that factors promoting the heterotopic (vicar-ious) biliary excretion of radiocontrast media (RCM) included prolonged recirculation of the RCM because of impaired renal function, high doses of iodinated contrast agents for urography, gallbladder stasis, and increased protein binding of RCM in the presence of uremic acidosis.1 GBO on CT imaging may obscure certain pathological or emergent conditions in the gallbladder, such as neoplasms, stones, and hemorrhagic cholecystitis.
A series of studies in the 1980s reported GBO following contrast medium injection as a normal finding in patients with normal renal function.5–8 In another study, Yamazaki et al9 demonstrated a higher incidence of GBO within 1 day in patients with increased serum creatinine levels.
According to previous studies, GBO does not necessarily imply impaired renal function. The liver is instrumental in maintaining enterohepatic circulation of bile salts.10 Bile is a complex aqueous secretion that originates from hepatocytes at the level of the bile canaliculi11,12 and is modified distally by absorptive and secretary transport systems in the bile duct epithelium. Next, bile flows toward the interlobular septa, where the canaliculi empty into terminal bile ducts and then into progressively larger ducts before finally reaching the common bile duct. Bile either empties directly into the duodenum or is diverted to the gallbladder where it is con-centrated.11 Water and small solutes passively enter the biliary space via solvent drag.12 This process requires energy in the form of ATP and is not affected by hydrostatic pressure from the blood perfusing the hepatic sinusoids.12,13 As hepatocyte injury interferes with bile formation, this retrospective study aimed to examine if hepatic hypertransaminasemia would be an independent predictor among other clinical factors for the occurrence of delayed GBO.
Methods
Patients
This retrospective study was approved by the institutional review board of Kuang Tien General Hospital, and the require-ment for written informed consent was waived. In total, 323 consecutive patients aged .18 years who had ever received enhanced CT or intravenous pyelography (IVP) imaging studies at our institution and then undergone abdominal CT images for any reason within 5 days between January 2010 and June 2015 were included in this study. The following patient and clinical information were recorded: sex, age, GBO on CT imaging, interval between the two imaging modalities, contrast type, contrast amount, and laboratory data, including creatinine and aspartate aminotransferase/
alanine aminotransferase (AST/ALT). Exclusion criteria were beam hardening artifacts from metal or bone (n=10), history of cholecystectomy (n=32), lack of creatinine or AST/ALT value within 7 days of the first imaging study (n=34), receiving another contrast study (n=4), including endovascular aneu-rysm repair (n=1), transarterial embolization (n=1), percutane-ous transhepatic cholangiodrainage (n=1), and percutaneous transhepatic gallbladder drainage (n=1). In total, 243 patients (164 males and 79 females; mean age, 70.0±16.6 years; range, 18–93 years) were enrolled into the present study.
According to the interval between the two imaging stud-ies, 243 patients were divided into three groups (Figure 1) as follows:
(1) Group A (n=38) included patients who received enhanced CT or IVP imaging and then underwent abdominal CT images 1 day later.
(2) Group B (n=118) included patients who received enhanced CT or IVP imaging and then underwent abdominal CT images 2 or 3 days later.
(3) Group C (n=87) included patients who received enhanced CT or IVP imaging and then underwent abdominal CT images 4 or 5 days later.
iVP and enhanced CT examinations
Because of the retrospective nature of the present study, all patients underwent enhanced CT imaging in different posi-tions. All patients received enhanced CT imaging according to the routine protocols of our hospital and underwent imag-ing with a 64-detector row CT scanner (Somatom Sensation 64; Siemens Medical Solutions, Forchheim, Germany, and Aquilion 64; Toshiba Medical Systems, Tokyo, Japan). All patients received IVP examination according to the routine protocol of our hospital.
Subsequent abdominal CT scanning to detect GBO was performed using two 64-detector row CT machines. One was Aquilion 64 manufactured with a detector collimation of 0.5 mm ×64 rows, a slice thickness of 5 mm, a pitch of 0.828, 0.5-second tube rotation time, and 120 kVp. Another 64-detector row CT scanner was Somatom Sensation 64 made with a detector collimation of 0.5 mm ×64 rows, a slice thick-ness of 5 mm, a pitch of 1.25, 0.5-second tube rotation time, and 120 kVp. Tube current time is regulated by automatic exposure control in the two different CT machines.
Contrast medium type and volume
Iodinated contrast media have four types, namely, ionic monomer, ionic dimer, nonionic monomer (second-generation RCM), and nonionic dimer (third-generation RCM), according
Therapeutics and Clinical Risk Management downloaded from https://www.dovepress.com/ by 118.70.13.36 on 27-Aug-2020
Dovepress Clinical analysis of contributors to delayed gBO
to the size and number of organic molecules binding the iodine. The ionic monomeric contrast medium has become a historical agent, which is hyperosmolal with osmolality .1,400 mosm/kg. Most of the institutions including our hospital have adopted the nonionic low-osmolal contrast media, which has an osmolality of 500–850 mosm/kg. The higher the osmolality of the contrast media, the greater the urine output in the first few hours fol-lowing their administration.14
Two nonionic and low-osmolar iodinated contrast media were used for CT and IVP at our hospital over the past 6 years. Iopamidol (Iopamiro-370; Bracco, Milan, Italy) was used in 50 patients, and iobitridol (Xenetix-350; Guerbet, Paris, France) was used in the remaining 193 patients. The standard dose of intravenous contrast medium was 100 mL for enhanced chest/abdomen/pelvic CT imaging and 50 mL for brain and neck CT imaging. Patients with serum creatinine levels .2 mg/dL were given hydration and closely followed up with hemodialysis arranged, if required.
The standard dose of intravenous contrast medium for IVP was 50 mL.
Biochemical examination
Serum values of creatinine were arbitrarily defined as refer-ences for renal function. Using the medical record database
of our hospital, laboratory data closest in time to the first contrast-enhanced examination (enhanced CT or IVP) were extracted. Data from .7 days before the first contrast-enhanced examination were not used. As the normal range of creatinine and AST/ALT has mildly varied over the past few years at our hospital, impaired renal function was defined as value of creatinine above the normal range and hypertransaminasemia as any value of AST/ALT above the normal range.
CT evaluation of gBO
CT images were retrospectively analyzed using a picture and archiving and communication system (EBM Technologies, Taipei, Taiwan). Region of interest (ROI) measurements were drawn within the gallbladder on axial noncontrast CT images. GBO was defined as the presence of any of the fol-lowing: an ROI value of .50 HU (Figure 2A) and the ROI values of 30 HU greater than the initial noncontrast CT imaging (Figure 2B and C). The presence of gallstones was confirmed by comparing recent images with other noncon-trast CT images (Figure 2B). Two radiologists with 4 years and 5 years of experience blinded to patient demographics analyzed all noncontrast CT images. A third independent radiologist with 28 years of experience served as a tiebreaker
Figure 1 Flow chart of 243 patients with gallbladder opacification assessed using abdominal CT images.
Abbreviations: asT/alT, aspartate aminotransferase/alanine aminotransferase; CT, computed tomography; iVP, intravenous pyelography; PTCD, percutaneous transhepatic cholangiodrainage; PTgBD, percutaneous transhepatic gallbladder drainage.
3DWLHQWVZKRKDGHYHUUHFHLYHGFRQWUDVW&7,93VWXG\DQGKDGDQ DEGRPHQ&7ZLWKLQGD\VDIWHUQ
3DWLHQWVLQFOXGHGIRUDQDO\VLVQ
*URXS$Q 3RVWILUVWLPDJH VWXG\GD\
*URXS%Q 3RVWILUVWLPDJH VWXG\GD\VDQG
*URXS&Q 3RVWILUVWLPDJH VWXG\GD\VDQG
([FOXGHGQ
%HDPKDUGHULQJDUWLIDFWVQ 3DWLHQWVZKRODFNHGJDOOEODGHUQ
3DWLHQWVZKRODFNHGFUHDWLQLQHRU$67$/7ZLWKLQ GD\VQ
3DWLHQWVZKRUHFHLYHGRWKHUFRQWUDVWVWXG\Q 7UDQVDUWHULDOHPEROL]DWLRQQ
(QGRYDVFXODUDQHXU\VPUHSDLUQ 37&'Q
37*%'Q
Therapeutics and Clinical Risk Management downloaded from https://www.dovepress.com/ by 118.70.13.36 on 27-Aug-2020
Dovepress
Ku et al
if consensus between the other two radiologists could not be reached.
GBO identified in group A was defined as early opaci-fication, and those in groups B and C were defined as early delayed opacification and late delayed opacification, respectively.
statistical analyses
A retrospective database was created containing the data of 243 patients, with seven variables extracted for outcome anal-ysis. Quantitative variables were expressed as mean ± SD, and categorical variables were expressed as counts and proportions. Fisher’s exact test was used to compare patient demographics, contrast administration, and clinical profiles for univariate analysis.
Multivariate backward stepwise elimination logistic regression was used to evaluate the relationship between all variables and the probability of GBO in the three groups. The included independent variables (with reference values) were as follows: patient sex (reference = male), patient age in years (reference =18–64 years), serum creatinine (reference =
within normal range), AST/ALT value (reference = within normal range), contrast type (reference = Iopamidol), and contrast volume (reference =50 mL).
For patients with positive GBO, Fisher’s exact test was applied to assess the statistical significance of the observed incidence rate of impaired liver and renal function in each subgroup.
Statistical analyses were performed using a commercially available computer software program (SPSS 20.0 for Win-dows; IBM Corporation, Armonk, NY, USA). P,0.05 was considered statistically significant.
Results
Patient demographics are shown in Table 1. Fisher’s exact test revealed that positive GBO was significantly associated with the interval between imaging studies, contrast type, contrast volume, renal function, and hypertransaminasemia (P,0.05). No significant difference in mean age or sex distri-bution was observed between the positive and negative GBO
Figure 2 (A) A 46-year-old woman underwent two sessions of CT imaging 2 days apart for rectal cancer. Obvious gallbladder opacification (ROI was 213 HU) was noted on secondary abdominal CT imaging. (B and C) another 87-year-old man received two sessions of abdominal CT imaging within 3 days for small bowel obstruction. (B) initial abdominal CT imaging demonstrated a number of gallstones, and the ROi within gallbladder was found to have a radiodensity of 12 hU. (C) secondary abdominal CT imaging demonstrated that the radiodensity of the ROi within gallbladder was 74 hU. The presence of gallstones was detected by CT.
Abbreviations: ave, average; CT, computed tomography; ROi, region of interest.
$UHD FP
$YHYDOXH+8 $UHD FP
$YHYDOXH+8 $UHD FP
$YHYDOXH+8
$
%
&
Table 1 Clinical features according to the result of gBO
Clinical feature
GBO present (n=57)
GBO absent
(n=186) P-value
sex 0.087
Male 38 (66.7) 126 (67.7)
Female 19 (33.3) 60 (32.3)
age (years) 58.1±18.0 61.9±16.1 0.135
Contrast type 0.031
iopamiro 7 (12.3) 49 (26.3) Xenetix 50 (87.7) 137 (73.7) Contrast
volume (ml)
0.028
50 14 (24.6) 76 (40.9)
100 43 (75.4) 110 (59.1)
Creatinine 0.027
normal 44 (77.2) 166 (89.2) elevated 13 (22.8) 20 (10.8)
asT/alT 0.003
normal 33 (57.9) 146 (78.5) elevated 24 (42.1) 40 (21.5) interval of days
1 22 (38.6) 16 (8.6)
92 (49.5)
,0.0001
78 (41.9) 0.0314,0.0001*
2–3 26 (45.6)
4–5 9 (15.8)
Notes: Data are presented as number of patients with each clinical feature, with percentages in parentheses, or as mean ± sD with range where appropriate. *logistic regression.
Abbreviations: asT/alT, aspartate aminotransferase/alanine aminotransferase; GBO, gallbladder opacification; SD, standard deviation.
Therapeutics and Clinical Risk Management downloaded from https://www.dovepress.com/ by 118.70.13.36 on 27-Aug-2020
Dovepress Clinical analysis of contributors to delayed gBO
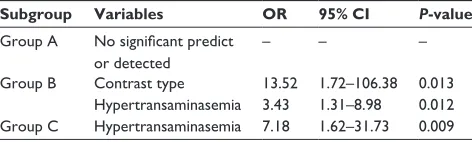
patients were contrast type and hypertransaminasemia with the odds ratios (OR) of 13.52 (95% confidence interval [CI], 1.72–106.38) and 3.43 (95% CI, 1.31–8.98), respectively. Hypertransaminasemia was the only independent predictor of GBO in group C patients with an OR of 7.18 (95% CI, 1.62–31.73).
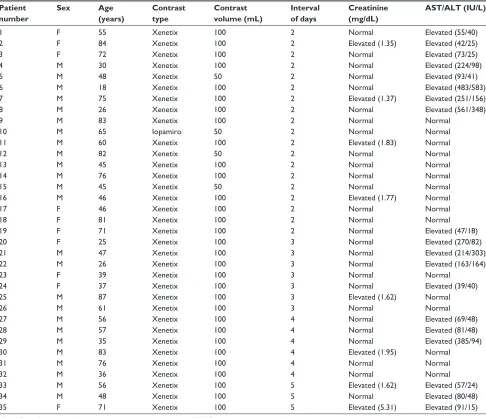
Details of the 35 patients with delayed GBO are shown in Table S1.
Discussion
In the late 1960s and early 1970s, several authors4,15–17 reported GBO on CT in patients who had received water-soluble contrast media. During this period, impaired renal function was believed to be related to VCME.4,16,18 With the advent of CT, detecting vicarious excretion has become easier because of its superior resolution. In 1982, Strax et al applied and evaluated CT images that had been preceded within 2 days by angiography. He noted that 17 of the 21 (81%) patients who had normal liver and renal func-tion showed GBO and three patients received less contrast medium; however, all did not show GBO. He concluded that GBO in patients who had normal renal function might be a normal finding.7 Another similar study by Gillespie et al6 found that GBO was visualized in 64% of patients who groups (58.1 years vs 61.9 years, respectively, P.0.05, and
66.7% vs 67.7% male, respectively, P.0.05).
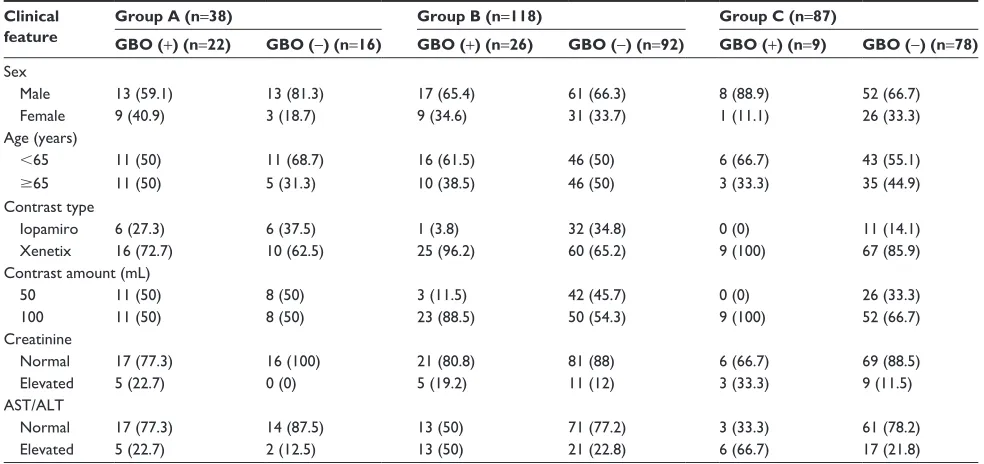
The patient characteristics of the three subgroups are summarized in Table 2. Of the 243 patients, GBO was observed in 22 of the 38 patients (57.9%) in group A, 26 of the 118 patients (22%) in group B, and nine of the 87 patients (10.3%) in group C. Of the 22 patients with GBO in group A, five (22.7%) patients had impaired renal function and hypertransaminasemia. Of the 26 patients with GBO in group B, five (19.2%) patients had impaired renal function and 13 (50%) patients had hypertransaminasemia. Of the nine patients with GBO in group C, three (33.3%) patients had impaired renal function and six (66.7%) patients had hypertransaminasemia. No patients in group C who received 50 mL contrast medium or were administered Iopamiro were found to have GBO.
The incidence of GBO of each group was statistically different indicating that 84% of GBO was revealed in the CT within 3 days interval to a CT scan-detectable GBO (Table 1). The results of multivariate backward stepwise elimination logistic regression in each subgroup are displayed in Table 3. No statistically significant association between any variable and GBO was observed in group A patients (data not shown). The independent predictors of GBO in group B
Table 2 Characteristics of patients in the three subgroups
Clinical feature
Group A (n=38) Group B (n=118) Group C (n=87)
GBO (+) (n=22) GBO (-) (n=16) GBO (+) (n=26) GBO (-) (n=92) GBO (+) (n=9) GBO (-) (n=78)
sex
Male 13 (59.1) 13 (81.3) 17 (65.4) 61 (66.3) 8 (88.9) 52 (66.7)
Female 9 (40.9) 3 (18.7) 9 (34.6) 31 (33.7) 1 (11.1) 26 (33.3)
age (years)
,65 11 (50) 11 (68.7) 16 (61.5) 46 (50) 6 (66.7) 43 (55.1)
$65 11 (50) 5 (31.3) 10 (38.5) 46 (50) 3 (33.3) 35 (44.9)
Contrast type
iopamiro 6 (27.3) 6 (37.5) 1 (3.8) 32 (34.8) 0 (0) 11 (14.1)
Xenetix 16 (72.7) 10 (62.5) 25 (96.2) 60 (65.2) 9 (100) 67 (85.9)
Contrast amount (ml)
50 11 (50) 8 (50) 3 (11.5) 42 (45.7) 0 (0) 26 (33.3)
100 11 (50) 8 (50) 23 (88.5) 50 (54.3) 9 (100) 52 (66.7)
Creatinine
normal 17 (77.3) 16 (100) 21 (80.8) 81 (88) 6 (66.7) 69 (88.5)
elevated 5 (22.7) 0 (0) 5 (19.2) 11 (12) 3 (33.3) 9 (11.5)
asT/alT
normal 17 (77.3) 14 (87.5) 13 (50) 71 (77.2) 3 (33.3) 61 (78.2)
elevated 5 (22.7) 2 (12.5) 13 (50) 21 (22.8) 6 (66.7) 17 (21.8)
Notes: Data are presented as numbers of patients, with percentages in parentheses. gBO (+), positive gBO; gBO (-), negative gBO. group a included patients who received enhanced CT or iVP imaging and then underwent abdominal CT images 1 day later. group B included patients who received enhanced CT or iVP imaging and then underwent abdominal CT images 2 or 3 days later. group C included patients who received enhanced CT or iVP imaging and then underwent abdominal CT images 4 or 5 days later.
Abbreviations: AST/ALT, aspartate aminotransferase/alanine aminotransferase; CT, computed tomography; GBO, gallbladder opacification; IVP, intravenous pyelography.
Therapeutics and Clinical Risk Management downloaded from https://www.dovepress.com/ by 118.70.13.36 on 27-Aug-2020
Dovepress
Ku et al
Table 3 Multivariate backward stepwise elimination logistic regression analysis for predictive contributors to gallbladder opacification
Subgroup Variables OR 95% CI P-value
group a No significant predict or detected
– – –
group B Contrast type 13.52 1.72–106.38 0.013 hypertransaminasemia 3.43 1.31–8.98 0.012 group C hypertransaminasemia 7.18 1.62–31.73 0.009
Note: group a included patients who received enhanced CT or iVP imaging and then underwent abdominal CT images 1 day later. group B included patients who received enhanced CT or iVP imaging and then underwent abdominal CT images 2 or 3 days later. group C included patients who received enhanced CT or iVP imaging and then underwent abdominal CT images 4 or 5 days later. There are no differences in sex, age, contrast volume, and renal function in groups B and C. The dash indicates “no data”.
Abbreviations: CI, confidence interval; CT, computed tomography; IVP, intravenous pyelography; OR, odds ratio.
had normal renal function and who had received cardiac angiography with Hexabrix within 1 day. In 1985, Udeshi8 also observed that 60% patients who had normal blood urea levels and received Hexabrix showed GBO within 25 hours. GBO did not always correlate with previously impaired renal function.5 Tidebrant et al19 reported extrabiliary duct opacification in 38% of patients and GBO in 69% of patients at 4–6 hours after the administration of metrizoate, and CT provided more accurate anatomical information.
This study is presented on the positive association between delayed GBO on CT imaging and liver hyper-transaminasemia, which to our knowledge has not yet been reported in the literature. It is reported that GBO can be detected on late delayed CT images (4–5 days after contrast medium administration). Although GBO was unusual, it was not a rare finding with the incidence of GBO found to be 57.8%, 22%, and 10.3%, respectively, in the three study groups. As we expected, the incidence of GBO decreased as the interval between imaging sessions increased. This finding was not surprising as VCME via the gallbladder was probably underestimated in groups B and C patients because of the drainage of bile into the common bile duct and intestinal tract.
Fisher’s exact test revealed that several variables, includ-ing interval of days, contrast type, contrast volume, renal function, and hypertransaminasemia, were related to GBO. A previous study showed a lower serum bilirubin level (OR, 1.67) and a raised serum creatinine level (relative odds =2.01) and also mildly higher incidence of GBO after angiography within 1 day.9 Through multivariate logistic regression, three different groups were further evaluated and found that no variable shows significance in the group A patients, and the only significant variable in the groups
B and C patients was the hypertransaminasemia. In this study, of the patients showing GBO, five of the 23 (22.7%) patients had hypertransaminasemia in group A, whereas six of the nine (66.7%) patients had in group C. In fact, all three patients showing GBO after first image study 5 days had hypertransaminasemia. From this study, delayed GBO may be the hint of hypertransaminasemia.
The two types of contrast media assessed in the present study were found to influence GBO in group B but not in group A or group C. Using the same types of contrast media, Yamazaki et al20 reported protein binding, capacity, molecular weight, and osmotic pressure of contrast medium as indepen-dently associated with biliary excretion rate. Furthermore, although less amount of contrast media was used as compared with the previous study9 (,100 mL vs 180 mL), no difference in the incidence of GBO within 1 day was observed (57.8% [22 out of 38 patients in Group A] vs 60% [as reported by Yamazaki et al]). Overall, these findings indicate that contrast volume is not an independent predictor of GBO.
Of the 22 patients in group A with GBO, 17 (77.3%) group A had normal renal function. This finding corroborates the results of a previous study.7
Aminotransferases are normally present in circulation at low levels. They are intracellular enzymes produced princi-pally by hepatocytes, and their increase in serum is, therefore, indicative of liver cell injury. However, AST is also found in many extrahepatic origins. Additionally, ALT is present in skeletal muscle and kidneys, but at low concentrations, and its increase in the circulation is more specific for liver damage than AST.21
There were some limitations to the present study: 1) Quantitative analysis of the hypertransaminasemia was not performed and GBO was delayed. However, a prominent OR was observed for the positive correlation between delayed GBO and hypertransaminasemia. 2) The exact cause of hypertransaminasemia such as a hepatic origin and an extra-hepatic origin was not surveyed because of the retrospective nature of the present study. 3) Serum creatinine levels are a less accurate measure of renal function compared with other tests such as 24-hour creatinine clearance rate or Tc-99m diethylene triamine pentaacetic acid. However, it was not impossible to perform these measurements because of the retrospective nature of the present study. 4) Patients with gallstones were not excluded, and this may have confounded the results of the present study. However, three radiologists evaluated all CT images and reached a consensus, and this probably reduced the error due to the presence of gallstones. 5) The gallbladder is a physiologic organ that interacts
Therapeutics and Clinical Risk Management downloaded from https://www.dovepress.com/ by 118.70.13.36 on 27-Aug-2020
Dovepress Clinical analysis of contributors to delayed gBO
with physiologic stimuli such as eating food. The fasting state might be an influential factor. 6) Bias may have been introduced into the results of this study because underlying diseases, liquid intake, and urine volume were not recorded or remote laboratory data not excluded. Finally, the use of different CT scanners may lead to different attenuation values. However, the impact from the difference is believed to be small.
Conclusion
The findings of the present study demonstrate that GBO on CT imaging can be detected in individuals with normal renal function and that delayed GBO on CT is not a rare finding. Delayed GBO may identify patients at greater risk of hypertransaminasemia, particularly patients receiving contrast medium over periods .4 days. A detailed evalua-tion of medical and family history and an accurate clinical examination are crucial in determining the likely etiology of hypertransaminasemia.
Disclosure
The authors report no conflicts of interest in this work.
References
1. Lautin EM, Friedman AC. Vicarious excretion of contrast media. JAMA. 1982;247(11):1608–1610.
2. Meholic AJ, Davis M, Bonmati C. Vicarious gastric excretion of intra-venous contrast. Am J Physiol Imaging. 1991;6(4):197–200.
3. Arendt J, Zgoda A. The heterotropic excretion of intravenously injected contrast media. Radiology. 1957;68(2):238–241.
4. Shea TE, Pfister RC. Opacification of the gallbladder by urographic contrast media. Reflection of an alternate excretory pathway. Am J
Roentgenol Radium Ther Nucl Med. 1969;107(4):763–768.
5. Ford KK, Wysong B, Thompson WM. Opacification of the gallbladder following intravenous contrast injection in patients with normal renal function. Urol Radiol. 1983;5(4):251–252.
6. Gillespie JE, Gholkar A, Gupta S. Gallbladder visualisation follow-ing paediatric cardioangiography with Hexabrix. Br J Radiol. 1985; 58(690):511–513.
7. Strax R, Toombs BD, Kam J, Rauschkolb EN, Patel S, Sandler CM. Gallbladder enhancement following angiography: a normal CT finding.
J Comput Assist Tomogr. 1982;6(4):766–768.
8. Udeshi UL. Gall-bladder and colonic opacification following parenteral ioxaglate. Clin Radiol. 1985;36(5):497–498.
9. Yamazaki H, Oi H, Matsushita M, et al. Gallbladder opacification 12–24 h after angiography by CT examination: a multivariate analysis.
Abdom Imaging. 1996;21(6):507–511.
10. Pauli-Magnus C, Meier PJ, Stieger B. Genetic determinants of drug-induced cholestasis and intrahepatic cholestasis of pregnancy. Semin
Liver Dis. 2010;30(2):147–159.
11. Berry W, Reichen J. Bile acid metabolism: its relation to clinical disease.
Semin Liver Dis. 1983;3(4):330–340.
12. Boyer JL. Bile formation and secretion. Compr Physiol. 2013;3(3): 1035–1078.
13. Brauer RW, Leong GF, Holloway RJ. Mechanics of bile secretion; effect of perfusion pressure and temperature on bile flow and bile secretion pressure. Am J Physiol. 1954;177(1):103–112.
14. Solomon R. Contrast media: are there differences in nephrotoxicity among contrast media? Biomed Res Int. 2014;2014:934947. 15. Barry WF Jr, Forbis SE Jr. Vicarious excretion of intravascular contrast
material. J Urol. 1968;100(5):704.
16. Cockerill EM, Kurlander GJ. Extrarenal excretion of urographic contrast medium in renal failure: report of a case of gallbladder opaci-fication simulating renal cyst. J Urol. 1968;100(1):6–7.
17. Shea TE, Pfister RC. Opacification of the gallbladder in a child follow-ing administration of urographic contrast medium. Pediatrics. 1972; 49(1):116–118.
18. Chamberlain MJ, Shewood T. The extra-renal excretion of diatrizoate in renal failure. Br J Radiol. 1966;39(466):765–770.
19. Tidebrant G, Lukes P, Tylen U. Contrast enhancement of liver paren-chyma and biliary tract related to liver function at delayed computed tomography. Acta Radiol. 1990;31(3):265–268.
20. Yamazaki H, Oi H, Matsushita M, et al. Lack of correlation between gallbladder opacification in delayed CT and contrast-associated neph-ropathy. Eur Radiol. 1997;7(8):1328–1331.
21. Vajro P, Maddaluno S, Veropalumbo C. Persistent hypertransami-nasemia in asymptomatic children: a stepwise approach. World J
Gastroenterol. 2013;19(18):2740–2751.
Therapeutics and Clinical Risk Management downloaded from https://www.dovepress.com/ by 118.70.13.36 on 27-Aug-2020
Therapeutics and Clinical Risk Management
Publish your work in this journal
Submit your manuscript here: http://www.dovepress.com/therapeutics-and-clinical-risk-management-journal
Therapeutics and Clinical Risk Management is an international, peer-reviewed journal of clinical therapeutics and risk management, focusing on concise rapid reporting of clinical studies in all therapeutic areas, outcomes, safety, and programs for the effective, safe, and sustained use of medicines. This journal is indexed on PubMed Central, CAS,
EMBase, Scopus and the Elsevier Bibliographic databases. The manuscript management system is completely online and includes a very quick and fair peer-review system, which is all easy to use. Visit http://www.dovepress.com/testimonials.php to read real quotes from published authors.
Dovepress
Dove
press
Ku et al
Supplementary material
Table S1 Clinical information for 35 patients with positive delay gallbladder opacification
Patient number
Sex Age
(years)
Contrast type
Contrast volume (mL)
Interval of days
Creatinine (mg/dL)
AST/ALT (IU/L)
1 F 55 Xenetix 100 2 normal elevated (55/40)
2 F 84 Xenetix 100 2 elevated (1.35) elevated (42/25)
3 F 72 Xenetix 100 2 normal elevated (73/25)
4 M 30 Xenetix 100 2 normal elevated (224/98)
5 M 48 Xenetix 50 2 normal elevated (93/41)
6 M 18 Xenetix 100 2 normal elevated (483/583)
7 M 75 Xenetix 100 2 elevated (1.37) elevated (251/156)
8 M 26 Xenetix 100 2 normal elevated (561/348)
9 M 83 Xenetix 100 2 normal normal
10 M 65 iopamiro 50 2 normal normal
11 M 60 Xenetix 100 2 elevated (1.83) normal
12 M 82 Xenetix 50 2 normal normal
13 M 45 Xenetix 100 2 normal normal
14 M 76 Xenetix 100 2 normal normal
15 M 45 Xenetix 50 2 normal normal
16 M 46 Xenetix 100 2 elevated (1.77) normal
17 F 46 Xenetix 100 2 normal normal
18 F 81 Xenetix 100 2 normal normal
19 F 71 Xenetix 100 2 normal elevated (47/18)
20 F 25 Xenetix 100 3 normal elevated (270/82)
21 M 47 Xenetix 100 3 normal elevated (214/303)
22 M 26 Xenetix 100 3 normal elevated (163/164)
23 F 39 Xenetix 100 3 normal normal
24 F 37 Xenetix 100 3 normal elevated (39/40)
25 M 87 Xenetix 100 3 elevated (1.62) normal
26 M 61 Xenetix 100 3 normal normal
27 M 56 Xenetix 100 4 normal elevated (69/48)
28 M 57 Xenetix 100 4 normal elevated (81/48)
29 M 35 Xenetix 100 4 normal elevated (385/94)
30 M 83 Xenetix 100 4 elevated (1.95) normal
31 M 76 Xenetix 100 4 normal normal
32 M 36 Xenetix 100 4 normal normal
33 M 56 Xenetix 100 5 elevated (1.62) elevated (57/24)
34 M 48 Xenetix 100 5 normal elevated (80/48)
35 F 71 Xenetix 100 5 elevated (5.31) elevated (91/15)
Note: The values in parentheses indicate impaired creatinine and asT/alT values above the normal range. Abbreviations: asT/alT, aspartate aminotransferase/alanine aminotransferase; F, female; M, male.
Therapeutics and Clinical Risk Management downloaded from https://www.dovepress.com/ by 118.70.13.36 on 27-Aug-2020