R E S E A R C H
Open Access
Effect of weight loss on circulating fatty
acid profiles in overweight subjects with
high visceral fat area: a 12-week
randomized controlled trial
Young Ju Lee
1,2, Ayoung Lee
1,2, Hye Jin Yoo
1,2, Minjoo Kim
3, Minkyung Kim
3, Sun Ha Jee
4, Dong Yeob Shin
5and Jong Ho Lee
1,2,3*Abstract
Background:Significant associations between visceral fat and alterations in plasma fatty acids have been identified
in overweight individuals. However, there are scant data regarding the relationships of the visceral fat area (VFA) with the plasma fatty acid profiles and desaturase activities following weight loss. We investigated the effect of weight loss with mild calorie restriction on the circulating fatty acid profiles and desaturase activities in nondiabetic overweight subjects with high VFA.
Methods:Eighty overweight subjects with high VFA (L4 VFA ≥100 cm2) were randomized into the 12-week
mild-calorie-restriction (300 kcal/day) or control groups.
Results: Comparison of the percent of body weight changes between groups revealed that the weight-loss
group had greater reductions in body weight. The VFA decreased by 17.7 cm2from baseline in the weight-loss group (P< 0.001). At follow-up, the weight-loss group showed greater reductions in serum triglycerides, insulin, and HOMA-IR than the control group. Significantly greater reductions in total saturated fatty acids, palmitic acid, stearic acid, total monounsaturated fatty acids, palmitoleic acid, oleic acid, eicosadienoic acid, and dihomo-γ -linolenic acid levels were detected in the weight-loss group compared with the control group after adjusting for baseline values. Following weight loss, C16 Δ9-desaturase activity was significantly decreased andΔ 5-desaturase activity was significantly increased, and the changes were greater in the weight-loss group than in the control group.
Conclusions: The results suggest that mild weight loss improves abdominal obesity, overall fatty acid profiles,
and desaturase activities; therefore, mild calorie restriction has potential health benefits related to obesity-related diseases in overweight subjects with high VFA.
Trial registration:NCT02992639. Retrospectively registered 11 December 2016.
Keywords:Fatty acid, Fatty acid desaturase, Visceral fat, Weight loss, Obesity-related disease
* Correspondence:[email protected] 1
National Leading Research Laboratory of Clinical Nutrigenetics/Nutrigenomics, Department of Food and Nutrition, College of Human Ecology, Yonsei University, 50 Yonsei-ro, Seodaemun-gu, Seoul 03722, Korea
2Department of Food and Nutrition, Brain Korea 21 PLUS Project, College of
Human Ecology, Yonsei University, 50 Yonsei-ro, Seodaemun-gu, Seoul 03722, Korea
Full list of author information is available at the end of the article
Background
A visceral fat area (VFA) cutoff of 100 cm2was established to predict the risk of obesity-related health risks, including insulin resistance (IR), metabolic syndrome, and diabetes, in Asian populations [1]. Compared with abdominal sub-cutaneous fat, visceral fat is more metabolically active in the fasting state [2, 3]. Compared with other weight-loss methods, calorie restriction tends to reduce more visceral than subcutaneous adipose tissue [4]. It is known that plasma fatty acid composition mirrors not only dietary fatty acid composition but also endogenous fatty acid syn-thesis, in which desaturases play important roles [5]. In endogenous fatty acid synthesis, C16 Δ9-desaturase (C16:1/C16:0) activity is known to be high in conditions of diabetes and abdominal obesity. Additionally, an inverse relation betweenΔ5-desaturase activity (C20:4, n-6/C20:3, n-6) and diabetes risk and a direct relation between Δ 6-desaturase activity (C18:3, n-6/C18:2, n-6) and IR have been reported. Pan et al. [6] reported that obesity is related to increased Δ9-desaturase activity and reduced Δ5-desaturase activity. Several previous studies observed that lowΔ5-desaturase activity is linked to increased risk of type 2 diabetes and insulin resistance among Japanese adults [7, 8]. Zhao et al. [9] also noted thatΔ5-desaturase activity is inversely associated with metabolic abnormal-ities among obese Chinese subjects. In a Swedish study, Δ5-desaturase activity was found to be inversely associated with obesity and insulin resistance, whereasΔ6-desaturase activity demonstrated positive associations [10].
Significant associations between visceral fat amount and alterations in serum fatty acids have been identified in overweight individuals [11]. However, there are scant data regarding the relations between changes in VFA and changes in circulating fatty acid profiles and desa-turase activities following weight loss. Research is re-quired to determine the amount of visceral fat reduction with calorie restriction that is necessary to induce favor-able metabolic changes in the overall fatty acid profile. Therefore, in this study, we investigated the effects of weight loss with mild calorie restriction (a 300 kcal/day intake reduction) on circulating fatty acid profiles and desaturase activities in nondiabetic overweight subjects with high VFA [VFA at the 4th lumbar vertebrae (L4 VFA)≥100 cm2].
Methods Study subjects
Study subjects were recruited through advertisements posted in Seoul. Based on the data screened by the Clin-ical Nutrition Lab, Yonsei University, overweight subjects [25.0 kg/m2 ≤body mass index (BMI) < 30 kg/m2] were referred to the Department of Internal Medicine, Yonsei University Severance Hospital. After their health and basic blood tests, including serum glucose, were rechecked,
individuals who met the study criteria were recommended for study participation. The inclusion criteria were as fol-lows: age between 20 and 60 years; absence of pregnancy or breastfeeding; stable body weight (body weight change < 1 kg in the 3 months before screening); BMI between 25 and 30 kg/m2; high L4 VFA (L4 VFA≥100 cm2); absence of hypertension, type 2 diabetes, cardiovascular disease, and thyroid disease; and no use of medication affecting body weight, energy expenditure, or glucose control for 6 months prior to screening. Subjects were excluded if they had a history of Cushing syndrome, malignancy, or liver disease, including chronic viral hepatitis, autoimmune hepatitis, primary biliary cirrhosis, and drug-induced liver disease. Male and female subjects whose alcohol consump-tion was > 40 and > 20 g/day, respectively, and subjects with a history of intentional weight reduction in the 6 months before the current study were excluded. Finally, those who consented to participate in the program were included in this study. The purpose of the study was care-fully explained to all participants, and written consent was obtained prior to their participation. The protocol was approved by the Institutional Review Board of Yonsei Uni-versity and Yonsei UniUni-versity Severance Hospital in accordance with the Helsinki Declaration.
Study design and intervention
The basic framework of the present study was based on a previous study [12]. A 12-week, placebo-controlled, randomized study was conducted with 80 high VFA, nondiabetic overweight subjects (L4 VFA ≥100 cm2). Subjects were divided into two groups: a weight-loss group with 12 weeks of mild calorie restriction (a 300 kcal/day intake reduction) or a control group with no treatment (NCT02992639; http://www.clinicaltrials.-gov/). Randomization was achieved by computer-generated block randomization (placebo:test = 1:1).
Protocol for weight loss
control group were instructed to maintain their usual diet-ary and physical activity habits during the study period.
Daily energy intake and physical activity measurements
At baseline, the subjects’ usual dietary intakes were assessed via 24-h recall and semiquantitative food fre-quency questionnaires completed with the nutritionist’s assistance. In addition, a standardized 3-day dietary record was obtained from each participant at week 6 and 12. These records were completed at home following detailed instructions from the nutritionist. A computerized version of the Korean Nutrition File (Can-Pro 3.0; The Korean Nutrition Society, Seoul, Korea) was used to determine the macronutrient contents of foods and total daily energy intakes. On the same days as the dietary records, 3-day physical activity records were completed at home. The total energy expenditure (TEE) (kcal/day) was calculated from activity patterns, including the basal metabolic rate (BMR), physical activity for 24 h, and the specific dynamic action of food. Each subject’s BMR was calculated using the Harris-Benedict equation.
Anthropometric parameters and body composition measurements
Detailed information was previously published [14]. Briefly, all data were acquired at baseline and week 12. Body weight (Inbody370; Biospace, Cheonan, Korea), height, waist circumference, and blood pressure (BP) were measured. BMI was calculated in units of kilogram per square meter (kg/m2). The abdominal fat distribu-tion was measured at L4 by computed tomography (CT). The scanning parameters were a slice thickness of 1 mm at 200 mA and 120 kVp, with a 48-cm field of view. Abdominal adipose tissue was determined using the attenuation range from −150 to −50 Hounsfield units in the CT images. The body composition of the study participants was measured via dual-energy X-ray absorptiometry (DEXA) to determine the fat percentage, fat mass, and lean body mass.
Blood collection and biochemical assessments
Details were provided previously [14]. Blood samples were collected after an overnight fast of at least 12 h. Venous blood specimens were collected in EDTA-treated tubes and serum tubes. The blood samples were centrifuged to obtain plasma and serum samples, which were then stored at−70 °C. The levels of serum-fasting glucose, insulin, triglycerides (TGs), total cholesterol, and high-density lipoprotein (HDL) cholesterol were measured [15]. The IR and low-density lipoprotein (LDL) cholesterol levels were calculated using the equa-tions of homeostatic model assessment (HOMA) and the Friedewald formula, respectively: HOMA-IR = [fast-ing insulin (μIU/mL) × fasting glucose (mg/dL)]/405;
Friedewald formula: LDL cholesterol = total cholesterol
–[HDL cholesterol + (TG/5)].
Metabolite extraction and gas chromatography–mass spectrometry (GC-MS) analysis
The details of the GC-MS procedure have been previ-ously published [16]. Briefly, plasma samples (100 μL) were placed into PTEE screw-capped Pyrex tubes. An internal standard compound containing heptadecanoic acid (500μL, 25 ppm in n-hexane) and methanol (2 mL) were added to the samples. After vortexing, acetyl chlor-ide (100 μL) was added slowly, and the tubes were then heated at 95 °C for 1 h. After cooling on ice, 6% potas-sium carbonate (5 mL) was added to the tubes. The tubes were centrifuged (4 °C, 3000 rpm, 5 min), and the clear n-hexane top layer (100 μL), including the fatty acid methyl esters (FAME), was then transferred into a vial prior to GC-MS analysis.
GC-MS analyses were performed on an Agilent Tech-nologies 7890 N gas chromatograph coupled with an Agilent Technologies 5977A quadrupole mass selective spectrometer with a triple-axis detector (Agilent, Palo Alto, CA, USA) in the electron ionization (70 eV) and full scan monitoring (m/z 50–800) modes. The injection volume of the samples was 1 μL in the splitless mode. The fatty acid methyl esters of all samples were sepa-rated on a VF-WAX column (Agilent Technologies, Middelburg, Netherlands) with helium as a carrier gas. The temperature program was as follows: (1) initial temperature of 50 °C for 2.3 min, (2) increase to 175 °C at 50 °C/min, and (3) increase to 230 °C at 2 °C/min. The metabolites in the samples were identified by com-paring their relative retention times and mass spectra with those of authentic reference standards. The relative levels of metabolites were calculated by comparing their peak areas to those of the internal standard compound.
Statistical analysis
expressed as the mean ± standard error (SE). A two-tailedP< 0.05 was considered statistically significant.
Results
The dropout rate was less than 10% in the control (n= 2) and weight-loss (n= 3) groups. Participants were excluded for personal reasons (n= 4) and lack of a blood sample for GC-MS analysis (n= 1).
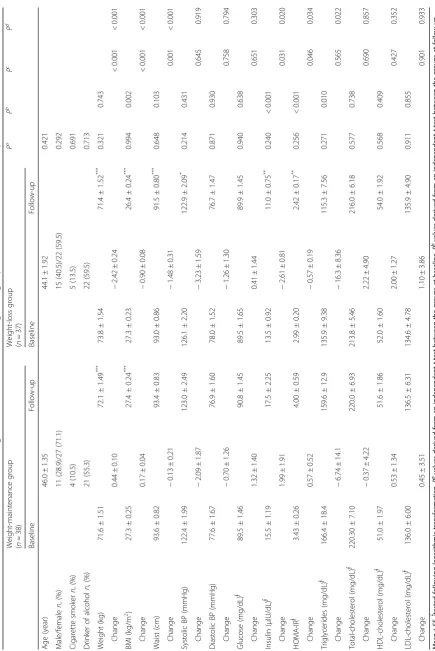
Effects of mild calorie restriction on clinical and biochemical characteristics at baseline and follow-up
The age, sex distribution, smoking, and drinking did not significantly differ between the two groups (Table 1). At baseline, no significant differences were observed in all clin-ical and biochemclin-ical parameters between the control and weight-loss groups; after the 12-week intervention, the BMI, serum insulin levels, HOMA-IR score, and serum TG levels were significantly decreased in the weight-loss group compared with the control group (Table 1). In the control group, the subjects showed slight but significant weight gain (weight and BMI; all P< 0.001) during the interven-tion, whereas the subjects in the weight-loss group showed significant reductions in not only the weight and BMI (both
P< 0.001) but also the waist circumference (P< 0.001), sys-tolic BP (P= 0.049), insulin levels (P= 0.001), and HOMA-IR score (P= 0.003) following the intervention (Table 1). In addition, these reductions in weight, BMI, and waist cir-cumference in the weight-loss group were greater than those in the control group after adjusting for the baseline values (all P< 0.001) (Table 1). The serum insulin levels, HOMA-IR score, and serum TG levels also showed signifi-cantly greater decreases in the weight-loss group than in the control group after adjusting for the baseline values (P = 0.020, P= 0.034, and P= 0.022, respectively) (Table 1). The estimated TEE (2144.6 ± 45.3 kcal/d vs. 2201.3 ± 59.3 kcal/d;P= 0.519), total calorie intake (TCI) (2105.8 ± 40.0 kcal/d vs. 2200.5 ± 50.3 kcal/d;P= 0.159), and percent-age of macronutrient intakes (%CHO:%PRO:%FAT = 61:15:22 in both groups) did not significantly differ between the two groups at baseline (data not shown). The subjects’ overall compliance with the weight-loss plan was good. The estimated TCI of the weight-loss group at 12-week follow-up was, on average, 1949.4 kcal (%CHO:%PRO:%FAT = 59:19:22); and the types of dietary fats [saturated fatty acids (SFAs), monounsaturated fatty acids (MUFAs), and polyun-saturated fatty acids (PUFAs)] ingested by the study partici-pants did not demonstrate any changes during the intervention (data not shown).
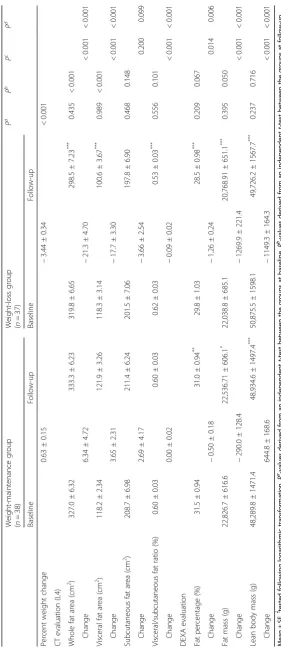
Effects of a 12-week mild calorie restriction on percent of body weight change, abdominal fat areas (CT), and body composition (DEXA)
Table 2 presents the effects of a 12-week mild calorie-restricted diet on the percent of body weight change,
abdominal fat area measured by CT, and body compos-ition measured by DEXA. Comparison of the percent of body weight changes (differences from baseline) revealed that the weight-loss group had greater reductions in the percent of body weight change than the control group (0.63 ± 0.15 vs. -3.44 ± 0.34;P< 0.001). Regarding the re-sults of CT, no significant differences were observed in the L4 abdominal fat area (whole fat area and VFA), L4 subcutaneous fat area, or visceral-to-subcutaneous area ratio (VSR) at baseline between the control and weight-loss groups. At follow-up, the L4 VFA in the weight-weight-loss group was lower than in the control group (P< 0.001). The VFA decreased by 17.7 cm2(15%) from baseline in the weight-loss group (P< 0.001), and the VSR decreased by 0.09 from baseline in the weight-loss group (P< 0.001). Significantly greater reductions in the L4 VFA and VSR were observed in the weight-loss group com-pared with the control group (all P< 0.001). No statisti-cally significant shifts in the VFA, subcutaneous fat area, or VSR were identified in the control group (Table 2). With regard to the DEXA results, there were no signifi-cant differences in the fat percentage, fat mass, or lean body mass between the two groups at both baseline and follow-up (Table 2). After the intervention, significant decreases in the fat percentage and fat mass were ob-served in both the control and weight-loss groups; how-ever, greater reductions in the fat percentage and fat mass were observed in the weight-loss group than in the control group after adjustment for the baseline values (P= 0.006 andP< 0.001, respectively). The control group showed a significant increase in the lean body mass, whereas the weight-loss group showed a significant de-crease in the lean body mass at the 12-week follow-up; these changes were significantly different between the two groups (P< 0.001) (Table 2).
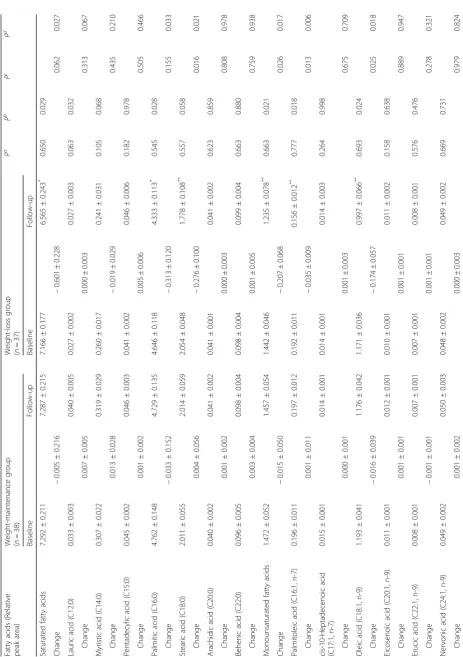
Effects of mild calorie restriction on circulating fatty acid profiles and desaturase activities at baseline and follow-up
Table
3
GC-MS
analysis
of
fatty
acids
in
the
weight-maintenance
(co
ntrol)
and
weight-loss
groups
at
baseline
and
12-week
follo
w-up
(Continued)
Fatt
y
acids
(Rel
ative
pe
ak
area)
Weig
ht-maintenan
ce
gro
up
(
n
=
38)
We
ight-los
s
group
(
n
=
37)
P
a
P
b
P
c
P
d
Basel
ine
Fol
low-up
Bas
eline
Fol
low-u
p
C16
Δ
9-d
esaturase
a
0.041
±
0.001
0.041
±
0.002
0.04
1
±
0.002
0.036
±
0.002
**
0.992
0.05
8
Change
0.000
±
0.001
−
0.00
5
±
0.002
0.
016
0.014
C18
Δ
9-d
esaturase
b
0.593
±
0.012
0.583
±
0.011
0.56
9
±
0.009
0.561
±
0.010
0.111
0.14
4
Change
−
0.010
±
0.013
−
0.00
8
±
0.012
0.
903
0.331
Δ
6-d
esaturase
c
0.017
±
0.002
0.019
±
0.002
0.01
4
±
0.001
0.014
±
0.001
0.122
0.04
9
Change
0.001
±
0.002
−
0.00
1
±
0.001
0.
264
0.211
Δ
5-d
esaturase
d
4.725
±
0.201
4.689
±
0.214
5.14
1
±
0.190
6.157
±
0.336
**
0.137
<
0.00
1
Change
−
0.035
±
0.154
1.017
±
0.35
1
0.
008
0.001
Elo
ngase
e
0.426
±
0.008
0.428
±
0.007
0.44
4
±
0.006
0.406
±
0.014
*
0.092
0.16
1
Change
0.001
±
0.010
−
0.03
8
±
0.014
0.
024
0.101
Mean
±
SE.
∮tested
following
logarithmic
transformation.
P
a-values
derived
from
an
independent
t-test
between
the
groups
at
baseline.
P
b-values
derived
from
an
independent
t-test
between
the
groups
at
follow
up.
P
c-values
derived
from
an
independent
t-test
between
the
groups
at
changed
values.
P
d-values
are
P
c-values
adjusted
with
the
baseline
values.
*P
<
0.05,
**P
<
0.01,
and
***
P
<
0.001
derived
from
a
paired
t
-test.
aC16
Δ
9-desaturase
=
palmitoleic
acid/palmitic
acid.
bC18
Δ
9-desaturase
=
oleic
acid/stearic
acid.
cΔ
6-desatuarse
=
γ
-linolenic
acid/linoleic
acid.
dΔ
5-desaturase
=
arachidonic
acid/dihomo
-γ
-linolenic
acid.
eElongase
activity
=
ste-aric
acid/palmitic
these decreases were significantly greater than those in the control group after adjustment for the baseline values (P =0.017,P =0.006, andP =0.018, respectively). At follow-up, the weight-loss group showed significantly lower levels of total MUFAs (P= 0.021), palmitoleic acid (C16:1, n-7) (P= 0.018), and oleic acid (C18:1, n-9) (P= 0.024) than did control group. Although the total n-6 and n-3 PUFA levels did not significantly change, eicosa-dienoic acid (C20:2, n-6) and dihomo-γ-linolenic acid (C20:3, n-6) decreased from baseline in the weight-loss group. Both showed greater reductions in the weight-loss group than in the control group after adjusting for the baseline values (P< 0.001 and P= 0.003, respect-ively). At follow-up, the weight-loss group showed sig-nificantly lower levels of eicosadienoic acid (C20:2, n-6) (P< 0.001) and dihomo-γ-linolenic acid (C20:3, n-6) (P = 0.001) than the control group (Table 3).
C16 Δ9-desaturase activity significantly decreased from baseline in the weight-loss group, and this reduc-tion was greater in the weight-loss group than in the control group after adjusting for the baseline values (P= 0.014). The activity of Δ5-desaturase significantly in-creased from baseline in the weight-loss group, and this increase was greater in the weight-loss group than in the control group after adjusting for the baseline values (P= 0.001). In addition, at follow-up, Δ5-desaturase activity was significantly higher in the weight-loss group than in the control group (P < 0.001). Elongase activity signifi-cantly decreased after the intervention (Table 3).
Relations between changes in L4 VFA and changes in clinical/biochemical characteristics and fatty acid levels
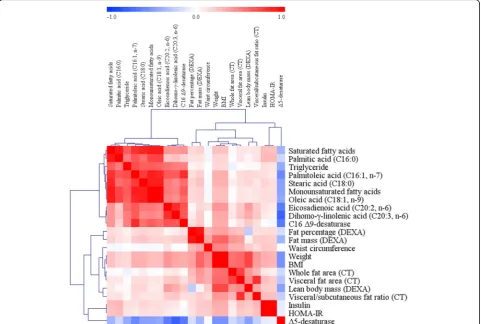
Overall, 22 variables showed significant changes in the weight-loss group compared with the control group after adjusting for the baseline values [Table 1: weight, BMI, waist circumference, insulin, HOMA-IR, and TGs; Table 2: whole fat area, VFA, VSR, fat percentage, fat mass, and lean body mass; Table 3: SFAs, palmitic acid (C16:0), ste-aric acid (C18:0), MUFAs, palmitoleic acid (C16:1, n-7), oleic acid (C18:1, n-9), eicosadienoic acid (C20:2, n-6), dihomo-γ-linolenic acid (C20:3, n-6), C16Δ9-desaturase, and Δ5-desaturase]. A correlation analysis between changes in L4 VFA and changes in these variables was performed. Of the total study subjects (n= 75), the changes in L4 VFA demonstrated significant positive cor-relations with changes in weight (r= 0.596, P< 0.001), BMI (r= 0.596,P< 0.001), waist circumference (r= 0.317,
P= 0.006), insulin (r= 0.259,P= 0.025), fat percentage (r = 0.241, P= 0.037), fat mass (r= 0.381, P= 0.001), lean body mass (r= 0.464, P< 0.001), and dihomo-γ-linolenic acid (C20:3, n-6) (r= 0.235, P= 0.042) and a significant negative correlation with changes inΔ5-desaturase activ-ities (r=−0.277,P= 0.016) (Fig. 1).
Discussion
VFA is associated with plasma fatty acid profiles and lifestyle patterns [17]. We investigated the effects of weight loss by mild calorie restriction (a 300 kcal/day in-take reduction) on circulating fatty acid profiles and desaturase activities in nondiabetic and overweight sub-jects with high VFA (L4 VFA ≥100 cm2). The 12-week intervention led to a 3.4% body weight loss and a 15% VFA loss in the participants in the weight-loss group. In addition, the study showed enhancement of plasma fatty acid profiles (SFAs and MUFAs), greater decreases in C16Δ9-desaturase activity, and greater increases inΔ 5-desaturase activity in the weight-loss group compared with the control group.
An inverse relation betweenΔ5-desaturase activity and diabetes risk [18] and direct relations among C16 Δ 9-desaturase activity, insulin resistance, and abdominal obesity [5] have been reported. In the present study, a VFA loss was significantly related toΔ5-desaturase activity but not to C16Δ9-desaturase activity. Although some evi-dence supports the inverse relation between Δ 5-desaturase activity and diabetes risk [18–22], the Δ 5-desaturase activity of this study did not correlate to insulin and HOMA-IR, which are risk factors of type 2 diabetes. However, the weight-loss group showed greater reductions in the serum insulin levels and HOMA-IR scores than the control group; furthermore, changes in insulin and HOMA-IR were positively correlated with changes in weight and BMI, which showed a significant negative cor-relation with changes in Δ5-desaturase activity. Because weight and BMI are also closely related to the risk of type 2 diabetes [23, 24], our results might indicate an indirect inverse association betweenΔ5-desaturase activity and the risk of type 2 diabetes (Fig. 2). Consequently, mild calorie-restriction-induced weight loss in individuals with high VFA might lead to the potential benefit of a reduced risk of type 2 diabetes by improving fatty acid desaturase activity.
EstimatedΔ5-desaturase activity was expressed as the ratio of arachidonic acid (20:4, n-6) to dihomo-γ -linolenic acid (20:3, n-6). The increase inΔ5-desaturase activity observed in the weight-loss group might result from the greater decrease of dihomo-γ-linolenic acid (20:3, n-6) than that observed in the control group be-cause there were no significant changes in arachidonic acid (20:4, n-6) in the control and weight-loss groups. Indeed, changes in VFA were positively correlated with changes in dihomo-γ-linolenic acid (20:3, n-6) (Fig. 1). Therefore, the study indicated that the inverse relation between VFA andΔ5-desaturase activity might be medi-ated by an alteration of dihomo-γ-linolenic acid (20:3, n-6), which is also significantly associated with VFA.
dihomo-γ-linolenic acid (C20:3, n-6) but also eicosadienoic acid (C20:2, n-6); and these reductions were greater than the reductions detected in the control group (Table 3). Con-sistent with our results, other studies have found that obese individuals showed higher levels of dihomo-γ -linolenic acid (C20:3, n-6) in plasma phospholipids, TGs, and sterol esters than the controls [25, 26]. A recent study emphasized the proadipogenic properties of n-6
PUFAs [27]; indeed, several studies have found that n-6 PUFAs promote adipogenesis and increase the expres-sion of lipogenic genes [27, 28]. Muhlhausler BS et al. [27] concluded that n-6 PUFAs promote the expansion of fat depots by up-regulating both hyperplasia and hypertrophy; in other words, an accumulation of n-6 PUFAs might exacerbate an obese status by enhanced adipogenesis, which could lead to several obesity-related
Fig. 1Correlation matrix among major clinical parameters, fatty acids, and fatty acid desaturases (changed values). Correlations were obtained by
identifying a Pearson’s correlation coefficient.Redindicates a positive correlation, andblueindicates a negative correlation
Fig. 2Summary of an indirect association betweenΔ5-desaturase activity and the risk of type 2 diabetes in the present study. Although no
signifi-cant and direct correlation betweenΔ5-desaturase activity and the risk of type 2 diabetes was observed in this study, connections amongΔ
5-desaturase activity, weight, BMI, serum insulin level, and HOMA-IR score indicate an indirect inverse correlation betweenΔ5-desaturase activity and the
risk of type 2 diabetes. Because the visceral fat area (VFA) has a significant negative correlation withΔ5-desaturase activity andΔ5-desaturase activity is
health risks, including IR, metabolic syndrome, and dia-betes [1]. Therefore, lowering the n-6 PUFA levels by calorie-restriction-induced weight loss is necessary, and the reduction of VFA to lower n-6 PUFAs is important.
In this study, the weight-loss group showed significant decreases in total SFAs, including palmitic acid (C16:0) and stearic acid (C18:0), which have previously been ob-served to be related to the incidence of type 2 diabetes [29, 30]. Total MUFAs, including palmitoleic acid (C16:1, n-7) and oleic acid (C18:1, n-9), were also signifi-cantly decreased in the weight-loss group of this study. The palmitoleic acid (C16:1, n-7) plasma concentrations mostly showed de novo hepatic fatty acid synthesis from palmitic acid (C16:0) by C16 Δ9-desaturase [31, 32]; in the present study, both palmitic acid (C16:0) and C16 Δ9-desaturase activity were significantly decreased dur-ing the 12-week intervention in the weight-loss group, which indicates that these alterations might affect plasma concentrations of palmitoleic acid (C16:1, n-7). Mice supplemented with palmitoleic acid exhibit higher fat deposition, hepatic steatosis, and increased hepatic expression of sterol regulatory element-binding protein 1c and fatty acid synthase, demonstrating the pro-lipogenic effect of this MUFA [33]. Moreover, studies conducted on humans have observed a detrimental in-fluence of this MUFA on health [34, 35]. A previous study found that high levels of palmitoleic acid (C16:1, n-7) are associated with an increased risk of cardiovas-cular disease [34] and are positively associated with metabolic syndrome [35], including hypertriglyceridemia [34] and abdominal obesity [36]. In the present study, the weight-loss group, which presented significantly de-creased levels of palmitoleic acid (C16:1, n-7), showed greater reductions in serum TGs and waist circumfer-ence than the control group. Therefore, reduced levels of SFAs and MUFAs via calorie-restriction-induced weight and VFA loss might yield future health benefits.
One of the major points of the present study is the cor-relation of weight loss with a significant reduction of VFA. As discussed thus far, many changes observed in the weight-loss group of this study might be explained by the VFA change. However, there is controversy regarding whether visceral fat is more harmful to circulating fatty acids than subcutaneous fat. Jensen MD [37] reported that visceral fat is not a source of excess systemic free fatty acid availability; conversely, Björntorp P [38] concluded that vis-ceral fat tissue could be a significant source of free fatty acids that might exert complex metabolic effects. Indeed, several studies have suggested that large visceral fat depots flooded the liver and the systemic circulation in the form of free fatty acids [39, 40]. In addition, Klein S [41] observed that excess visceral fat is more harmful than excess sub-cutaneous fat because the lipolysis of TGs in visceral adi-pose tissue releases free fatty acids into the portal vein,
which directly delivers them to the liver. Nielsen et al. [42] demonstrated that the contribution of free fatty acids derived from visceral fat to the portal and systemic circula-tion increases with increases in the visceral fat mass. Be-cause evidence that supports our results exists, we believe that visceral fat is an important factor affecting the circulat-ing fatty acid profiles.
A limitation of this study is its small sample size. Add-itionally, our results might not be generalizable because the study subjects were limited to nondiabetic overweight Korean subjects. Finally, we did not exclude subjects who took a medication that affects lipid metabolism. Only two subjects in the control group took a lipid-lowering medi-cation; the clinical/biochemical parameters and fatty acid profiles did not show any significant differences between the control groups according to medication [n= 38 (original control group) vs. n= 36 (control group w/o medication)] (data not shown). In addition, the baseline value-adjusted statistical significance of the changed values between the control group without medication and the weight-loss group was identical to the present results (data not shown). Therefore, in this study, medication was not considered a confounding factor in interpreting the research results. Despite these limitations, this study dem-onstrates that a weight-loss intervention based on a hypo-caloric diet in overweight subjects with high visceral fat levels improved not only the anthropometric and bio-chemical parameters but also the fatty acids plasma levels.
Conclusions
An analysis of plasma fatty acid profiles identified signifi-cant decreases in palmitic acid (C16:0), stearic acid (C18:0), palmitoleic acid (C16:1), oleic acid (C18:1), eicosadienoic acid (C20:2, n-6), and dihomo-γ-linolenic acid (C20:3, n-6) as well as a decrease in C16Δ9-desaturase activity and an increase in Δ5-desaturase activity. These results suggest that maintenance of high VFA levels without treatment does not produce changes in the plasma fatty acid profiles, whereas even mild weight loss with reduced VFA improves the overall plasma fatty acid profile and desaturase activ-ities. Through enhancement of the plasma fatty acid pro-files, individuals may receive potential health benefits of reduced future risks of type 2 diabetes and cardiovascular disease. Moreover, eating behavior modification (mild calorie restriction) might be an effective therapy for the treatment of diseases such as type 2 diabetes and cardiovas-cular disease.
Abbreviations
BMI:Body mass index; BMR: Basal metabolic rate; BP: Blood pressure;
TEE: Total energy expenditure; TG: Triglyceride; VFA: Visceral fat adiposity; VSR: Visceral-to-subcutaneous area ratio
Acknowledgements Not applicable
Funding
This study was funded by the Bio-Synergy Research Project (NRF-2012 M3A9C4048762) and the Mid-Career Researcher Program (NRF-2016R1A2B4011662) of the Ministry of Science, ICT and Future Planning through the National Research Foundation, Republic of Korea and by grants from the Korean Health Technology R&D Project, Ministry of Health & Wel-fare, Republic of Korea (HI14C2686010116 and HI14C2686).
Availability of data and materials
The data that support the findings of this study are available on request from the corresponding author [JHL].
Authors’contributions
YJL contributed to the acquisition, analysis, and interpretation of the data and helped draft the manuscript. HJY, MK, and MK contributed to the analysis and interpretation of the data and helped draft the manuscript. AL contributed to the acquisition and analysis of the data. SHJ contributed to the conception and design of the study. DYS contributed to the acquisition of the data. JHL contributed to the conception and design of the study and to the analysis and interpretation of the data and helped draft the manuscript. All authors critically revised, read, and approved the final manuscript and agreed to be fully accountable for ensuring the integrity and accuracy of the work.
Ethics approval and consent to participate
The purpose of the study was carefully explained to all participants, and written consent was obtained prior to their participation. The protocol was approved by the Institutional Review Board of Yonsei University and Yonsei University Severance Hospital in accordance with the Helsinki Declaration.
Consent for publication Not applicable
Competing interests
The authors declare that they have no competing interests.
Publisher’s Note
Springer Nature remains neutral with regard to jurisdictional claims in published maps and institutional affiliations.
Author details
1
National Leading Research Laboratory of Clinical Nutrigenetics/Nutrigenomics, Department of Food and Nutrition, College of Human Ecology, Yonsei University, 50 Yonsei-ro, Seodaemun-gu, Seoul 03722, Korea.2Department of Food and Nutrition, Brain Korea 21 PLUS Project, College of Human Ecology, Yonsei University, 50 Yonsei-ro, Seodaemun-gu, Seoul 03722, Korea.3Research Center for Silver Science, Institute of Symbiotic Life-TECH, Yonsei University, 50 Yonsei-ro, Seodaemun-gu, Seoul 03722, Korea.4Department of Epidemiology and Health Promotion, Institute for Health Promotion, Graduate School of Public Health, Yonsei University, 50 Yonsei-ro, Seodaemun-gu, Seoul 03722, Korea.5Department of Internal Medicine, Severance Hospital, Division of Endocrinology and Metabolism, Yonsei University College of Medicine, 50-1 Yonsei-ro, Seodaemun-gu, Seoul 03722, Korea.
Received: 16 March 2017 Accepted: 8 January 2018
References
1. Katsuki A, Sumida Y, Urakawa H, et al. Increased visceral fat and serum levels
of triglyceride are associated with insulin resistance in Japanese
metabolically obese, normal weight subjects with normal glucose tolerance.
Diabetes Care. 2003;26:2341–4.
2. Hannukainen JC, Kalliokoski KK, Borra RJ, et al. Higher free fatty acid uptake in
visceral than in abdominal subcutaneous fat tissue in men. Obesity. 2010;18:261–5.
3. Bucci M, Borra R, Någren K, et al. Human obesity is characterized by defective fat
storage and enhanced muscle fatty acid oxidation, and trimetazidine gradually
counteracts these abnormalities. Am J Physiol Endocrinol Metab. 2011;301:E105–12.
4. Chaston TB, Dixon JB. Factors associated with percent change in visceral
versus subcutaneous abdominal fat during weight loss: findings from a
systematic review. Int J Obes. 2008;32:619–28.
5. Warensjö E, Ohrvall M, Vessby B. Fatty acid composition and estimated
desaturase activities are associated with obesity and lifestyle variables in
men and women. Nutr Metab Cardiovasc Dis. 2006;16:128–36.
6. Pan DA, Hulbert AJ, Storlien LH. Dietary fats, membrane phospholipids and
obesity. J Nutr. 1994;124:1555–65.
7. Akter S, Kurotani K, Sato M, et al. High serum phospholipid dihomo-γ
-linoleic acid concentration and lowΔ5-desaturase activity are associated
with increased risk of type 2 diabetes among Japanese adults in the Hitachi
health study. J Nutr. 2017;147:1558–66.
8. Poudel-Tandukar K, Sato M, Ejima Y, et al. Relationship of serum fatty acid
composition and desaturase activity to C-reactive protein in Japanese men
and women. Atherosclerosis. 2012;220:520–4.
9. Zhao L, Ni Y, Ma X, et al. A panel of free fatty acid ratios to predict the
development of metabolic abnormalities in healthy obese individuals. Sci Rep. 2016;6:28418.
10. Warensjö E, Rosell M, Hellenius ML, et al. Associations between estimated
fatty acid desaturase activities in serum lipids and adipose tissue in humans: links to obesity and insulin resistance. Lipids Health Dis. 2009;8:37.
11. Kishino T, Watanabe K, Urata T, et al. Visceral fat thickness in overweight
men correlates with alterations in serum fatty acid composition. Clin Chim
Acta. 2008;398:57–62.
12. Shin MJ, Hyun YJ, Kim OY, et al. Weight loss effect on inflammation and LDL
oxidation in metabolically healthy but obese (MHO) individuals: low
inflammation and LDL oxidation in MHO women. Int J Obes. 2006;30:1529–34.
13. Department of Agrofood Resources. 8th revision standard food composition
table. Suwon: Rural Development Administration; 2011.
14. Jung S, Lee YJ, Kim M, et al. Supplementation with two probiotic strains,
Lactobacillus curvatusHY7601 andLactobacillus plantarumKY1032, reduced
body adiposity and Lp-PLA2activity in overweight subjects. J Funct Foods.
2015;19:744–52.
15. Kim M, Kim M, Lee YJ, et al. Supplementation with nutrients modulating
insulin-like growth factor-1 negatively correlated with changes in the levels of pro-inflammatory cytokines in community-dwelling elderly people at risk
of undernutrition. J Hum Nutr Diet. 2017;30:27–35.
16. Kim M, Kim M, Lee YJ, et al. Effects ofα-linolenic acid supplementation in perilla
oil on collagen-epinephrine closure time, activated partial thromboplastin time
and Lp-PLA2activity in non-diabetic and hypercholesterolaemic subjects. J Funct
Foods. 2016;23:95–104.
17. Oshima Y, Rin S, Kita H, et al. The frequency of fish-eating could negatively
associate with visceral adiposity in those who eat moderately. J Nutr Sci
Vitaminol (Tokyo). 2015;61:426–31.
18. Kröger J, Schulze MB. Recent insights into the relation ofΔ5 desaturase and
Δ6 desaturase activity to the development of type 2 diabetes. Curr Opin
Lipidol. 2012;23:4–10.
19. Kröger J, Zietemann V, Enzenbach C, et al. Erythrocyte membrane
phospholipid fatty acids, desaturase activity, and dietary fatty acids in relation to risk of type 2 diabetes in the European prospective investigation into cancer
and nutrition (EPIC)-Potsdam study. Am J Clin Nutr. 2011;93:127–42.
20. Krachler B, Norberg M, Eriksson JW, et al. Fatty acid profile of the
erythrocyte membrane preceding development of type 2 diabetes mellitus.
Nutr Metab Cardiovasc Dis. 2008;18:503–10.
21. Patel PS, Sharp SJ, Jansen E, et al. Fatty acids measured in plasma and
erythrocyte-membrane phospholipids and derived by food-frequency questionnaire and the risk of new-onset type 2 diabetes: a pilot study in the European prospective investigation into cancer and nutrition (EPIC)-Norfolk
cohort. Am J Clin Nutr. 2010;92:1214–22.
22. Chow LS, Li S, Eberly LE, et al. Estimated plasma stearoyl co-a desaturase-1
activity and risk of incident diabetes: the atherosclerosis risk in communities
(ARIC) study. Metabolism. 2013;62:100–8.
23. Lee S, Kuk JL, Davidson LE, et al. Exercise without weight loss is an effective
strategy for obesity reduction in obese individuals with and without type 2
diabetes. J Appl Physiol (1985). 2005;99:1220–5.
24. Kopp HP, Krzyzanowska K, Möhlig M, et al. Effects of marked weight loss on
plasma levels of adiponectin, markers of chronic subclinical inflammation and
25. Decsi T, Molnár D, Koletzko B. Long-chain polyunsaturated fatty acids in
plasma lipids of obese children. Lipids. 1996;31:305–11.
26. Decsi T, Csábi G, Török K, et al. Polyunsaturated fatty acids in plasma lipids
of obese children with and without metabolic cardiovascular syndrome.
Lipids. 2000;35:1179–84.
27. Muhlhausler BS, Ailhaud GP. Omega-6 polyunsaturated fatty acids and the
early origins of obesity. Curr Opin Endocrinol Diabetes Obes. 2013;20:56–61.
28. Lorente-Cebrián S, Costa AG, Navas-Carretero S, et al. Role of omega-3 fatty
acids in obesity, metabolic syndrome, and cardiovascular diseases: a review
of the evidence. J Physiol Biochem. 2013;69:633–51.
29. Iggman D, Arnlöv J, Vessby B, et al. Adipose tissue fatty acids and insulin
sensitivity in elderly men. Diabetologia. 2010;53:850–7.
30. Kurotani K, Sato M, Ejima Y, et al. High levels of stearic acid, palmitoleic acid,
and dihomo-γ-linolenic acid and low levels of linoleic acid in serum
cholesterol ester are associated with high insulin resistance. Nutr Res. 2012;
32:669–675.e3.
31. Ntambi JM, Miyazaki M. Regulation of stearoyl-CoA desaturases and role in
metabolism. Prog Lipid Res. 2004;43:91–104.
32. Zong G, Ye X, Sun L, et al. Associations of erythrocyte palmitoleic acid with
adipokines, inflammatory markers, and the metabolic syndrome in
middle-aged and older Chinese. Am J Clin Nutr. 2012;96:970–6.
33. Guo X, Li H, Xu H, et al. Palmitoleate induces hepatic steatosis but
suppresses liver inflammatory response in mice. PLoS One. 2012;7:e39286.
34. Paillard F, Catheline D, Duff FL, et al. Plasma palmitoleic acid, a product of
stearoyl-coA desaturase activity, is an independent marker of triglyceridemia
and abdominal adiposity. Nutr Metab Cardiovasc Dis. 2008;18:436–40.
35. Warensjö E, Risérus U, Vessby B. Fatty acid composition of serum lipids
predicts the development of the metabolic syndrome in men. Diabetologia.
2005;48:1999–2005.
36. Gong J, Campos H, McGarvey S, et al. Adipose tissue palmitoleic acid
and obesity in humans: does it behave as a lipokine? Am J Clin Nutr.
2011;93:186–91.
37. Jensen MD. Is visceral fat involved in the pathogenesis of the metabolic
syndrome? Human Model Obesity. 2006;14:20S–4S.
38. Björntorp P. Metabolic difference between visceral fat and subcutaneous
abdominal fat. Diabetes Metab. 2000;26:10–2.
39. Björntorp P.“Portal”adipose tissue as a generator of risk factors for
cardiovascular disease and diabetes. Arterioscler Thromb Vasc Biol. 1990;
10:493–6.
40. Kissebah AH, Peiris AN. Biology of regional body fat distribution: relationship to
non-insulin-dependent diabetes mellitus. Diabetes Metab Rev. 1989;5:83–109.
41. Klein S. The case of visceral fat: argument for the defense. J Clin Invest.
2004;113:1530–2.
42. Nielsen S, Guo Z, Johnson CM, et al. Splanchnic lipolysis in human obesity.
J Clin Invest. 2004;113:1582–8.
• We accept pre-submission inquiries
• Our selector tool helps you to find the most relevant journal • We provide round the clock customer support
• Convenient online submission • Thorough peer review
• Inclusion in PubMed and all major indexing services • Maximum visibility for your research
Submit your manuscript at www.biomedcentral.com/submit