DOI 10.1007/s12651-012-0100-3 R E S E A R C H PA P E R
Sectoral differences in downward real wage rigidity:
workforce composition, institutions, technology and competition
P. Du Caju·C. Fuss·L. Wintr
Accepted: 4 January 2012 / Published online: 18 January 2012 © Institut für Arbeitsmarkt- und Berufsforschung 2012
Abstract This paper examines whether differences in wage rigidity across sectors can be explained by differences in workforce composition, wage-bargaining institutions, tech-nology and competition. We rely on a large administrative matched employer-employee dataset for Belgium over the period 1990–2002. Our results indicate that downward real wage rigidity is significantly higher for white-collar work-ers, lower for older workers and decreases with the level of earnings and bonuses. Beyond labour force composi-tion effects, we find that wages are more rigid in sectors with predominant centralised wage-setting at the sector level as opposed to firm-level agreements. Also, more
labour-The opinions expressed in this paper are solely our own and do not necessarily reflect the opinion of the National Bank of Belgium or the Central Bank of Luxembourg. We thank W. Dickens for providing us with the International Wage Flexibility Project (IWFP) estimation programmes. We also thank CIMIRe, the Datawarehouse Labour Market of the Belgian Social Security System and Statistics Belgium for giving us access to the individual datasets. We are grateful to M. Schweitzer, participants of the WDN meetings, CAED 2008 conference and AEA 2009 conference and our colleagues for fruitful discussions as well as anonymous referees for useful suggestions. The paper was prepared while Ladislav Wintr was working at the National Bank of Belgium.
P. Du Caju·C. Fuss
Research Department, National Bank of Belgium, 14, Bd. de Berlaimont, 1000 Brussels, Belgium L. Wintr (
)Economics and Research Department,
Central Bank of Luxembourg, 2, Bd. Royal, 2983 Luxembourg, Luxembourg
e-mail:[email protected] C. Fuss
Université Libre de Bruxelles 50, av. F.D. Roosvelet, 1050 Brussels, Belgium
intensive sectors and competitive sectors have more rigid wages.
Branchenspezifische Unterschiede
in der Abwärtsreallohnstarrheit: Arbeitskraftstruktur, Institutionen, Technologie und Wettbewerb
Zusammenfassung Dieser Artikel untersucht, ob die bran-chenspezifischen Unterschiede in der Lohnstarrheit durch Unterschiede in der Arbeitskraftstruktur, Tariflohnverhand-lung, Technologie und Wettbewerb hervorgerufen werden. Unsere Ergebnisse zeigen, personen- und firmenbezoge-nen Daten einer belgischen Sozialversicherungsstatistik von 1990 bis 2002 benutzend, dass die Abwärtsreallohnstarrheit höher für Angestellte, niedriger für ältere und besser verdie-nende Beschäftigte ist. Jenseits der durch die Arbeitskräf-tezusammensetzung bedingten Auswirkungen zeigen wir, dass Löhne in Branchen mit vorherrschend zentralisierter Lohnbildung auf Branchenebene im Vergleich zu Überein-künften auf Firmenebene eine höhere Lohnstarrheit aufwei-sen. Gleiches gilt für arbeits- und wettbewerbsintensivere Branchen.
Keywords Wage rigidity·Matched employer-employee data·Wage-bargaining institutions·Downward real wage rigidity
JEL Classification J31
1 Introduction
the factors underlying wage rigidity. A natural approach to detecting the sources of wage rigidity is a comparison be-tween the extent of wage rigidity across well-defined sam-ples, such as countries, individuals, or sectors. Relying on administrative matched employer-employee data, we show that sectoral differences in downward real wage rigidity are related not only to workforce composition but also to sector-specific characteristics like wage bargaining institu-tions, technology and competition. Among others, we find that after controlling for composition effects, firm-level col-lective agreements provide more wage flexibility than out-side agreements at the sector level. In addition, our results indicate that wage rigidity is higher in more labour-intensive and more competitive sectors.
The consequences of wage rigidity concern the real econ-omy as well as inflation dynamics. Macroeconomic theo-ries have singled out wage rigidity as a source of resis-tance to wage moderation and therefore as a cause of high and persistent unemployment (see e.g. Layard et al.1991). Moreover, it was suggested that rigid wages can be a cause of less frequent changes in prices of products with a high labour share (see Altissimo et al.2006; Álvarez et al.2006; Dhyne et al. 2006; Vermeulen et al. 2007). In turn, price stickiness leads to higher output and employment volatility in response to shocks.
The contribution of this paper is to investigate the deter-minants of (sectoral) wage rigidity using microeconomic es-timates. Labour market rigidities can differ substantially be-tween groups of workers and bebe-tween sectors of economic activity. Analysing differences across sectors makes it pos-sible to highlight relevant factors of wage rigidity. In par-ticular, sectors provide the appropriate aggregation level for product market competition and institutional arrangements on wage bargaining, which takes place primarily at the sec-tor level in Belgium.
It is worth looking at the main findings of some pre-vious studies, irrespective of the measure of wage rigid-ity/flexibility adopted, because the same factors may af-fect the degree of wage rigidity, whether nominal or real.1 First, cross-country analyses have highlighted the role of labour market institutions, such as unionisation, centralisa-tion, coordination and coverage of wage bargaining. Using a cross-country analysis, Dickens et al. (2007b) show that unionisation and collective bargaining coverage at the coun-try level are positively related to wage rigidity. The results in Clar et al. (2007) indicate that union density, centralisa-tion of wage bargaining and employment proteccentralisa-tion legisla-tion are negatively related to real wage flexibility. Coordina-tion of wage bargaining, which allows for internalisaCoordina-tion of the effects of wage changes on the economy, makes wages
1One exception is wage indexation that is commonly put forward to
discriminate between types of wage rigidity.
more responsive to labour market conditions and therefore increases real wage flexibility. Using industry-level data, Holden and Wulfsberg (2008) find that downward nominal wage rigidity is higher in countries where employment pro-tection legislation is stricter, union density higher and unem-ployment lower.
Second, differences in wage rigidity according to worker types were pointed out by Campbell (1997). He finds that wage flexibility, defined as the responsiveness of occupa-tional wages to aggregate unemployment, is higher for blue-collar workers than for white-blue-collar workers. The finding of lower downward wage rigidity for blue-collar workers is confirmed by Babecký et al. (2010) on the basis of survey data.
Third, the literature on wage rigidity involving a sec-toral dimension is rather limited. Asking professional wage-setters about the reasons for wage rigidity, Agell and Ben-marker (2007) find that the effects of firms’ profits on wages are important in manufacturing and skilled service sectors, and less important in unskilled services and in the pub-lic sector. They interpret this as an indication of incum-bent workers’ bargaining power and therefore as a possible source of rigidity. Campbell (1989,1991) provides measures of wage flexibility for the United States, Canada and France based on the response of sector-level wages to the aggregate unemployment rate and to sector-specific product demand. Among others, he finds that sectors with a larger percentage of blue-collar workers are characterised by a higher degree of wage flexibility. His results for the United States also in-dicate that wage flexibility is lower in more capital-intensive sectors.
In sum, the existing literature identifies several variables driving wage rigidity, such as those related to workers (e.g. occupation), the firm’s characteristics (size, sector), produc-tion technology (capital intensity), or labour market insti-tutions (for example, unionisation and wage bargaining). However, none of the studies mentioned above provides statistical tests of differences between the categories after controlling for the impact of labour force composition. The composition effects might be especially relevant at the sec-tor level, as some secsec-tors demand very specific labour skills. For instance, the construction sector employs a dispropor-tionate number of blue-collar workers. The aim of this pa-per is to evaluate the importance of labour force composi-tion, sector-specific characteristics such as firm size, capital intensity and competition, and sector-specific institutional features related to wage bargaining, for differences in wage rigidity across sectors. Messina et al. (2010) adopt a sim-ilar approach including a cross-country perspective, while we focus on the case of Belgium.
sector-level data. Du Caju et al. (2012) use the same dataset and show that there is virtually no downward nominal wage rigidity during this period in Belgium, a country with full automatic indexation of wages. For this reason, we focus on downward real wage rigidity (DRWR) which we esti-mate using the procedure developed by Dickens and Goette (2005).
The paper is organised as follows. Section2 describes relevant institutional features of the Belgian labour mar-ket and sector-specific characteristics, the dataset, as well as the methodology. Results are reported in Sect. 3. First, we show that the estimates of DRWR vary substantially across workers and sectors. Second, we examine differences across worker types and shed light on the importance of labour force composition. Next, we investigate additional factors explaining differences in DRWR between sectors, such as technology, institutions and competition. Section4
concludes.
2 Institutional background, data, and methodology
2.1 Institutional background
Some important institutional features of the labour market affect individual wages in Belgium, such as indexation and sector-level collective bargaining agreements, which can possibly be supplemented with agreements concluded at the firm level. These features explain why Belgium is charac-terised as a country with high real wage rigidity (see Dick-ens et al.2007bor Du Caju et al.2012). We briefly describe these characteristics of the Belgian labour market. Firstly, as in several countries, a minimum wage is legally bind-ing. Also, practically all employees’ gross wages are linked to a consumer price index through an automatic indexation mechanism.2This effectively limits the scope for real wage cuts.
Secondly, as in many other European countries, wages in Belgium are largely determined at the sector level, through agreements concluded in the so-called joint committees.3In many sectors, pay scales are set for blue-collar and white-collar workers separately. This may contribute to observed
2Specifically, the index considered is the consumer price index
exclud-ing alcoholic beverages, tobacco and motor fuels.
3They are called joint committees (‘commissions paritaires’) because
employers and employees are equally represented. As the notion of economic sector is sometimes very narrowly defined, the number of joint committees exceeds 100. The outcome of these sector-specific negotiations cannot undercut the legally determined guaranteed mini-mum wage. The actual minimini-mum pay by sector, occupation and some-times age or tenure, defined within joint committees, therefore exceeds the legally guaranteed minimum. There are some exceptions for work-ers less than 21 years old.
differences in wage dynamics for these types of workers. In-deed, in the joint committees for blue-collar workers, pay scales are primarily fixed in relation to the job description. Variations depending on age or length of service are not common. For white-collar workers, the pay scale usually varies not only according to category, but also depending on age or tenure.4The joint committees at the sector level are also the main bargaining unit for the negotiations on (real) collective wage increases. Quite often, these are defined as a rise in absolute terms of the (sometimes only minimum) pay scales, meaning that employees with wages above the scale can obtain a lower percentage collective wage increase.
In addition, firm-level agreements can complement sector-specific agreements. The negotiated wages in these firm-level agreements cannot be below the sectoral agreements.5 Also firm-level agreements are more common in large firms with stronger union representation than in smaller firms. Note that union representation is compulsory in firms with 50 employees or more. Firm-level collective wage agree-ments make it possible to take firm-specific features more closely into account in the wage-setting process. In Belgium, companies that do not have a firm-level agreement tend to stick to the sector agreement. Companies with a firm-level agreement generally pay more and have a more dispersed earnings structure. This provides them with a wage cushion above the sector minima, creating some margin of manoeu-vre for wage adjustments. Individual data from the Belgian Structure of Earnings Survey (SES) show that companies with firm-level agreements for blue-collar and white-collar workers pay on average 12% higher earnings and bonuses are 53% higher. Furthermore, the standard deviation of earn-ings is 2% larger, and that of bonuses is 16% larger in firms with firm-level agreements compared to companies with no firm-level agreement.
The Belgian wage formation model, with a dominant sector-level and additional firm-level bargaining is quite common among European countries (see Du Caju et al.
2009). Moreover, even if the Belgian indexation mechanism is particular, similar institutions are found in Spain, Luxem-bourg and Cyprus, and wages of close to one third of Euro-pean workers are subject to a formal or informal indexation mechanism (see Du Caju et al.2009; Babecký et al.2010
and Druant et al.2009).
2.2 Data
To measure downward real wage rigidity, we rely on an administrative employer-employee database on individual
4During the period under review, age-related pay scales were not
against European anti-discrimination rules and were applicable to the majority of Belgian white-collar workers.
labour earnings for Belgium, collected by the social secu-rity system. The data contain information on annual gross earnings (including bonuses and compensation for overtime hours), annual working days, age, sex and occupation cat-egory (blue-collar or white-collar). The dataset contains a sample of around one-third of workers in the private sector and covers the period 1990–2002. It includes all persons that were born between the 5th and the 15th day of any month, except those employed by firms with less than 5 employees or by self-employed people. The dataset covers all sectors of activity including services. We focus on firms active in branches with NACE codes from D to K, i.e. we exclude agriculture, extraction industries and non-commercial ser-vices.
We restrict the sample to workers above the legal mini-mum age of compulsory schooling and below the retirement age, i.e. men between 18 and 64 and women between 18 and 59. We also exclude earnings below the legal minimum wage and we drop the same number of observations from the upper tail of the distribution, in order to exclude outliers and possibly extreme variations in individual annual earn-ings. Finally, we restrict the sample to full-time permanent job stayers. Since the dataset does not report the type of con-tract (fixed-term or indeterminate length), we define these permanent job stayers as working at least 11 months for the same employer over two consecutive years. In this way, we allow permanent workers to have at most one month of sick leave (or other “abnormal” days off) per year, in order to distinguish them from temporary workers.
It is important to note that annual earnings include vari-able compensation components, such as bonuses, premia, and overtime hours. Not all of these are subject to automatic increases such as indexation and collectively bargained in-creases. Therefore, annual earnings may be more flexible than the base wage. Further, because the importance of extra wage components varies across workers, firms and sectors, these may explain differences of wage rigidity across sec-tors. For example, bonuses and premia may be higher for white-collar workers, older and higher-earnings employees, while compensation for overtime hours may be more com-mon for blue-collar workers.
Individual annual earnings data are used to estimate downward real wage rigidity by occupation, age category and sector. These rigidity measures are then related to three types of variables. The first set consists of variables related to worker type. This is the case of the occupation dummy that equals unity for blue-collar workers, and of age dum-mies that identify workers aged between 18 and 24 years, those between 25 and 44 years old, and those older than 45.6 We also consider the median level of earnings (by sector, age
6The thresholds are defined so as to have enough observations of
indi-vidual earnings changes in each category to estimate DRWR.
and occupational group and year), computed from the indi-vidual earnings dataset, and the median level of bonuses (by sector, age and occupational group), as reported in the four Structure of Earnings Survey (SES) waves between 1999 and 2002. Note that this variable includes compensation for overtime hours.
The second set of variables describes sectoral character-istics. From firms’ balance sheets, we define firm size as the median number of employees within each sector, and the labour ratio as the median firm-specific capital-labour ratio within each sector.7 Moreover, we estimate a measure of competition proposed by Boone et al. (2007), i.e. the elasticity of a firm’s profits with respect to its marginal costs, thereafter referred to as the profit elasticity. The intu-ition behind profit elasticity is that firms in less competitive sectors are not pure price takers, hence a given percentage increase in costs can be accommodated by a price rise, in turn leading to a smaller fall in profits. The profit elastic-ity is thus larger in more competitive environments. Using firm-level data for each branch, we regress log profits on log variable costs.8As a robustness test, we also consider two alternative measures of competition: the Herfindahl index which measures concentration within the sector, and sector-specific estimates of the price cost margin by Christopoulou and Vermeulen (2007). As argued in Boone et al. (2007), the three measures would correctly capture strengthened com-petition resulting from a fall in entry costs and a consequent increase in the number of firms. However, the Herfindahl index fails to capture any increase in competition that might cause inefficient firms to close down, because in such a case, concentration in the industry increases. It would neverthe-less be misleading to interpret this as a fall in competition. Further, the authors argue that empirical measures of the price-cost margin, such as the ratio of profits to sales, may be less suited in highly concentrated markets. The estimates of Christopoulou and Vermeulen (2007) rely on the estimation of structural equation, but they are time-invariant. Because the profit elasticity overcomes the drawbacks of the other measures and is time-varying, it is our preferred measure of competition.
Finally, the third type of variable refers to sectoral wage-bargaining practises, i.e. the coverage by collective wage
7The capital stock is computed on the basis of the perpetual inventory
method.
8More specifically, we regress the log of profits on the log of marginal
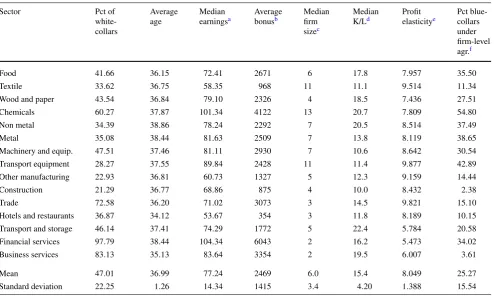
Table 1 Labour force composition, wages and sector characteristics—averages over time
Sector Pct of
white-collars
Average age
Median earningsa
Average bonusb
Median firm sizec
Median K/Ld
Profit elasticitye
Pct blue-collars under firm-level agr.f
Food 41.66 36.15 72.41 2671 6 17.8 7.957 35.50
Textile 33.62 36.75 58.35 968 11 11.1 9.514 11.34
Wood and paper 43.54 36.84 79.10 2326 4 18.5 7.436 27.51
Chemicals 60.27 37.87 101.34 4122 13 20.7 7.809 54.80
Non metal 34.39 38.86 78.24 2292 7 20.5 8.514 37.49
Metal 35.08 38.44 81.63 2509 7 13.8 8.119 38.65
Machinery and equip. 47.51 37.46 81.11 2930 7 10.6 8.642 30.54
Transport equipment 28.27 37.55 89.84 2428 11 11.4 9.877 42.89
Other manufacturing 22.93 36.81 60.73 1327 5 12.3 9.159 14.44
Construction 21.29 36.77 68.86 875 4 10.0 8.432 2.38
Trade 72.58 36.20 71.02 3073 3 14.5 9.821 15.10
Hotels and restaurants 36.87 34.12 53.67 354 3 11.8 8.189 10.15
Transport and storage 46.14 37.41 74.29 1772 5 22.4 5.784 20.58
Financial services 97.79 38.44 104.34 6043 2 16.2 5.473 34.02
Business services 83.13 35.13 83.64 3354 2 19.5 6.007 3.61
Mean 47.01 36.99 77.24 2469 6.0 15.4 8.049 25.27
Standard deviation 22.25 1.26 14.34 1415 3.4 4.20 1.388 15.54
aGross total daily earnings in euro bAnnual bonuses in euro cNumber of employees
dMedian capital-labour ratio measured in thousands of euro
eValues calculated for each branch and year. The table reports median over years fPercentage of blue-collar workers employed in firms with single-employer agreement
agreements at the sector or firm level. For Europe in gen-eral and Belgium in particular, this provides a much bet-ter indicator of union bargaining power than union mem-bership, for example. The reason is that, unlike in the US, wage agreements are negotiated between employers’ rep-resentatives and workers’ reprep-resentatives, but apply to all workers, regardless of whether they are unionised or not. As explained above, sector-level agreements apply generally in Belgium. As an indicator of decentralised wage setting, we calculate the average proportion over time (1999–2002) of workers covered by a firm-level wage agreement, from the SES dataset. Such agreements are expected to provide the firm with more flexibility than the sector-level agreements, as discussed above.
Table1 provides information on sectoral differences in the variables of interest.9 For example, the proportion of blue-collar workers is very large in the construction and
9The sample of firms considered to compute the median capital-labour
ratio and the median firm size is based on the Central Balance Sheet
other manufacturing sectors, and very low in financial and business services. Earnings and bonuses are particularly high in the chemical industry and in financial services. At the other extreme, earnings and bonuses are the low-est in the construction, and hotels and rlow-estaurants sec-tors. Turning to production characteristics, chemicals, non-metal manufacturing, transport storage and business ser-vices are capital-intensive sectors, while construction is the most labour-intensive industry. Firms are larger in chemi-cals, textiles and transport equipment industries, and smaller in services.
According to the profit elasticity, competition is fiercer in other manufacturing, transport equipment and trade and low in business, financial services and in transport and stor-age. Finally, it should be noted that decentralised
ing through firm-level agreements is much more widespread in the chemical industry and is essentially absent in the construction and business services, i.e. in sectors with cen-tralised bargaining.
2.3 Methodology
Alternative measures of wage rigidity have been proposed. In the extensive literature measuring wage rigidity/flexibility with macroeconomic data, wage flexibility is usually defined as the responsiveness of wages to economic fluctuations, of-ten proxied by the unemployment rate (see, for instance, La-yard et al.1991or the papers considered in Clar et al.2007). In addition, there is a growing volume of studies us-ing microeconomic data. One strand of this literature pro-poses measures of downward wage rigidity based on the idea that it implies a smaller response of wages to ad-verse shocks than to positive outcomes (see, for example, Altonji and Devereux 1999 or Biscourp et al. 2005). The concept is appealing because it takes into account the mo-tives to cut wages, but it is very demanding in terms of data as it requires information on relevant workers’ and firms’ characteristics. Others construct measures of wage rigidity from the evidence of small wage cuts and con-centration of wage changes around some natural reference point such as zero or the inflation rate (see Kahn 1997; Card and Hyslop 1997 or more recently, Dickens et al.
2007a,2007b).
In this paper, we follow the latter approach. One ad-vantage is that using a large dataset provides enough free-dom to evaluate DRWR for narrowly-defined samples. For example, we are able to estimate DRWR for young blue-collar workers in a given industry in a particular year. Al-though measures of wage flexibility can be obtained by regressing sector-level wage data (as in Campbell 1989,
1991) on aggregate unemployment and sector-level growth, it is more difficult to derive such measures for occupational groups since there is no natural proxy for economic condi-tions.
In this section, we first describe the methodology used to estimate DRWR. Then in order to investigate the determi-nants of the differences in DRWR across workers and sec-tors, we proceed in two steps. First, we estimate DRWR year by year for each group, defined either by occupation, age and sector, or simply by sector of economic activity. Second, we regress our measure of DRWR on a set of potential explana-tory variables.
2.3.1 Measuring downward real wage rigidity
Our measure of DRWR is based on the methodology de-scribed in Dickens and Goette (2005). This measure at-tempts to capture the fraction of workers who would not
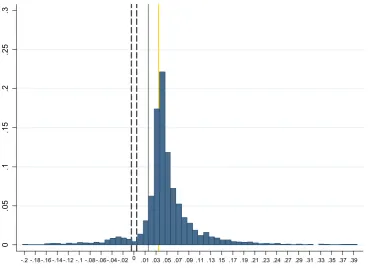
receive a real wage cut when they were due for one, no mat-ter what the reason for the wage cut. Briefly, the method is based on the comparison of the observed distribution of individual nominal wage changes with the notional distri-bution, i.e. the one that would prevail under perfect wage flexibility. The latter is assumed to be symmetric. On the contrary, downward wage rigidity typically generates asym-metry and spikes around the reference point. The refer-ence point for nominal wage rigidity is zero, and that for real wage rigidity may be expected inflation, possibly aug-mented with expected wage increases such as collectively agreed real wage increases. Wage changes that would have fallen below the reference point under perfect flexibility will appear at the reference point in the observed distribu-tion. Therefore, the observed distribution of individual wage changes will be characterised by fewer observations below the reference point than above it, i.e. it will be asymmet-ric. As an illustration, Fig.1below shows the histogram of earnings changes for textiles in 2002. The asymmetry of the distribution is quite clear, as is the concentration around the collective wage increase level, consistent with DRWR. The absence of spike or asymmetry around zero reveals a low level of DNWR.
The approach of Dickens and Goette (2005) has been applied within the International Wage Flexibility Project (Dickens et al.2007b), and more recently in the Wage Dy-namics Network (Du Caju et al.2012; Messina et al.2010). The method first corrects the observed distribution of indi-vidual wage changes for measurement errors, assuming that an observed wage cut that is compensated the year after with a wage increase constitutes a measurement error. Du Caju et al. (2012) show that measurement error is limited in the administrative data also used in this paper. Then, us-ing a Mixed Method of Moments estimator, one jointly es-timates the extent of DNWR, the level of DRWR, and the reference point for real wage rigidity. The notional distri-bution of wage changes under flexibility is assumed to fol-low a symmetric two-sided Weibull, with parameters that may change year by year and sector by sector (in Sect.3.2, by age and occupational group too). Note that the reference point of relevance for the estimation of DRWR is estimated by the model, rather than assumed at a given rate (e.g. ex-pected inflation).10 A fraction of the population is poten-tially subject to DRWR if their notional wage change falls below their reference point and if they will receive a wage change equal to this reference point, instead of the notional wage change.
10As explained in Du Caju et al. (2012), parameters describing the
Notes: Grey solid line shows the economy-wide CPI inflation while the yellow line is the economy-wide total collective wage increase
Fig. 1 Distribution of earnings changes for the textile industry in year 2002
The method we use offers several advantages. First, it simultaneously estimates measures of DNWR and DRWR. Second, the reference point for real wage rigidity, i.e. ex-pected inflation, is directly estimated from the data rather than provided by the econometrician based on outside es-timates. Third, the method takes into account measurement errors in the wage changes variable. Fourth, it requires only information on wage changes. However, because it is based on the estimated distribution of individual wage changes, it demands datasets with a large cross-section dimension. Among its drawbacks is the fact that identifying DRWR and DNWR becomes an issue in years with very low inflation, when the reference point for DRWR comes very close to zero, i.e. the reference point for DNWR.
The assumption of symmetry of the notional distribution is the basis for DRWR identification. Symmetry should be interpreted as reflecting the fact that, in the absence of down-ward wage rigidity, wage changes above the mean should be as likely as wage changes below the mean. Importantly, symmetry is not defined with respect to zero but with respect to the mean. This implies that, in the notional distribution, wage cuts may be more frequent than wage increases when the mean is negative, and vice versa when it is positive.
Another issue, related not only to the Dickens et al. (2007b) methodology but also to most procedures estimat-ing downward wage rigidity, concerns Elsby’s (2009) ar-gument. He argues that, under downward wage rigidity,
forward-looking firms will tend to limit the scope for wage increases because they will not be able to implement wage cuts in the future if necessary. In other words, downward wage rigidity generates upward wage rigidity. Clearly, with-out any additional theoretical assumption, it is not possible to identify the extent of upward rigidity. If Elsby’s argument applies, this would generate a downward bias in our esti-mates of downward wage rigidity. Provided the bias is of the same order of magnitude across categories, this does not invalidate our evaluation of the differences in DRWR across sectors or workers.
2.3.2 Explaining differences in DRWR across sectors
We test for differences across worker types and sectors by regressing the estimates of DRWR on several explanatory variables.
communication (post and telecommunications) because the estimates of DRWR are not reliable.11
We perform two types of analysis. First of all, we test for significant differences in DRWR across workers. Sec-ondly, we examine factors that explain differences in DRWR across sectors. In the first case, we estimate DRWR for each year, occupational group, age group and sector. Formally, we denote the estimates of downward real wage rigidity as DRWRkajt, wherekstands for occupation category,afor age category, while the sector is represented by the subscriptj and the year byt. The regression equations that we estimate take the following form:
DRWRkajt=αt+β1Dwhite-collarkajt
+β2Dage: 25–44kajt+β3Dage: 45+kajt
+β4Xkajt+εkajt, (1) where αt is a time-varying constant, D indicates that the
variable is a dummy andXkajt stands for a continuous ex-planatory variable, like earnings or bonuses.
In the second case, in order to analyse the impact of technology, competition and bargaining institutions on dif-ferences in DRWR across sectors controlling for workforce composition, we follow the same idea as above, except that we now estimate DRWR only across 15 sectors and over 13 years. Similar to (1), we regress these estimates of DRWR on control variables for workforce composition—the aver-age aver-age of workers and the percentaver-age of blue-collar work-ers, both defined by sector and year—and consider the effect of each explanatory variableXj t on its own:
DRWRj t=αt+β1agej t+β2blue-collarj t
+β3Xj t+εj t, (2)
whereXj t stands for variables capturing capital intensity,
competition, average firm size or firm-level agreement cov-erage.
Finally, we combine all the explanatory variables into a single model along the following lines:
DRWRj t=αt+β1agej t+β2blue-collarj t+β3sizej t
+β4K/Lj+β5profit elasticityj t
+β6firm-level agr. coveragej t+εj t, (3)
where K/L is the capital-labour ratio, profit elasticity is our preferred measure of competition and firm-level agr. cover-age stands for the percentcover-age of blue-collar workers covered by firm-level collective agreements.
Since our dependent variable can only take values be-tween 0 and 1, its predicted values estimated by OLS could fall outside the unit interval. Papke and Wooldridge
11Energy and post and telecommunications are two sectors with the
highest number of estimates of DRWR that ended up on the boundary and include both the values of one and zero.
(1996) discuss alternative estimation methods for models with a fractional dependent variable and develop the so-called fractional logit model, estimated by the quasi-ML (QML) method. Below, we report the marginal effects eval-uated at sample averages of x.
3 Results
3.1 Estimates of downward real wage rigidity
Table2presents the average values of DRWR for the sectors and worker categories considered in this paper. The average DRWR across sectors, equal to 0.58, points towards strong downward real wage rigidity in Belgium. By way of com-parison, Messina et al. (2010) report estimates of DRWR for Denmark, Spain and Portugal equal to 0.29, 0.37 and 0.22, respectively. Estimates reported in Dickens et al. (2007b) range from below 0.05 for Greece and the United States to 0.52 for Sweden.
Our point estimates imply that the estimated fraction of white-collar workers subject to DRWR is 10 percentage points higher than that of blue-collar workers. Campbell (1997) reports evidence for the US where nominal wage rigidity is more prevalent, showing that nominal wages of white-collar workers are much less responsive to the aggre-gate unemployment rate than blue-collar workers’ wages. This result is consistent with the shirking model of Shapiro and Stiglitz (1984) and with the turnover model of Stiglitz (1974). These models are based on the idea that firms may be less inclined to cut wages of white-collar workers because they are more difficult (costly) to replace and to monitor, and therefore are more likely to shirk their jobs. Franz and Pfeif-fer (2006) report survey evidence for Germany indicating that the main reasons for wage rigidity of high-skilled work-ers are the existence of specific skills and the negative signal a wage cut may represent for newly-hired staff. In Belgium, in addition, white-collar workers obtain automatic wage in-creases with age or tenure, while this is rarely the case for blue-collar workers. This makes white-collar workers less likely to experience real wage cuts.
Table 2 Estimates of DRWR
Category Average DRWR St. dev.
Blue-collar workers 0.580 0.261
White-collar workers 0.641 0.213
Workers aged 18–24 years 0.630 0.217
Workers aged 25–44 years 0.593 0.230
Workers older than 44 years 0.612 0.265
Food (food products, beverages and tobacco) 0.526 0.126
Textile (textiles, textile products, leather and footwear) 0.600 0.178
Wood and paper (wood and products of wood and cork, and pulp, paper, paper products, printing and publishing)
0.648 0.108
Chemicals (chemical, rubber, plastics and fuel products) 0.467 0.173
Non-metal (other non-metallic mineral products) 0.483 0.101
Metal (basic metals and fabricated metal products) 0.553 0.142
Machinery and equip. 0.618 0.081
Transport equipment 0.517 0.115
Other manufacturing (manufacturing n.e.c., recycling) 0.681 0.277
Construction 0.801 0.239
Trade (wholesale and retail trade, repair) 0.648 0.188
Hotels and restaurants 0.590 0.214
Transport and storage 0.354 0.145
Financial services (financial intermediation) 0.627 0.195
Business services (real estate, renting and business activities) 0.668 0.114
Entire sample (av. over sectors) 0.581 0.193
Notes: DRWR estimated by the IWFP procedure, see Sect.2. Results for sectors are averaged over years and the entire sample is the average over sectors and years. Results for occupational categories and age categories were obtained as averages from estimates of DRWR varying across occupation, age, sectors and years
The estimates of DRWR across sectors highlight substan-tial variation; DRWR ranges from 0.35 to 0.80. The highest DRWR is observed in the following sectors: construction, business services, trade, and wood and paper. Sectors with the lowest degree of DRWR are transport and storage and chemicals. Below, we consider a range of factors that can explain these differences in DRWR across workers and sec-tors.
3.2 Workforce characteristics and composition effects In Table3, we first test formally whether there are differ-ences in DRWR across workers and then consider the impact of payroll policies on the level of DRWR.
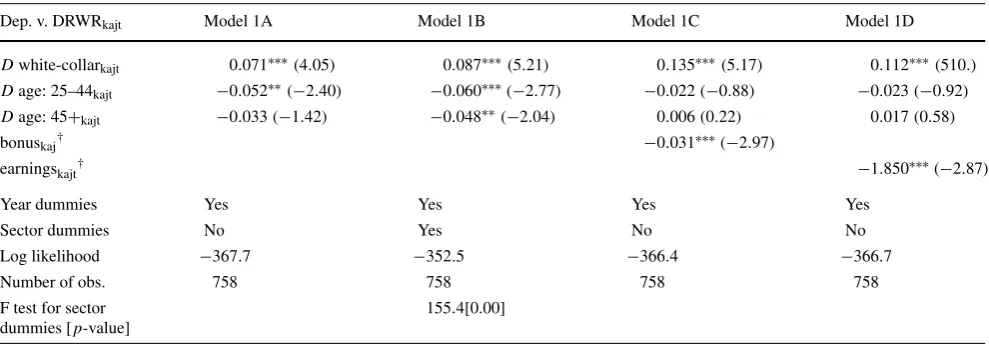
Model 1A in Table3 shows that the earnings of white-collar workers are significantly more rigid than those of blue-collar workers. DRWR is highest for workers aged be-tween 18 and 24 years, however, the difference bebe-tween the youngest and oldest worker category is not statisti-cally significant. One particular reason is that coefficients in Model 1A reflect both the variation in DRWR across sec-tors and within secsec-tors. In Model 1B we add sector dum-mies, thus effectively removing the variation across sectors,
and conclude that workers between 18 and 24 years have a significantly higher degree of rigidity than the remaining two categories when only the variation within sectors is con-sidered. The increase in the log likelihood in Model 1B, as compared to Model 1A, suggests that sector-specific factors contribute to explaining DRWR beyond the effects of occu-pation and age. The F-test for equality of the sector dummies in Model 1B concludes that the differences across sectors are statistically significant.
As discussed in Sect.2.1, one of the reasons why younger workers may have more rigid wages is that the fraction of labour compensation due to flexible components such as bonuses and premia is typically smaller for younger peo-ple. Because these can be easily cut, earnings should be less rigid the larger the bonuses. Indeed, Models 1C and 1D show that DRWR is lower for worker categories and sectors with higher bonuses and earnings.12 This is consistent with the survey evidence in Druant et al. (2008). The authors re-port that the majority of firms would adjust remuneration by
12These results are robust to considering the average earnings and the
Table 3 Estimates of fractional logit, (1), DRWR per year, occupation, age category and sector, marginal effects
Dep. v. DRWRkajt Model 1A Model 1B Model 1C Model 1D
Dwhite-collarkajt 0.071∗∗∗(4.05) 0.087∗∗∗(5.21) 0.135∗∗∗(5.17) 0.112∗∗∗(510.) Dage: 25–44kajt −0.052∗∗(−2.40) −0.060∗∗∗(−2.77) −0.022(−0.88) −0.023(−0.92) Dage: 45+kajt −0.033(−1.42) −0.048∗∗(−2.04) 0.006(0.22) 0.017(0.58)
bonuskaj† −0.031∗∗∗(−2.97)
earningskajt† −1.850∗∗∗(−2.87)
Year dummies Yes Yes Yes Yes
Sector dummies No Yes No No
Log likelihood −367.7 −352.5 −366.4 −366.7
Number of obs. 758 758 758 758
F test for sector dummies [p-value]
155.4[0.00]
Notes: The constant, year dummies and sector dummies are not reported to save space
†Measured in thousands of euro
∗/∗∗/∗∗∗indicate significance at the 0.10, 0.05 and 0.01 level, respectively; robustz-statistics in brackets
cutting the variable component of remuneration if they de-cided to reduce pay in response to adverse economic shocks. Further, when bonuses are included in Model 1C, age dum-mies are no longer significant. In the same vein, DRWR is lower for higher-earning categories. Besides the argument related to bonuses and premia, another explanation is that low wages are close to the institutional minimum wage or to sectoral pay scales and therefore cannot be reduced freely. In other words, the wage cushion over and above the sectoral minima is smaller for this type of workers, which constraints wage flexibility.
In sum, we have shown that earnings of white-collar workers and workers between 18 and 24 years are signif-icantly more rigid than those of blue-collar workers and older workers. Further, age-related aspects may explain dif-ferences across workers rather than inter-sectoral difdif-ferences in DRWR. The results also suggest that sector-specific fac-tors should contribute to explaining DRWR beyond the ef-fects of occupation and age. Finally, as expected, bonuses and higher earnings generally tend to lower downward real wage rigidity.
3.3 Sector-specific factors driving DRWR: technology, competition and institutions
In order to analyse additional factors that drive differences in DRWR across sectors, we consider a dataset that varies only across sectors and over time. We focus on variables that are independent of firms’ pay policies such as competition indi-cators, capital intensity and firm-level agreement coverage.
3.3.1 Technology, competition and institutions one by one
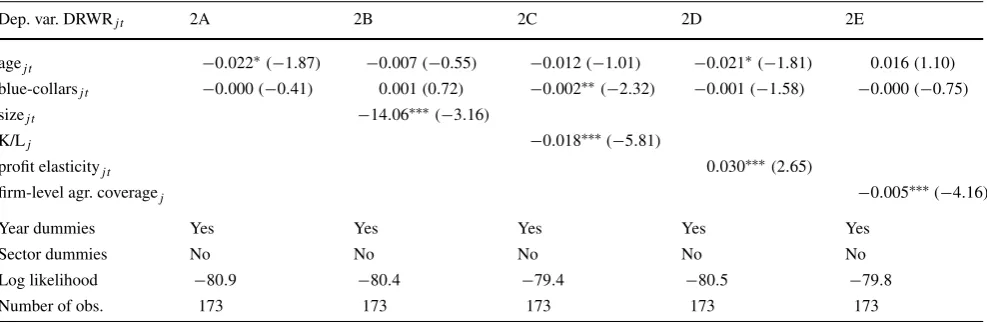
Marginal effects of QML estimators of (2), shown in Ta-ble 4, reveal that average age and the percentage of blue-collar workers are not statistically significant in most cases. Combined with our previous results presented in Table3, we can conclude that earnings of older workers and blue-collar workers are less rigid, whatever the sector of economic ac-tivity. These features explain differences in DRWR across workers rather than differences across sectors.
Next, we examine whether the median firm size within the sector affects wage rigidity. This may occur through sev-eral channels. Union representation is compulsory in firms with more than 50 employees in Belgium, which may ease the negotiation of wage concessions in adverse times. Also, larger firms typically have more complex compensation structures, offer higher but also more dispersed wages,13 and possibly a larger amount of extra wage components. Also they are more likely to sign firm-level agreements, which allow for a more flexible wage policy than the sectoral agreements. In smaller firms, earnings are lower and more likely to be bounded by minima collectively agreed outside the firm. On the contrary, in larger firms, the wage cush-ion above the sector-level agreement provides some margin for earnings cuts. Model 2B in Table4confirms these argu-ments. DRWR is significantly lower in sectors with larger firms, all else equal.
13This is also the case in our sample. For example, the average
Table 4 Estimates of fractional logit, (2), DRWR per year and sector, marginal effects
Dep. var. DRWRj t 2A 2B 2C 2D 2E
agej t −0.022∗(−1.87) −0.007(−0.55) −0.012(−1.01) −0.021∗(−1.81) 0.016(1.10)
blue-collarsj t −0.000(−0.41) 0.001(0.72) −0.002∗∗(−2.32) −0.001(−1.58) −0.000(−0.75)
sizej t −14.06∗∗∗(−3.16)
K/Lj −0.018∗∗∗(−5.81)
profit elasticityj t 0.030∗∗∗(2.65)
firm-level agr. coveragej −0.005∗∗∗(−4.16)
Year dummies Yes Yes Yes Yes Yes
Sector dummies No No No No No
Log likelihood −80.9 −80.4 −79.4 −80.5 −79.8
Number of obs. 173 173 173 173 173
Notes: The constant and year dummies are not reported to save space; agej tis the average age of workers; blue-collarsj tis the percentage of
blue-collar workers; sizej tis the average size of firms, measured in thousands of employees; K/Lj is the capital-labour ratio, measured in thousands
of euro; profit elasticityj tis our preferred measure of competition; firm-level agr. coveragejis the percentage of blue-collar workers covered by firm-level collective agreements
∗/∗∗/∗∗∗indicate significance at the 0.10, 0.05 and 0.01 level, respectively; robustz-statistics in brackets
We also study whether production technology and mar-ket competition are related to DRWR. First, introducing the median capital-labour ratio for each sector in Model 2C indicates that labour-intensive sectors have higher DRWR. Note that labour-intensive sectors such as construction, tex-tiles and transport equipment, for example, also have a larger proportion of blue-collar workers (see Table1), whose wages are less rigid. Table 4 shows that capital intensity is negatively related to DRWR after controlling for labour force composition. Our results contrast with the findings of Campbell (1991), who reports a negative correlation be-tween sector-level wage flexibility and the capital-labour ra-tio in the US. But they are consistent with the finding in Fuss (2009) that, in Belgium, wage cuts in adverse times are largely non-existent in the construction sector (the most labour-intensive) contrary to the manufacturing and services sectors. Also, our finding that wage rigidity is stronger in labour-intensive sectors complements the view that the higher degree of price stickiness observed in more labour-intensive sectors might result from wage rigidity, see Al-tissimo et al. (2006), Álvarez et al. (2006), Dhyne et al. (2006) and Vermeulen et al. (2007).14
In Model 2D, we report results for competition measured as the profit elasticity proposed by Boone et al. (2007) and estimated at the sector level. Controlling for age and
oc-14Our measure of DRWR is negatively related to the sector-specific
fre-quency of monthly producer price changes in the manufacturing sector, computed as in Cornille and Dossche (2008). This suggests that sectors with higher DRWR also experience higher price rigidity. The correla-tion coefficient between DRWR and the frequency of producer price change reaches−0.67. We thank M. Dossche for providing us with the estimates of the frequency of producer price change.
cupation, our estimates indicate that sectors with stronger competition experience higher DRWR. One potential ex-planation is related to wage-bargaining practises. Firm-level wage agreements are more common in sectors where firms are large and have higher market power and where company unions try to appropriate the rents. Firm-level agreements are far less common in sectors with small competitive firms. In this case, the main objective of unions is rather egalitarian as they are trying to avoid a wage race to the bottom; they are mainly organised at sectoral level in order to negotiate equal pay within the sector.15
Finally, we examine whether differences in decentralisa-tion of wage bargaining across sectors influence DRWR. In the literature, wage-bargaining institutions have been cited as a cause of differences in downward wage rigidity across countries. Dickens et al. (2007b), Holden and Wulfsberg (2008) and Messina et al. (2010) relate higher wage rigid-ity to higher union densrigid-ity and/or bargaining coverage. In the context of our paper, we examine whether sectoral dif-ferences in the wage-bargaining mechanism are related to sectoral differences in wage rigidity.
As mentioned above, inter-sectoral coordination prac-tises and indexation mechanisms are largely determined at the national level. These are common to all sectors. Beyond this, sector-level collective wage bargaining plays a domi-nant role in wage-setting practises. On top of these, other
15Our finding of a positive relationship between product market
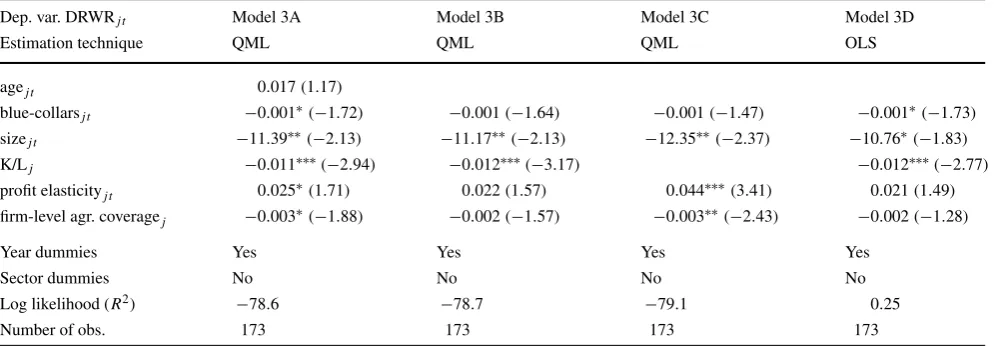
Table 5 Estimates of (3), DRWR per year and sector
Dep. var. DRWRj t Model 3A Model 3B Model 3C Model 3D
Estimation technique QML QML QML OLS
agej t 0.017(1.17)
blue-collarsj t −0.001∗(−1.72) −0.001(−1.64) −0.001(−1.47) −0.001∗(−1.73)
sizej t −11.39∗∗(−2.13) −11.17∗∗(−2.13) −12.35∗∗(−2.37) −10.76∗(−1.83)
K/Lj −0.011∗∗∗(−2.94) −0.012∗∗∗(−3.17) −0.012∗∗∗(−2.77)
profit elasticityj t 0.025∗(1.71) 0.022(1.57) 0.044∗∗∗(3.41) 0.021(1.49)
firm-level agr. coveragej −0.003∗(−1.88) −0.002(−1.57) −0.003∗∗(−2.43) −0.002(−1.28)
Year dummies Yes Yes Yes Yes
Sector dummies No No No No
Log likelihood (R2) −78.6 −78.7 −79.1 0.25
Number of obs. 173 173 173 173
Notes: The constant and year dummies are not reported to save space; agej tis the average age of workers; blue-collarsj tis the percentage of
blue-collar workers; sizej tis the average size of firms, measured in thousands of employees; K/Ljis the capital-labour ratio, measured in thousands of
euro; firm-level coll. coveragej is the percentage of blue-collar workers covered by firm-level collective agreements
∗/∗∗/∗∗∗indicate significance at the 0.10, 0.05 and 0.01 level, respectively;t-statistics in brackets
bargaining characteristics, such as the proportion of firms with firm-level agreements, vary across sectors. As men-tioned above, firm-level agreements lead to higher wages on average, as well as wider wage dispersion across firms because such agreements can better take into account firm-specific characteristics in the determination of wages.16 In addition, according to Cardoso and Portugal (2005), a higher average wage and wider wage dispersion within firms pro-vide employers with a flexible wage cushion above the sec-toral minima, leaving these firms with a wider range of options in their wage-setting policy, i.e. allowing a greater role for workers’ and firms’ characteristics in remuneration. This, in turn, is expected to reduce downward real wage rigidity. This prediction is confirmed in Model 2E in Ta-ble4. Downward real wage rigidity is lower in sectors with a higher proportion of workers covered by a firm-level wage agreement.
3.3.2 Technology, competition and institutions in one model
Table5combines the explanatory variables discussed so far into a single model. It has already been suggested that the variables might be collinear which would give rise to impre-cise estimates of the coefficients in (3). For example, larger firms typically offer higher and more dispersed wages. And companies with firm-level agreements are generally larger,
16See Card and de la Rica (2006), Cardoso and Portugal (2005),
Dell’Aringa and Lucifora (1994), Hibbs and Locking (1996), Palen-zuela and Jimeno (1996) and Rycx (2003) for Belgium.
and pay higher wages. As before, we omit from the model the earnings level and bonuses.
The significant variables in Model 3A in Table5 have the predicted sign and the values of the coefficients are of the same order of magnitude as in Table4. Only the average age is insignificant at the 10 percent level and hence we ex-clude it from the remaining models. Profit elasticity turns marginally insignificant in Model 3B (p-value of 0.115). Model 3C suggests that this may be due to its correlation with the capital-labour ratio. Indeed, as shown in Table1, profit elasticity is higher, i.e. competition is stronger, in less capital-intensive sectors.
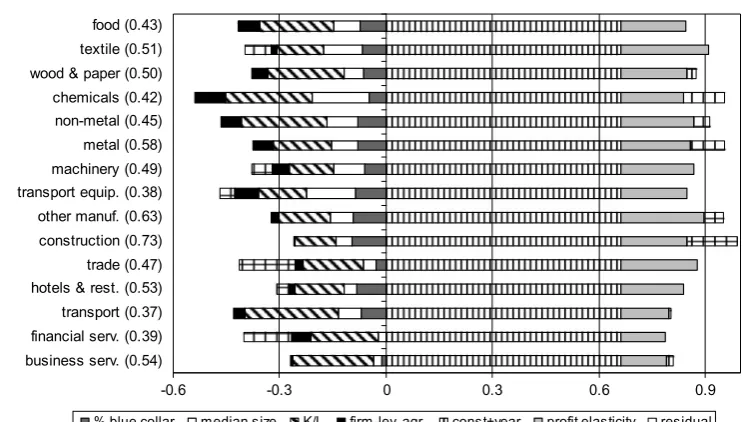
In order to highlight the contribution of each variable for the variation of DRWR across sectors, we estimate Model 3B by OLS in column 3D with OLS.17 Table5shows that the differences between the estimated coefficients and sig-nificance levels of Models 3B and 3D are very small. Fig-ure2uses the estimated coefficients from Model 3D and re-ports the contribution of each variable to the sector-specific DRWR in the last year of our sample.
Let us first compare construction and chemicals, sectors that show the highest and one of the lowest values of DRWR in Table2 (0.80 and 0.47, respectively). This gap may be attributed essentially to the difference in capital intensity, firm size and firm-level agreement coverage. As shown in Table1, the chemical industry has one of the highest capital-labour ratios, the highest median firm size and the high-est firm-level agreement coverage, while the opposite holds
17The contribution of each factor to the observed DRWR cannot be
Fig. 2 Decomposition of
factors explaining DRWR based on Model 3D, year 2002
true for construction. As suggested by our estimates in Ta-ble5, the higher the values of these variables, the lower the DRWR. These factors explain why DRWR is much higher in construction than in chemicals, despite the fact that con-struction has a disproportionately high percentage of blue-collar workers, while chemicals has an average proportion of blue-collar workers in its workforce.
Financial and business services have similar degrees of predicted DRWR (0.521 and 0.524, respectively) and both services sectors employ a very high proportion of white-collar workers. In spite of these similarities, they differ in that business services are characterised by higher capital in-tensity and financial services by higher firm-level agreement coverage. Figure2also documents that our model cannot ex-plain why the observed DRWR in financial services (0.39) was substantially lower than in business services (0.54) in 2002.
Figure2shows that most DRWR is common to all sec-tors, and that variations across sectors are largely due to fac-tors such as workforce composition, capital intensity and the degree of competition on the product market. Importantly, our results point out the role of firm-level wage bargaining in dampening wage rigidity, even though, Fig.2reveals that this accounts for only a small fraction of DRWR.
Finally, our results are robust along several lines. For the sake of brevity, we do not report these results but they can be obtained from the authors on request. First, all the mod-els estimated in Tables 1 to 5 yield very similar coefficients and significance levels when estimated by OLS. Second, our main results hold also for non-linear specifications of (2) and (3) which divide the explanatory variables into categories delimited by the 33rd and 66th percentile. Third, two-stage
estimates of Model 3D that take into account potential endo-geneity of the profit elasticity measure lead to the same qual-itative results. Fourth, our conclusions concerning competi-tion based on profit elasticity do not always hold for other common measures of competition (Herfindahl index, price-cost margin).
4 Conclusion
Wage rigidity has important consequences at both the mi-croeconomic and mami-croeconomic level. When wages are rigid, they no longer evolve hand in hand with productiv-ity developments and interfere with efficient allocation of resources. Downward wage rigidity is considered as one of the causes of unemployment and price stickiness in Eu-rope. These findings have led to wide empirical literature on the evaluation of wage rigidity, based on macroeconomic, sector-level or, more recently, microeconomic data. The driving factors behind wage rigidity have seldom been in-vestigated, but a better understanding of them can be gained simply by comparing the situation in different countries or sectors, for example.
This paper examines whether differences in wage rigid-ity across sectors can be explained by differences in work-force composition, competition, technology and wage-bargaining institutions, based on a large administrative matched employer-employee dataset for Belgium over the period 1990–2002.
workers and younger workers. Further, firms’ pay policy also affects the degree of DRWR. Indeed worker categories with higher earnings and bonuses are characterised by lower DRWR, conditional on their occupation and age category.
Second, we have focused on the variation in DRWR across sectors. Our estimates of DRWR show that there are substantial differences in DRWR across sectors. DRWR ranges from 0.35 in transport and storage and less than 0.50 in the chemicals and non-metal industries to 0.80 in con-struction. Controlling for workforce composition, we find that wages are more rigid in smaller firms, in more compet-itive sectors and in labour-intensive sectors. Lastly, the im-pact of labour market institutions on DRWR has been taken into consideration as a way of capturing the decentralisa-tion of wage bargaining. Our findings suggest that sectors with more centralised wage formation (i.e. with lower firm-level agreement coverage) have higher DRWR. Given the predominant role of sector-level collective wage bargaining in wage-setting practises in Belgium, this indicates that firm-level collective agreements tend to enhance wage flexibility by creating a wage cushion above the sectoral minima and by taking closer account of firm-specific situations in wage determination.
Kurzzusammenfassung
Es gibt eine umfassende Literatur, die sich mit der Frage der makroökonomischen Auswirkungen der Lohnrigidität beschäftigt. In nur wenigen Schriften wurden hingegen die der Lohnrigidität zugrunde liegenden Faktoren untersucht. Um diese Lücke zu schließen, vergleichen wir den Grad der Lohnrigidität für die verschiedenen Arbeitnehmer und Sektoren. So kann man z. B. aus einer ganzen Reihe von Gründen davon ausgehen, dass Arbeiterlöhne weniger rigi-de sind als die Angestelltengehälter. Die Sektoren bieten die geeignete Aggregationsebene für den Produktmarktwettbe-werb und institutionelle Regeln für Lohnverhandlungen, die in Belgien in erster Linie auf Sektorebene erfolgen. Eine Reihe von länderübergreifenden Analysen legen nahe, dass es einen Zusammenhang zwischen dem gewerkschaftlichen Organisationsgrad, der Zentralisierung der Tarifverhandlun-gen und dem landesweiten Deckungsgrad der Tarifverträ-ge mit der Lohnrigidität gibt. In dieser Schrift prüfen wir die Bedeutung der Lohnverhandlungen auf Sektorebene als Erklärung für die Lohnrigidität in den einzelnen Sektoren. Nach einer Kontrolle der Auswirkungen der Zusammenset-zung der Arbeitskräfte testen wir insbesondere formell das Vorhandensein von Unterschieden in der Lohnrigidität zwi-schen den Sektoren. Ferner evaluieren wir, welche Bedeu-tung die Zusammensetzung der Arbeitskräfte, sektorspezifi-sche Eigenschaften wie Unternehmensgröße, Kapitalinten-sität und Wettbewerb, sowie sektorspezifische institutionel-le Merkmainstitutionel-le in Bezug auf die Lohnverhandlungen für die
Unterschiede in der Lohnrigidität in den einzelnen Sektoren haben.
Der Analyse liegt ein ausgedehnter paariger Verwal-tungsdatensatz für Arbeitgeber und Arbeitnehmer im Zeit-raum 1990–2002 in Belgien zugrunde, der auf Unterneh-mensebene mit zusätzlichen Bilanzdaten sowie Daten der Sektorebene ergänzt wird. Wir betrachten Unternehmen mit fünf Mitarbeitern und mehr in der verarbeitenden Industrie, dem Dienstleistungssektor und der Bauwirtschaft. Da Belgi-en durch eine sehr geringe absteigBelgi-ende Rigidität des Nomi-nallohns gekennzeichnet ist, die der vollen automatischen Preissteigungsanpassung der Löhne entspricht, konzentrie-ren wir uns auf die Rigidität der Reallöhne. Nach unten ge-richtete Lohnrigidität ist definiert als der Teil der Arbeitneh-mer, für die ein Reallohnstopp eintreten würde, wenn für sie eine Kürzung ihres Reallohns vorgesehen würde. Sie wird nach dem von Dickens und Goette (2005) entwickelten Ver-fahren geschätzt.
Die von uns erhaltenen Ergebnisse weisen auf wesent-liche Unterschiede zwischen den Arbeitnehmern hin. Für Angestellte, jüngere Arbeitnehmer und Arbeitnehmer mit geringeren Einkommen und Zulagenzahlungen ist die nach unten gerichtete Reallohnrigidität höher. Diese Ergebnisse lassen sich vielleicht durch ein höheres Risiko der Faulheit und höhere Einstellungskosten für Angestellte erklären so-wie durch das Vorhandensein automatischer altersbedingter Lohnerhöhungen für die meisten Angestellten in Belgien. Jüngere Arbeitnehmer neigen eher dazu, bei Lohnkürzungen ihren Job zu verlassen, erhalten aber auch geringere Zulagen und Prämien.
Auch zwischen den Sektoren gibt es maßgebliche Un-terschiede in der nach unten gerichteten Lohnrigidität. Wir kommen zu dem Ergebnis, dass die nach unten gerichte-te Lohnrigidität höher ist in Sektoren mit (i) einem hohen Anteil von Angestellten, (ii) größeren Unternehmen, (iii) arbeitsintensiveren Produktionstechniken, (iv) einem stär-ken Wettbewerb auf dem Produktmarkt, (v) zentralisierte-ren Lohnverhandlungen. Für ein korrektes Verständnis des zuletzt genannten Ergebnisses, sollte angemerkt werden, dass sektorweite Lohnvereinbarungen sehr weit verbreitet sind und in Belgien einen hohen Deckungsgrad haben. In diesem Kontext könnten Lohnverhandlungen auf Unterneh-mensebene, die den firmenspezifischen wirtschaftlichen Be-dingungen besser gerecht werden, eine Mäßigung der Löhne in widrigen Zeiten erleichtern.
Executive summary
the extent of wage rigidity across workers and across sec-tors. For a number of reasons, it is expected that blue-collar workers have less rigid wages than white-collar workers, for instance. Sectors provide the appropriate aggregation level for product market competition and institutional arrange-ments on wage bargaining, which takes place primarily at the sectoral level in Belgium. A number of cross-country analyses suggest that unionisation, centralisation of wage bargaining and collective bargaining coverage at the coun-try level are positively related to wage rigidity. In this paper, we verify the importance of sector-level wage bargaining to explain differences in wage rigidity across sectors. More specifically, we formally test the existence of differences in wage rigidity between sectors after controlling for the im-pact of labour force composition. Furthermore, we assess the importance of labour force composition, sector-specific characteristics such as firm size, capital intensity and com-petition, as well as sector-specific institutional features re-lated to wage bargaining, for explaining differences in wage rigidity across sectors.
The analysis is based on a wide administrative matched employer-employee dataset for Belgium covering the pe-riod 1990–2002, backed up by additional balance sheet data at individual firm level and sector-level data. We consider firms with five employees or more in the manufacturing, ser-vices and construction sectors. Given that Belgium has very low downward nominal wage rigidity, consistent with full automatic indexation, we focus on real rigidity. Downward real wage rigidity is defined as the fraction of workers who would receive a wage freeze in real terms if they were due for a real wage cut. It is estimated using the procedure de-veloped by Dickens and Goette (2005).
Our results point to substantial differences across work-ers. Downward real wage rigidity is higher for white-collar workers, younger workers and those with lower earnings and bonus payments. These findings may be explained by a greater risk of shirking and higher hiring costs for white-collars workers, and also by the existence of automatic age-related pay rises for most white-collar workers in Belgium. Younger workers may have a higher propensity to leave in the event of wage cuts, but they also receive lower bonuses and premia.
Differences in downward real wage rigidity across sec-tors are also substantial. We find that downward real wage rigidity is higher in sectors with (i) a larger proportion of white-collar workers, (ii) larger firms, (iii) more labour-intensive production technology, (iv) stronger competition on the product market, and (v) more centralised wage bar-gaining. For a more accurate understanding of the last find-ing, it should be noted that sector-level collective wage agreements are very widespread and their coverage is very high in Belgium. In this context, firm-level bargaining, that better accounts for firm-specific economic conditions, may ease wage moderation in adverse times.
References
Agell, J., Benmarker, H.: Wage incentives and wage rigidity: a repre-sentative view from within. Labour Econ. 14, 347–369 (2007) Altissimo, F., Bilke, L., Levin, A., Mathä, T., Mojon, B.: Sectoral and
aggregate inflation dynamics in the euro area. J. Eur. Econ. Assoc.
4, 585–593 (2006)
Altonji, J.G., Devereux, P.J.: Extent and consequences of downward nominal wage rigidity. In: Polachek, S.W. (ed.) Worker Well Be-ing, Research in Labor Economics, p. 19. Amsterdam, Elsevier (1999)
Álvarez, L., Dhyne, E., Hoeberichts, M., Kwapil, C., Le Bihan, H., Lünnemann, P., Martins, F., Sabbatini, R., Stahl, H., Vermeulen, P., Vilmunen, J.: Sticky prices in the euro area: a summary of new micro-evidence. J. Eur. Econ. Assoc. 4, 575–584 (2006) Babecký, J., Du Caju, P., Kosma, D., Lawless, M., Messina, J., Rõõm,
T.: Downward nominal and real wage rigidity: survey evidence from European firms. Scand. J. Econ. 112, 884–910 (2010) Biscourp, P., Dessy, O., Fourcade, N.: Les salaires sont-ils rigides? Le
cas de la France à la fin des années 90. Econ. et Stat. 386, 59–79 (2005)
Boone, J., van Ours, J.C., van der Wiel, H.: How (not) to measure com-petition. CEPR discussion papers 6275, London (2007)
Campbell, C.: Sectoral wage rigidity in the Canadian and French economies. Eur. Econ. Rev. 33, 1727–1749 (1989)
Campbell, C.: Tests of efficiency wage theory and contract theory with disaggregated data from the US. Weltwirtsch. Arch. 127, 98–118 (1991)
Campbell, C.: The variation in wage rigidity by occupation and union status in the US. Oxf. Bull. Econ. Stat. 59, 133–147 (1997) Card, D., Hyslop, D.: Does inflation grease the wheels of the labor
mar-ket. In: Romer, C.D., Romer, D.H. (eds.) Reducing Inflation: Mo-tivation and Strategy, NBER Studies in Business Cycles, vol. 30. National Bureau of Economic Research, Cambridge (1997) Card, D., de la Rica, S.: Firm-level contracting and the structure of
wages. Ind. Labor Relat. Rev. 59, 573–592 (2006)
Cardoso, A., Portugal, P.: Contractual wages and the wage cushion under different bargaining settings. J. Labor Econ. 23, 875–902 (2005)
Christopoulou, R., Vermeulen, P.: Markups in the Euro area and the US over the period 1981–2004: a comparison of 50 sectors. ECB working papers 856 (2007)
Clar, M., Dreger, C., Ramos, R.: Wage flexibility and labour market institutions: a meta-analysis. Kyklos 60, 145–163 (2007) Cornille, D., Dossche, M.: Some evidence on the adjustment of
pro-ducer prices. Scand. J. Econ. 110, 489–518 (2008)
Dell’Aringa, C., Lucifora, C.: Collective bargaining and relative earn-ings in Italy. Eur. J. Polit. Econ. 10, 727–747 (1994)
Dhyne, E., Álvarez, L.J., Le Bihan, H., Veronese, G., Dias, D., Hoff-mann, J., Jonker, N., LünneHoff-mann, P., Rumler, F., Vilmunen, J.: Price changes in the Euro area and the United States: some facts from individual consumer price data. J. Econ. Perspect. 20, 171– 192 (2006)
Dickens, W.T., Goette, L.: Estimating wage rigidity for the Interna-tional wage flexibility project. Mimeo, Brookings Institution. http://www.brookings.edu/es/research/projects/200509_iwfp.pdf (2005)
Dickens, W.T., Goette, L., Groshen, E.L., Holden, S., Messina, J., Schweitzer, M.E., Turunen, J., Ward, M.E.: How wages change: micro evidence from the International wage flexibility project. J. Econ. Perspect. 21, 195–214 (2007a)
Druant, M., Du Caju, Ph., Delhez, Ph.: Results of the Bank’s survey of wage setting in Belgian firms. In: NBB Economic Review, Sept., pp. 49–73. National Bank of Belgium (NBB), Brussels (2008) Druant, M., Fabiani, S., Kezdi, G., Lamo, A., Martins, F., Sabbatini,
R.: How are firms’ wages and prices linked: survey evidence in Europe. ECB working paper 1084 (2009)
Du Caju, Ph., Gautier, E., Momferatou, D., Ward-Warmedinger, M.: Institutional features of wage bargaining in 23 EU countries, the US and Japan. Ekonomia 12, 57–98 (2009)
Du Caju, Ph., Fuss, C., Wintr, L.: Downward wage rigidity for different workers and firms. Brussels Econ. Rev. 55 (2012, forthcoming) Elsby, M.W.: Evaluating the economic significance of downward
nom-inal wage rigidity. J. Monet. Econ. 56, 154–169 (2009)
Franz, W., Pfeiffer, F.: Reasons for wage rigidity in Germany. Labour
20, 255–284 (2006)
Fuss, C.: How do firms adjust their wage bill in Belgium? A decom-position along the intensive and extensive margins. Labour Econ.
16, 320–329 (2009)
Kahn, S.: Evidence of nominal wage stickiness from micro data. Am. Econ. Rev. 87, 993–1008 (1997)
Hibbs, H.A., Locking, H.: Wage compression, wage drift and wage inflation in Sweden. Labour Econ. 3, 109–141 (1996)
Holden, S., Wulfsberg, F.: Downward nominal wage rigidity in the OECD. B.E. J. Macroecon. 8(1), 15 (2008)
Layard, R., Nickell, S., Jackman, R.: Unemployment, Macroeconomic Performance and the Labour Market. Oxford University Press, Oxford (1991)
Messina, J., Du Caju, Ph., Duarte, C.F., Izquierdo, M., Lynggard Hansen, N.: The incidence of nominal and real wage rigidity: an individual based sectoral approach. J. Eur. Econ. Assoc. 8, 487– 496 (2010)
Palenzuela, D.R., Jimeno, J.F.: Wage drift and collective bargaining at the firm level: evidence from Spain. Ann. Écon. Stat. 41, 187–206 (1996)
Papke, L.E., Wooldridge, J.M.: Econometric methods for fractional re-sponse variables with an application to 401(k) plan participation rates. J. Appl. Econom. 11, 619–632 (1996)
Rycx, F.: Industry wage differentials and the bargaining regime in a corporatist country. Int. J. Manpow. 24, 347–366 (2003)
Shapiro, C., Stiglitz, J.E.: Equilibrium unemployment as a worker dis-cipline device. Am. Econ. Rev. 74, 433–440 (1984)
Stiglitz, J.E.: Alternative theories of wage determination and unem-ployment in L.D.C.’s: the labor turnover model. Q. J. Econ. 88, 194–227 (1974)
Vermeulen, P., Dias, M., Dossche, M., Gautier, E., Hernando, I., Sab-batini, R., Stahl, H.: Price setting in the euro area: some stylised facts from individual producer price data and producer surveys. ECB working papers 727 (2007)
Weiss, A.: Job queues and layoffs in labor markets with flexible wages. J. Polit. Econ. 88, 526–538 (1980)
P. Du Caju holds degrees from the universities of Antwerp and
Leu-ven. After working as a researcher and lecturer at the University of Antwerp, he joined the Research Department of the National Bank of Belgium in 1999. There, he has carried out policy preparing analysis and research on wages, labour markets, households financial behaviour and institutional issues. His work has been published in academic jour-nals and has alimented policy briefings and reports of the National Bank and the Eurosystem.
C. Fuss obtained her Ph.D. from Université Libre de Bruxelles in 1998.
She joined the National Bank of Belgium in June 2000. Her research has since then focused on microeconometric analysis of firm behaviour. Her publications concern firm investment (and its relation with finan-cial constraints, uncertainty, and bank relationships), consumer price setting, labour market issues (such as wage bill adjustment, wage rigid-ity and wage adjustment), and international trade topics (in particular, labour adjustment of multinational firms, exit of multinational firms, and the role of multi-product firms in trade liberalisation).
L. Wintr received his Ph.D. in Economics from Clark University,