Enhancing network cluster
synchronization capability based on artificial
immune algorithm
Tinggui Chen
1,2*, Jiawen Shi
2, Jianjun Yang
3and Gongfa Li
4Introduction
In recent years, social cluster events (mass events) take place frequently. The contradic-tions between social groups are gradually exposed, and their conflicts of interests and games are increasingly apparent. It comes with the fact that cluster behaviors are spe-cifically manifested as cluster emergencies. According to statistics in the “Social Blue Book” in China over the past 10 years, mass incidents have occurred frequently. From 1993 to 2006, mass incidents were boosted from 8709 to 90,000, and even increased to more than 100,000 per year after 2010. When facing those events, people normally make decisions by their own opinions and the choices of surrounding people regarding their attitudes and behaviors. At the same time, with the influence of herd behavior, the indi-vidual decisions make these group events synchronized. For example, “candle-snatching
Abstract
With the deeper study on complex networks, more and more attention has been paid to the research on the cluster synchronization phenomena based on complex net‑ works. In the real world, synchronization phenomena or cluster synchronous behaviors occur frequently, some of which may result in larger negative impacts to the society, such as “cadmium rice event,” while others bring significant economic benefits to the society, such as the synchronization of the propaganda for “black Friday.” Therefore, research on cluster synchronism has great values for theoretical study and social appli‑ cations. Currently, the study of cluster synchronicity is focused on the solution of the synchronization threshold and the analysis of the synchronization phenomenon, etc. However, the optimization to enhance the synchronous evolutionary effect is rarely presented in literatures. To overcome these limitations of current work, we explore the optimization of network structure with artificial immune algorithms under the con‑ dition of a constant network scale and finally realize the promotion of synchronous evolution effect in this paper. Moreover, the relevant research results are applied to real cases. On one hand, for the positive synchronous behaviors, the network structure with good synchronization capability is created to achieve better synchronization. On the other hand, the connection between nodes and edges in the network is cut off to avoid the occurrence of negative synchronous behaviors.
Keywords: Network structure, Cluster synchronization, Optimization and evolution, Artificial immune algorithm
Open Access
© The Author(s) 2019. This article is distributed under the terms of the Creative Commons Attribution 4.0 International License (http://creat iveco mmons .org/licen ses/by/4.0/), which permits unrestricted use, distribution, and reproduction in any medium, provided you give appropriate credit to the original author(s) and the source, provide a link to the Creative Commons license, and indicate if changes were made.
RESEARCH
*Correspondence: [email protected] 1 Key Research Institute (KRI)‑Modern Business Research Center, Zhejiang Gongshang University, Hangzhou, China
event” and “cadmium rice event” taking place in China are both typical synchronization
phenomena induced by social rumors and cluster behaviors [1]. In addition, the social
complex network [2, 3] has become an important carrier for synchronization behavior,
meaning the event information is broadcasted over interpersonal social networks dur-ing the whole process of inoculation, production and development into diffusion and extinction. Therefore, research on cluster synchronization based on complex networks is really valued for theoretical study and social applications. It not only provides scien-tific prediction for mass incidents, but also offers reasonable intervention measures and strategies after the occurrence of mass incidents.
Currently, research on synchronization behavior is mainly focused on building its model to explore its evolution process. For instance, Pluchino et al. [4] studied how opin-ions evolved in time according to the frequency rates of the nodes, the coupling term, and the presence of group structures. Shen et al. [5] introduced a general framework of public opinion simulation based on the Multilayer Synchronous Network. Additionally, some potential improvements to the framework were discussed in the work. Further,
Pluchino et al. [6] presented a brief review of the Hegselmann and Krause (HK)
com-promised model in two dimensions. Then, they discussed the Opinion Changing Rate (OCR) model, which allowed scholars to study the conditions for a group of agents with a different natural tendency (rate) to change their opinions and then find their agree-ment. However, the final trend of the evolution results is unable to be predicted. In addi-tion, many related simulation results are not desirable. Moreover, studies that intervene in the evolution process by optimization are rarely performed. Actually, the approaches to control the evolutionary direction and targets by optimization technology will abso-lutely make the evolution outcomes be controlled and intervened, thus many unreason-able or non-optimal results are eliminated.
This paper introduces an artificial immune optimization algorithm to intervene in the evolution results, and then improves the evolution effect by optimizing the net-work structure. Through continuous optimizing netnet-work structure, evolution results are developed towards the optimal direction, and finally the one with relatively optimal syn-chronization performance are obtained.
The paper is organized as follows: “Related works” section is literature review.
“Research framework” section elaborates the research framework of this paper. “Analysis of cluster behavior synchronization evolution” section is focused on nodes’ synchronous
evolution process and results in small world networks. “Optimization of synchronous
evolution process based on artificial immune algorithm” section introduces the artifi-cial immune algorithm to optimize the evolution results obtained in “Analysis of cluster behavior synchronization evolution” section. “Case study” section verifies and analyzes the method proposed in this paper. Finally, the paper is concluded and the future work is presented in “Conclusion” section.
Related works
First of all, in the study of cluster synchronization of mass events, social complex net-work [2, 3] becomes an important carrier which has significant impact to the synchro-nization effect and it develops extremely rapidly as a separate research area. Scholars found that a lot of complicated social networks are neither networks with specific rules, nor random networks, but the different networks with both statistical characteristics [7]. These networks are defined as complex gridded networks, in which small world effects
[8] and unscaled-free properties [9] are most important. For example, in 1998, Watts
and Storgatz [10] proposed a small world model (WS) based on the human social
net-work, which could be transformed from a regular network to a random network by
adjusting a parameter. In 1999, Barabasi and Alber [11] proposed a scale-free network
model (BA). In 2018, considering the heterogeneity among communities, Li et al. [12].
constructed a new community network model in which the communities showed sig-nificant differences in average degree. Based on this heterogeneous community network, they proposed a novel mathematical epidemic model for each community and studied the epidemic dynamics in this network model. Nowadays, research on social network has become a hot topic. However, how to use the model to solve the problems existing in social relations, such as diffusion, synchronization and polarization of social groups, are still issues that need to be studied. In order to solve the synchronization problem in reality, this paper studies how the network structure is advantageous to synchronization.
Secondly, research on the synchronization behavior of mass events in social networks
mainly applies Kuramoto model [13] to get threshold value of trigger
synchroniza-tion through observing its different evolusynchroniza-tion results under different network
struc-tures. For instance, Pluchino et al. [14] used the Kuramoto coupling model metaphor to
social system cluster behavior. From the perspective of social physics, they established the dynamic evolution model and emergent computing model based on Kuramoto one. Hong et al. [15] studied the influence of network structure parameters such as the degree distribution, average length of path, heterogeneity, and centrality of different net-work structures on the synchronization. Moreover, they found that the centrality could be used as a better indicator of synchronization. Ijtihadie et al. [16] introduced a novel method of sharing E-Learning content between distributed Learning Management Sys-tems by using dynamic content synchronization. Sueur et al. [17] studied mass events in the form of synchronous behavior. They considered that it was a particular form of clus-ter behavior, which was the emergence of a large number of inclus-teracting individuals. In addition, many studies explored synchronization behaviors from the angle of physics or parameters of a network structure itself, but existing research rarely incorporates
physi-cal models into the psychology knowledge. For example, Rodrigues et al. [18] discussed
prices based on data on stock returns in 40 countries between 1990 and 2001. Besides, the rich potential for applications is discussed for special fields in engineering, neurosci-ence, physics and earth science. However on the basis of physical model and psychologi-cal theory, few studies have been conducted to reveal the mass incidents that occur over the years in China.
The development of optimization in Artificial Immune Systems (AIS) [21] is extremely
rapid, including successful applications both in academia [22] and industry [23]. The AIS has been developed very well from the basic immune algorithm in a typical artifi-cial immune algorithm, the negative selection algorithm [24], and the cloning selection algorithm [25], to the immune evolution algorithm [26], and the artificial neural network
hybrid algorithm [27] in a complex artificial immune algorithm. For example, Ju and
Chen [28] used aiNet of artificial immune algorithm to solve project scheduling
prob-lem, and studied the relationship between swarm intelligence and AIS. Furthermore,
Chen and Xiao [29] further applied the artificial immune network to solve the global
optimization problem. Therefore, artificial immune algorithm plays an important role in optimization field. In this paper, the optimization model is used to control the synchro-nous evolution results. The evolution process with a pre-defined threshold is continued until the expected evolution results are achieved, thus making the guaranteed output results.
Based on the fact, this paper introduces an artificial immune optimization algorithm that interferes with evolutionary results, which is enhanced by optimizing the network structure. However, because different network structures may influence its synchroni-zation capability, how to obtain the suitable one is a typical combinational optimiza-tion problem. In this paper, we combine optimizaoptimiza-tion with evoluoptimiza-tion technologies, and then make evolution result in the optimal direction by the continuous optimization of the network structure. Finally, a network structure with a relatively superior synchro-nization performance is achieved. Nevertheless, for the negative ones such as Internet rumors, we can destroy the network structures to enlarge the gap between the structure parameters and optimize them to weaken the synchronization capability.
In general, this paper applies the synchronous research model named Kuramoto in physics into social research, and incorporates emotional and psychological factors to the experimental evolution simulation of group event synchronization behavior. Meanwhile, combined with artificial immune algorithm, the optimization of synchronous evolution results is realized. Hence, we are able to obtain the network structure with better syn-chronization performance. Finally, it has been applied to social hot events.
Research framework
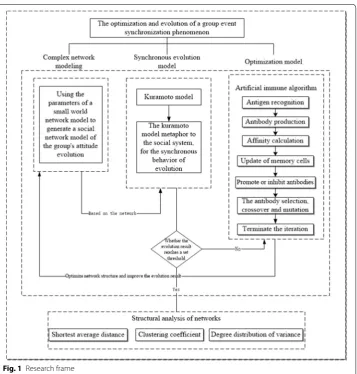
based on complex network. Also, the Kuramoto model is applied to the phase synchro-nization of spring vibrators. It is mainly applied to the analysis of the group evolution process of social events. But the disadvantage is that when the model is created and the parameters are set, the simulation results will not be controlled. The simulation and analysis of the synchronization behavior were conducted in many research institutes. Our research needs to control the evolution result, meaning the evolution result of the final output needs to reach the desired effect. Therefore, the third stage introduces the artificial immunity algorithm. It adjusts the network structure according to the evolu-tion results to optimize the evoluevolu-tion effect of the network structure until the evoluevolu-tion result reaches the pre-set threshold. The synchronization result at this moment is the best one and will be outputted. Then, we analyze the characteristic parameters, such as the shortest average length of the network path, the clustering coefficient, the variance of the degree distribution, etc. Finally, a case study is given to verify and analyze the method proposed in this paper. The concrete research frame is shown in Fig. 1.
Analysis of cluster behavior synchronization evolution
This section mainly studies synchronization evolution of cluster behaviors. Firstly, the initial network structure is generated by parameter-adjustable small world network to form the connection based on interaction among individuals. Secondly, the Kuramoto model is used to study the synchronization behavior of social group events, and the evo-lution results are used to determine whether the group is synchronized. Finally, through the evolution of small, medium and large-scale network simulations, we analyze the effect of different network structures on the synchronization evolution.
Complex network modeling
The synchronization of the clapping, the “grab salt event”, and the people’s extreme speech in the “Shishou event” are all based on complex interpersonal society networks. The transfer of information and the gaming of interpersonal points of view are inter-acted by the links among individuals, so the first phase of the process proposed here is to simulate complex networks by modeling.
The actual social networks are extremely complex. In addition, the differences among individuals make the networks different. Therefore, when constructed the initial net-work structure, the method on constructing a small world netnet-work is adopted: firstly,
the nearest neighbor coupling networks are generated, including N nodes and
connect-ing multi-edges, in which each node is connected with K/2 nodes of its left and right
neighbors, where K is an even number. Later, taken the random number p (pϵ(0, 1)) as the probability, each node reconnects every single edge of the initial network. But in the rewiring process, it is forbidden to have multiple connections between two nodes or exist the self-connecting of the same node.
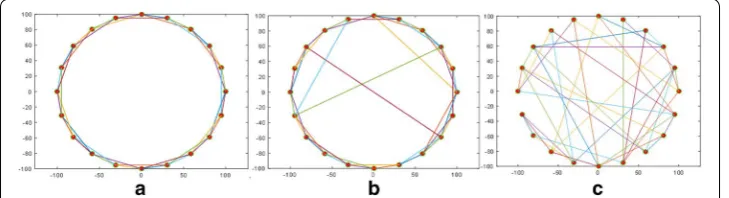
The important reasons for using this method to generate the initial network are as fol-lows: firstly, studies have shown that the characteristics of small world networks are similar to the actual interpersonal networks. The network structure generated in this way is closer to the reality one. Secondly, the rewiring probability p can realize the evolution of network structure from the regular network to the random network. Therefore, the diversity and scientificity of initial network are guaranteed. Figure 2 shows a network structure diagram corresponding to different rewiring probability p:
Synchronous Kuramoto model based on complex networks
Research on synchronous issue has been paid a lot of attention in physics, especially since complex networks have been proposed. Meanwhile, the issue of synchronization for
complex networks has become a popular research topic, in which the Kuramoto model is a classic model of synchronous research due to its simple form and strong expansion. In this paper, the adopted model is a metaphor for public opinion propagation, and the Kuramoto one is transformed into an evolutionary model from a social physics perspective.
Social events tend to be complex and involve large groups of people. Each individual can only interact with some individuals in the group for information interaction. Mean-while, the constitution of individuals involved is more complex. Therefore, the participative groups are simplified into heterogeneous ones with local coupling. The state of the individ-uals in the cluster behavior system can be expressed by the following differential formulas.
where xi(t) as well as xj(t) represents its value of the individual i, j at time t, respectively. ˙
xi(t) denotes the changing value regarding the attitude of the individual i. ni means the
number of adjacent individuals of the ith individual. Because the impact ability from
each individual to another one is different, aj is used to represent the influence of the individual j, which describes the difference in the ability of the individual to be able to alter others’ abilities. wi is an indication of the ability of individuals to receive impacts, reflecting differences in their temperament and perception. In addition, individuals show different persistence when they are influenced by the outside world, so ci is used to indicates the conformity of the individual i and is also applied to reflect the difference in the individual’s attitude changes. At the same time, the synchronous judgment funda-ment is introduced as follows.
where X˙i(t) is the average of x˙i(t) and 0 ≤r(t) ≤ 1. The final criterion to judge cluster
behavior to achieve complete synchronization is whether r(t) is equal to 1. That is, for any x(t) and ε > 0, according to the law of large numbers, if
then it indicates that the cluster behavior achieves synchronization.
The emergent computation method adopted in this paper is the Monte Carlo one, because not only it is flexible and simple, but also it has a strong applicability in this experiment simulation. Moreover, the simulation results are more reliable. During cal-culation, each individual is taken as an Agent and its operational rule refers to formula (1).
Analysis of synchronous evolution
This section analyzes the synchronization behavior through the different scales of net-work structures to obtain the synchronous evolution results under different struc-tures. It also analyzes the relationship between the difference of network structure and the effect of synchronization evolution from the results. Meanwhile, there are a lot of (1)
˙
xi(t)=ci+wi1 ni
j∈Ωi αisin
xj(t)−xi(t)
(2)
r(t)=1−
1 N N i=1 ˙
Xi(t)− ˙xi(t) 2
(3)
parameters derived from the description of the network structures, such as the average shortest distance between networks, clustering coefficient, degree distribution of net-work nodes, betweenness, etc. The three main ones for facilitating the synchronization capability are explored including the shortest average distance, the clustering coefficient and the degree distribution of network nodes. We made this selection because these three ones can basically delineate a network structure. Among them, the first one affects the communication speed among nodes, thus influencing the formation of synchroniza-tion state; the second one indicates the aggregasynchroniza-tion degree of the network, which reflects the close degree of connections among nodes, and usually the larger the clustering coef-ficient, the closer the relationship is among nodes; the last reflects the number of one node connecting to others in the network. The existing research shows that the more uniform the degree distribution in terms of network size and the shortest average dis-tance is, the better synchronization outcome is achieved [30].
The work of this study is how to determine the network structure corresponding to the optimal evolutionary result under the constant network scale (i.e., nodes and edges remain unchanged) through comparing with the synchronous capabilities under differ-ent network structures. In the premise of satisfying the formula (3) (i.e., the synchroni-zation is finally reached), the network structure which meets the threshold value shown in formula (2) is the first one to be satisfied. After that, by analyzing the shortest dis-tance, the cluster coefficient, and the distribution of network nodes in the optimal net-work structure, we finally find the universality of these netnet-works.
1. Analysis on synchronous evolution under the small‑scale network
Based on the initial small-scale network with network node of 30 and the number of connected edge of 60, we adopt the metaphorical Kuramoto model to carry out the
experiments of synchronization evolution simulation. The results are shown in Fig. 3
and Table 1, where each numerical point in the graph is the average of 10 simulation
experiments. As shown in Fig. 3, Fig. 3b is the network structure, while Fig. 3c, d are the distribution histogram of the probability distribution of the node degree in Fig. 3b and the degree of the nodes, respectively.
Figure 3a presents that the synchronous judgment value r is very unstable, fluctuat-ing between 0.88 and 1. Also, it does not meet the requirement of formula (3) in the set number of evolution times. Obviously, under this network structure, the whole group
synchronization eventually cannot reach equilibrium. Figure 3b shows that the
informa-tion of each network node can only be spread through the surrounding neighbor nodes layer by layer. The transmission speed is slow and the efficiency is low too. Therefore, it is not possible to transfer their views and attitudes to others quickly, resulting in a lag of information transmission and unable to form synchronization in a certain time.
2. Analysis on synchronous evolution under the medium‑scale network
On the basis of the initial medium-sized network, the network node is 300, the connect-ing edge is 900, and the results of synchronous evolution are shown in Fig. 4 and Table 2.
Figure 4a shows that synchronization judgment is based on the value of r ranging
between 0.9 and 0.95. Ultimately, the trend of the synchronization is not reached. Due to the expansion of network scale, Fig. 4b has been unable to intuitively provide the
dif-ference between different network structures. From Table 2, the degree of the nodes is
essentially at normal distribution, but the average length of path is long. Pursuant to the analysis for small-scale networks, we conclude that the synchronization of the system Fig. 3 Heterogeneous group results and network parameters’ distribution of local coupling evolutions under the small‑scale network: a the diagram of the synchronization effect; b structure diagram of the network; c the probability distribution of the histogram node degrees; d node degree distribution histogram
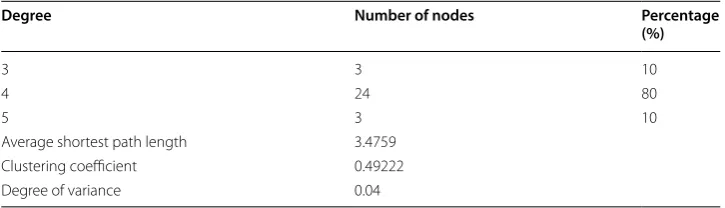
Table 1 Parameter statistics of network structure corresponding to Fig. 3b
Degree Number of nodes Percentage
(%)
3 3 10
4 24 80
5 3 10
Average shortest path length 3.4759
Clustering coefficient 0.49222
can be severely restricted if the distance between nodes in the network is long and the shortest average distance distribution is not uniform. This is because longer distance gets the communication among nodes blocked. Compared with small-scale network in Fig. 3a, the synchronization state can be achieved at a certain stage of evolution, while the network in this scale is unable to even reach the synchronization of the whole view-point in a short time. Therefore, the shortest average length of distance in a network
Fig. 4 Heterogeneous group results and network parameters’ distribution of local coupling evolutions under the medium‑scale network: a the diagram of the synchronization effect; b structure diagram of the network; c the probability distribution of the histogram node degrees; d node degree distribution histogram
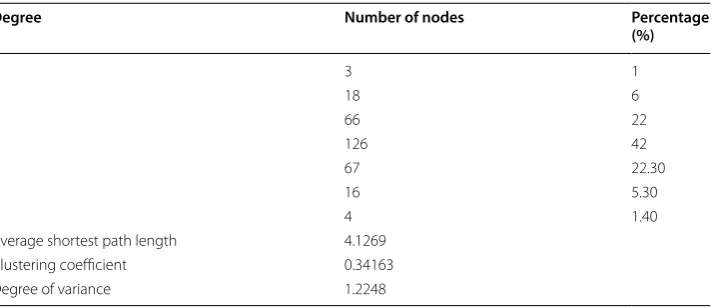
Table 2 Parameter statistics of network structure corresponding to Fig. 4b
Degree Number of nodes Percentage
(%)
3 3 1
4 18 6
5 66 22
6 126 42
7 67 22.30
8 16 5.30
9 4 1.40
Average shortest path length 4.1269
Clustering coefficient 0.34163
structure is an important index to ensure the synchronous evolution result, meaning the shortest average distance needs to be within a limited range to ensure that the synchro-nous evolution achieves better results. At the same time, the high clustering coefficient can cause the local node to be too close, falling into local synchronous state. Apparently, it will cause difference comparing with the overall synchronization effect.
3. Analysis on synchronous evolution under the large‑scale network
In realistic social networks, interpersonal relations are interleaved. The entire number of individuals in the social network is large. When an influential event occurs, the individ-ual’s perception of the event and the subjective attitudes tend to change over the course of the event and create complex interactions with the surrounding individual to create a mutual impact.
Fig. 5 Heterogeneous group results and network parameters’ distribution of local coupling evolutions under the large‑scale network: a the diagram of the synchronization effect; b structure diagram of the network; c the probability distribution of the histogram node degrees; d node degree distribution histogram
Table 3 Parameter statistics of network structure corresponding to Fig. 5b
Average shortest path length Clustering coefficient Degree of variance
Based on the simulation environment of an initial large-scale network, which has 1000 network nodes and 4000 edges, the synchronous evolution results are shown in Fig. 5 and Table 3.
Compared with small-size and medium-size networks, large-scale ones spend more time for synchronization and are more difficult to achieve a lasting consistency in the experiment simulation because the amounts of nodes and edges are bigger in
large-scale networks. Figure 5a shows that synchronous judgment with values r changes
with the increase in interactions. In this simulation experiment, due to the larger-scale network, the interaction between individuals is more complex. The synchro-nization of the whole system is relatively poor, and the synchronous judgment with
value r has been in a relatively large fluctuation. This is because the amount of
net-work individuals is too large, which makes the netnet-work receive too much information from others to view the event, and further makes judgment and adjustment to the surrounding situation, resulting in the instability of the overall synchronization, thus
showing the continuous fluctuation of r value. Obviously, in Table 3, under the
con-ditions of the average length of path, clustering coefficient and degree variance, the individuals in the network cannot achieve the synchronization completely.
Generally, the result of synchronization evolution is not as expected in randomly gen-erated networks. That is, neither the synchronization result is achieved nor the synchro-nization duration is sufficient. This is also the reason why it is necessary to introduce the optimization idea. Based on this scenario, a lot of research will change the parameters of the participating individuals, or increase the coupling degree of the network to achieve the synchronization goal. Optimization technology is an efficient way to find out suit-able network structure parameters to realize synchronization, neither changing the indi-vidual’s properties nor increasing the network’s connection costs.
Optimization of synchronous evolution process based on artificial immune algorithm
The different network structures cause the synchronization evolution results uneven and their variance is too large. Therefore, the network structures need to be mized and the output of the final evolutionary result needs to be controlled by opti-mization technology. In this way, a combinational optiopti-mization issue is defined firstly to optimize the network structures via taking the synchronous evolution effect as an objective function. At the same time, the optimized network structure is evolved to check the optimal result. In this work, incorporating optimization technology into evolution process, we can find out the network structure corresponding to the opti-mal synchronous capability.
Basic artificial immunity algorithm
The main idea of the artificial immune algorithm derives from biological immune system and realizes pattern recognition and optimization search processes based on biological immune system memory, learning, and other functions of imitation. The antigen and antibody in the manual immune algorithm correspond to the objective function and the feasible solution in the optimization problem, respectively. The algo-rithm takes affinity between the antibody and antigen as and the matched degree of the target function and feasible solution, and then calculates the expected survival rate of the antibody to promote superior antibody’s genetic and mutation. Memory cells are also utilized to preserve better feasible solutions after selection so as to restrain continuous generation of similar feasible ones and ensure that the algorithm can continue to search the global optimal solution. At the same time, when similar problems are encountered again, the better solution that adapts to the problem or even the optimal solution can be generated faster.
Basic steps for the fundamental artificial immune algorithm are as follows.
1. Antigen recognition: determine the objective function and various constraints as antigen.
2. Generation of the initial antibodies: use stochastic method to generate antibodies in the solution space.
3. Affinity calculation: calculate the affinity between antigen and antibody respectively as well as the one between antibody and antibody.
4. Update of memory cell: the antibody with high affinity for antigen is added to the memory cell, and the individual with the highest one is replaced with the newly added antibody.
5. Promotion and restraint of antibody: calculate the expected value of each antibody and restrain the one whose expected value is below the threshold. It can be con-cluded that the higher the antibody clone is, the lower the variation coefficient will be.
6. Generation of antibodies: go into the next generation through crossover and muta-tion.
7. Termination of memory cell iteration: terminate the generation and selection of memory cells at a specified threshold.
A synchronization optimization process combined with AIS algorithm
The artificial immune algorithm is used to realize the optimization of network structure in order to enhance network synchronous capability.
where r value is the synchronization degree after t evolution times.
2. Create the initial antibody population, i.e. the initial network structure. The initial network is generated as an antibody by the method described in “Complex network
modeling” section and the population size is 20.
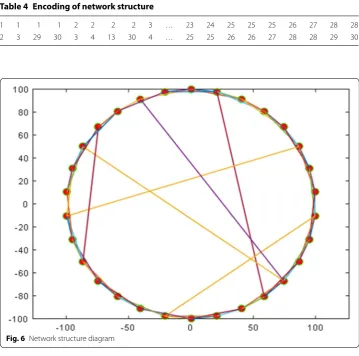
3. Coding: the antibodies are encoded according to the connection. For example, if two nodes connected in an edge are 1 and 3, respectively, the following Table 4 (1, 3) will represent the edge. We describe the whole network in this way (as shown in Fig. 6). 4. Affinity calculation: we calculate affinity (Sg)i between antigen and antibody i, and
affinity (Sb)ij between antibody i and j, respectively. The affinity between antigen and antibody is measured by the synchronous judgment value r at time t,
(4)
r(t)=1−
1 N
N
i=1
˙
Xi(t)− ˙xi(t)
2
(5)
Sg
i =ri.
Table 4 Encoding of network structure
1 1 1 1 2 2 2 2 3 … 23 24 25 25 25 26 27 28 28
2 3 29 30 3 4 13 30 4 … 25 25 26 26 27 28 28 29 30
When the value of r is larger, the affinity is higher. The affinity between the anti-body and the antianti-body is measured by the similarity of the average shortest distance between network nodes, the clustering coefficient, and the degree distribution vari-ance as shown in formula (6).
where id and jd are the shortest average distance of the network i and j. ic and jc are the clustering coefficient of the network i and j. ie and je are the variance of the degree distribution of the network i and j.
5. Update of memory cell: we add antibody with high antigen affinity to memory cells. Because the number of memory cells is limited, the newly added antibody in the memory cell will replace the original one with the highest affinity.
6. Promotion and restraint of antibody: we calculate the expected value of the antibody. The ones with lower expectation will be restrained. The concentration of the anti-body in the population is:
where acij =
1 (Sb)ij<0.5
0 Others , the expected value of the antibody i is defined as:
The above formula illustrates that antibody with higher affinity for antigen and anti-body with lower concentration will have higher survival rate. On the other side, the antibody with lower antigen affinity and higher antibody concentration will be restrained to ensure the diversity of immune control.
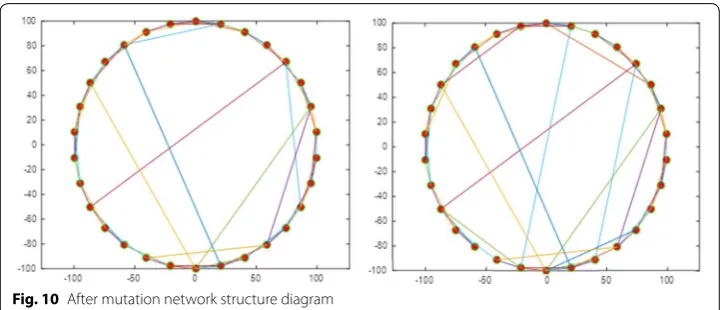
7. Generation of new antibodies. As shown in Figs. 7, 8, 9, 10, crossover and muta-tion process diagram for antibodies, as well as the results of crossover and mutamuta-tion after network structure are in the diagram. We randomly select two antibodies: (1) creating a random number to select the index of nodes and links to be crossed; (2) in order to make the new antibody more diverse, while maintaining the advantages of the previous generation of antibodies, the numbers of the selected crossing nodes and interconnecting edges are required to be within a certain range. Usually, they are close to one-fifth of the whole network, so that they are relatively good; (3) check whether there is a reconnection of the two antibodies after crossover operation. If it is, one of the nodes will be mutated to ensure that the entire network does not have a reconnection. The new antibodies were used to replace 80% of the lower affinity antibodies in the previous generation to form a new generation of antibodies. Repeat step (3) to step (7) until step (4) that the affinity of antigens and antibodies is stable around 1. The threshold value of the affinity of antigen and antibody set in this paper
(6)
(Sb)ij=
|id−jd| id
+ |ic−jc|
ic +
|ie−je| ie
(7)
Ci= 1
n n j=1 acij (8)
Si=
(Sg)i
is 0.97. To ensure the stability of synchronization, the synchronous value needs to be stable continuously. The basis of the synchronous stabilization is set in continuous 50 times. Based on multiple experimental simulations, the network can be sure to achieve synchronization when the set threshold value is exceeded 50 times, so as to stop the iteration and end the optimization process.
Fig. 7 Antibodies crossover operation schematic diagram
Fig. 8 Schematic diagram of network structure after crossing operation
8. Restore codes to rules, and finally get the network structure.
The concrete optimization flow is shown in Fig. 11.
Analysis of synchronous evolutionary network after optimization
The artificial immune algorithm is used to optimize the initial random network men-tioned in “Analysis of cluster behavior synchronization evolution” section. We can obtain the post-optimized synchronization evolution effect pictures, network structure analysis graphs and parameter statistics tables. The detailed analysis results are as follows.
1. Small‑scale network evolution effect after optimization by artificial immune algorithm
The simulation results are shown in Fig. 12 after artificial immune algorithm
optimi-zation. The optimized network structure enables the individual on the network to con-tinually adjust their attitude towards events according to the individual’s opinion values associated with the individual. So the individual in the whole system reaches a stable synchronization state quickly, and the synchronization value r in Fig. 12a is infinitely
approximated to 1. We analyzed the structure of the network via the Fig. 12b–d and
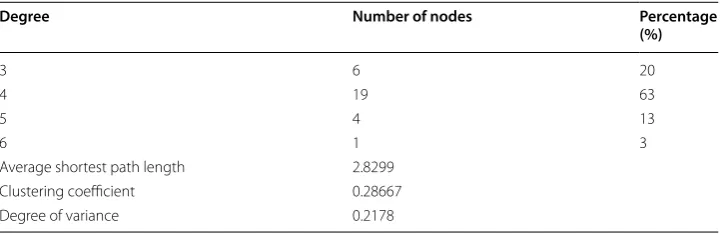
Table 5. From the objective representation of the structure of Fig. 12b, we found that the entire network is evenly distributed and small groups are rarely appeared. In the meantime, the connections between the “long distance” nodes are generated, meaning that information exchange is not limited to the individual in the periphery, thus it sig-nificantly reduces the length of the average distance of the individuals and increases the information transformation over the individuals. The clustering coefficient is reduced to 0.28667, which makes the concentration between individuals to a small extent. Such scale network (30 nodes, 60 consecutive edges), with the shortest average length of path 2.8299, the clustering coefficient 0.28667, and the network structure with a degree vari-ance of 0.2178, has better synchronization. For a small-scale network, the first thing to do is to make sure that the network’s shortest average distance is as small as possible. Secondly, our approach keeps the variance of degree as small as possible because the more uniform the degree distribution is, the less the overall synchronism is affected by the extreme individuals.
2. Medium‑scale network evolution results after optimization by artificial immune algorithm The simulation results are obtained after optimization on the medium-scale network
through the manual immune algorithm. Figure 13a shows that the network structure
acquired after optimization enables the individual on the network to continuously adjust the attitude towards the event according to viewpoints of one connected with it. Therefore, the individuals of the whole network are brought to a stable synchro-nous state rapidly, where the synchronized value r is infinitely close to 1.
Through the analysis of the network structure by Fig. 13c, d, and Table 6, the opti-mized network structure significantly shortens the average length of path. Clustering
coefficient has been reduced as well. In the real world, the six degrees of separa-tion theory has revealed that the average distance between any two individuals is no greater than six, and those who have higher identities usually are the important nodes to close the average distance. Obviously, the optimized network structure increased the more high-identity individuals, therefore we reduced the average distance of information flows over nodes. At the same time, it enables the individuals to receive opinions and attitudes far away from some other ones, making the individual more holistic of the whole network, thus it effectively avoids the local individual means which may cause global synchronization problems.
Fig. 12 Heterogeneous group results and network parameters’ distribution of local coupling evolutions on the final network optimization: a the diagram of the synchronization effect; b structure diagram of the network; c the probability distribution of the histogram node degrees; d node degree distribution histogram
Table 5 Parameter statistics of network structure corresponding to Fig. 12b
Degree Number of nodes Percentage
(%)
3 6 20
4 19 63
5 4 13
6 1 3
Average shortest path length 2.8299
Clustering coefficient 0.28667
3. Large‑scale network evolution results after optimization by artificial immune algorithm From the simulation result of the optimization shown in Fig. 14, it can be seen that all the individuals in the whole network reach the synchronous state under the condition of the same parameters in this scale network, whereas the analysis results of the net-work structure from Fig. 14c, d and Table 7 show that the statistical parameter vari-ations of the two network structures are very small. Apparently, on the basis of the
Fig. 13 Heterogeneous group results and network parameters’ distribution of local coupling evolutions on the final network optimization: a the diagram of the synchronization effect; b structure diagram of the network; c the probability distribution of the histogram node degrees; d node degree distribution histogram
Table 6 Parameter statistics of network structure corresponding to Fig. 13b
Degree Number of nodes Percentage
(%)
3 2 0.7
4 31 10.3
5 76 25.3
6 99 33.0
7 54 18.0
8 27 9.0
9 9 3.0
Average shortest path length 3.5869
Clustering coefficient 0.12893
original network, slight changes taking place on the network connection significantly affect the final synchronization situation. In addition, in large-scale network struc-tures, when the average path length, the clustering coefficient, and the degree devia-tion of the two networks are close, the synchronizadevia-tion evoludevia-tion will be close and be in the vicinity of a full synchronization. If the fit of these parameters is better, a better synchronization result will be achieved. On the other side, if the fit is slightly poor, it will reflect directly the instability of the synchronization continuity and appear as a fluctuation after a period of synchronization, as shown in Fig. 5a.
In general, this section explores the effects of the network structure on the synchro-nization evolution results by dividing the networks into small, medium, and large-scale. In small-scale networks, their structures can be observed more clearly to reflect the overall situation of the connections. In medium-scale ones, the parameters’ dif-ference of the networks before and after optimization are more obvious, meaning the average length of path, clustering coefficient and degree variance vary significantly in
Fig. 14 Heterogeneous group results and network parameters’ distribution of local coupling evolutions on the final network optimization: a the diagram of the synchronization effect; b structure diagram of the network; c the probability distribution of the histogram node degrees; d node degree distribution histogram
Table 7 Parameter statistics of network structure corresponding to Fig. 14b
Average shortest path length Clustering coefficient Degree of variance
numerical value. Through adjusting these parameters, it is easy to realize the network synchronization. Large-scale networks are more complex because statistical values of network structure parameters are relatively close. It is difficult to achieve synchro-nism results even though parameter adjustments are conducted.
Case study
The characteristics of social hot events are that it tends to induce a wide range of atten-tion in society individuals, and quickly spread through the empathy of individuals. During the spread of these hot events, they contain a series of phenomena such as syn-chronization, polarization, etc. The case of this paper is selected from the “tiger-bites event” at the Youngor zoo in Ningbo, China, on January 29, 2017, at about 2:30 p.m., due to the death of the person who entered the zoo and was bitten by the tiger. His death caused great public concern, and directly boarded the first prize for the heat search on the microblogs. In view of the depth and the development of events, the attitudes of the people show a more obvious tendency to synchronize. Whether the heat is discussed from the microblogs or the search index of Baidu, the attitude of the people has been evolving synchronously. We analyzed the netizens’ comments from social platform, and found that the degree of tone and the synchronicity of the individual comments are more closely matched. Hence, our paper chooses this event to analyze the synchroniza-tion phenomenon in the process of the message’s diffusion.
Synchronous evolution analysis of the public opinion about the occurrence of “tiger‑bites event” in the Ningbo Youngor Zoo
Due to the incident involving life safety, regulation, animal protection and other aspects of tiger injuries, the death of both people and tigers is extremely easy to arouse people’s continuous follow-up on this issue. Meanwhile, there are endless questions about who should be affected by the death of people and tigers. Therefore, this event has received high attention from people in the process of communication, and Baidu index statistics are shown in Fig. 15.
It took place on 29th January and public opinion reached climax on 30th. With the impact of the environment, the conformity of the individual is very strong. Under this kind of circumstance, if one voice is stronger than others’, the whole network will start
leaning to the side. According to the evolution of the Sina Weibo comments over time, from the initial development to climax stage, public opinion is basically towards the sympathy for the death of the tiger and the disapproval of the deceased. In the discussion of the topic from Sina Weibo, the network users who support the tiger and the deceased are in the ratio of 8:1. Those who support the tiger are based on the following reasons: (1) the deceased, in violation of the regulations of the zoo, ignored the regulations of the zoo and the warning. Hence, he should be responsible for his behaviors under the obvi-ous risk. (2) The tiger considers the dead as its prey. It is its nature for hunting food and the final shot is innocent. The main viewpoint supporting for the deceased is that the victim may be wrong, but in human terms, the sin is not deserved to die.
This paper simulates the process of synchronous evolution of the event. First, the con-formity parameter ci is a positive number that obeys normal distribution N (0.6, 0.3), in which the mean value is taken as 0.6 to reflect the mass of people in the event. The vari-ance is 0.3 for the occurrence of tiger bites because the participating individuals are in high heterogeneous with different age spans, occupations, backgrounds, etc. In addition, in the group public opinion of tiger bites, the influence of individual transmission and the ability to receive influence of others are amplified. Moreover, in the public opinion of the group, the individual’s attitude is affected by the influence of the emotional infection of others. Therefore, the parameters are taken as αi ∼N(1.2, 0.3),wi∼N(1.5, 0.3).
Simulation of this event is based on a large-scale complex network with 1000 nodes.
The optimized network structure with good synchronous evolution in “Analysis of
syn-chronous evolutionary network after optimization” section is adopted as the foundation
network of the event simulation. The emergence calculation model of “Synchronous
synchronous evolution effect. By calculation, Fig. 16 shows that after a period of time, the system starts to emerge from the cluster synchronization phenomenon. The public opinion gradually tends to be stable after the intense interaction as well, which indicates that the majority of participants’ attitude towards the tiger bite incident tends to be con-sistent. Also, the consensus is reached after a period of time, which is consistent with the final trend of the public opinion.
The statistical results over the network structure illustrate that average shortest dis-tance is 3.89, the average clustering coefficient is 0.097, and the distribution of the degree of variance is 8.88.
Synchronous evolution analysis of public opinion in “tiger‑bites event” based on optimization technology
According to the study in “Research framework” section, AIS is used to optimize the
initial network. The final goal is to improve the synchronization performance includ-ing the synchronization degree as well as the synchronization lastinclud-ing time. By analyz-ing the optimized network structure, we derived that the shortest average distance of the network is 3.708, the mean clustering coefficient is 0.0889, and the variance of the degree distribution is 8.07. Compared with the situations before and after opti-mization, these three parameters are reduced so the network structure is more con-ducive to the realization of the synchronization. The optimized network structure is adopted to simulate the “tiger bites event”, and all the parameters are the same as the
ones mentioned in the “Synchronous evolution analysis of the public opinion about
the occurrence of “tiger-bites event” in the Ningbo Youngor Zoo” section except for the utilization of different network structures. It turns out that, as shown in Fig. 17, we can see that the efficiency of arriving to synchronization in the “tiger bites event” has been increased significantly. So it is clear that the changes in the structure of the network directly affect the results of synchronous evolution. By comparison, the synchronization effects were achieved both before and after optimization. However, obviously, it is much faster to achieve synchronization using optimized networks.
The work mentioned above to enhance the synchronization degree and efficiency by optimizing the network structure is generally applicable to many fields, such as the synchronization of marketing and advertising input, the degree of acceptance by the consumer, etc.
All in all, under networks with different sizes, there must be a network structure that is conducive to synchronization phenomenon. In this network structure, the shortest dis-tance, the clustering coefficient and the variance of the distribution are the criteria. In the positive events, we can simulate the original network, predict the final tion effect of the event, and then enhance the synchronization degree and synchroniza-tion lasting time by optimizing the network structure. For example, during the “Double 11 shopping frenzy” in China every year, it’s totally possible to realize the evolution of the synchronization effect as well as the optimization of the network structure accord-ing to the previous consumption network relations, the investment of the advertisement and the earlier performance of the consumers. In the later stage, businesses can develop accurate marketing strategies according to the evolution results. In reality, the positive construction of the shortest path has become the main goal of the merchant in build-ing a marketbuild-ing network. In last year’s “Double 11 shoppbuild-ing frenzy”, durbuild-ing the advise-ment stage, the business divided up the number of red envelopes to groups of people who were not directly related to each other. So people had to have relationships with each other in the form of a group of friends, and consequently the distance of the entire consumer network has been closed directly. Hence, the investment and sales volume of the marketing money can be synchronized, which is a very effective way of shortening the distance among the individuals and causing the group to synchronize.
Not just in China, in western countries such as the United States, social networking
sites led by FaceBook, and some special social + shopping websites and tools, such as
In the case of some extreme events, government administrative departments often want to suppress the occurrence of group synchronization behaviors. Therefore, an evo-lutionary analysis of the events can be conducted during the initial inoculation process, and the existing nodes in the network are attacked on the basis of the simulation analy-sis. Obviously, the earlier the node enters the network, the larger influence it will have.
Conclusion
The previous study of cluster synchronization behavior was focused on the synchroniza-tion evolusynchroniza-tion model, the approach to the threshold value of synchronous behavior trig-gering, etc. Scholars rarely did the research that controlled the output of the evolution result by combining synchronization evolution and optimization. From the perspective of social physics, this paper constructs the Kuramoto metaphor model, optimizes the network structure through the artificial immune algorithm, thus obtains the better evo-lution result, and then divides the network scales into small, medium and junior catego-ries for experimental analysis. The main conclusions are summarized as follows.
1. Simulation analysis on the small world network is performed. We use the small world network with adjustable parameters to construct the network model closer to the real social network. Subsequently, metaphor model of synchronous behavior is set up based on the small network. After that, the synchronization evolution experiment and optimization analysis are further carried out. Moreover, the influence of the con-nection scheme of the network on the synchronous capability is taken into account when the network size is unchanged. The result is of great significance for reference and practice.
2. The reduction of the shortest average distance of the network is benefit to the enhancement of network synchronization capability. However, in a network with constant scale, the distance is not infinitely shortened. When the shortest average distance is reduced to a certain value, the clustering coefficient and the degree dis-tribution variance of the network will have significant impact to the synchronization performance. Clustering coefficient will produce an intermediate value ranging from big to small in the process, which generates the strongest synchronization capability. 3. AIS optimization algorithm is introduced to enhance network cluster
synchroniza-tion capability. Combining evolusynchroniza-tion and optimizasynchroniza-tion technologies, the evolusynchroniza-tion direction is guided by the optimization function to obtain the network structure with better synchronization effect.
data-driven and then verify the reliability and scientificity of the simulation experi-ments in the opposite direction.
Authors’ contributions
TC described the proposed algorithms and wrote the whole manuscript. JS implemented the simulation experiments. JY and GL revised the manuscript. All authors read and approved the final manuscript.
Author details
1 Key Research Institute (KRI)‑Modern Business Research Center, Zhejiang Gongshang University, Hangzhou, China. 2 School of Management and E‑Business, Zhejiang Gongshang University, Hangzhou, China. 3 Department of Computer Science and Information Systems, University of North Georgia, Oakwood, GA, USA. 4 Hubei Key Laboratory of Mechanical Transmission and Manufacturing Engineering, Wuhan University of Science and Technology, Wuhan, China.
Acknowledgements
This research is supported by the National Natural Science Fund Project of China under Grant No. 71401156, Humani‑ ties and Social Sciences Planning Project of the Ministry of Education of China under Grant No. 18YJA630012, Zhejiang Provincial Natural Science Foundation of China under Grant No. LY18G010001, Hubei Key Laboratory of Mechanical Transmission and Manufacturing Engineering (2017A08) as well as Contemporary Business and Trade Research Center and Center for Collaborative Innovation Studies of Modern Business of Zhejiang Gongshang University of China under Grant No. 14SMXY05YB.
Competing interests
The authors declare that they have no competing interests. Availability of data and materials
Not applicable.
Ethics approval and consent to participate
Written informed consent was obtained from the research participants for the publication of this report and any accom‑ panying images.
Publisher’s Note
Springer Nature remains neutral with regard to jurisdictional claims in published maps and institutional affiliations. Received: 4 August 2018 Accepted: 2 January 2019
References
1. Siddique AB, Pecora L, Hart JD, Sorrentino F (2018) Symmetry‑ and input‑cluster synchronization in networks. Phys Rev E 97(1–4):042217
2. Lymperopoulos I, Lekakos G (2013) Analysis of social network dynamics with models from the theory of complex adaptive systems, vol 399. Laxenburg, International Federation for Information Processing, pp 124–140 3. Pan Y, Tan W, Chen Y (2017) The analysis of key nodes in complex social networks. In: International conference on
cloud computing and security, Springer, Cham, pp 829–836
4. Pluchino A, Boccaletti S, Latora V, Rapisarda A (2006) Opinion dynamics and synchronization in a network of scien‑ tific collaborations. Physica A 372(2):316–325
5. Shen Q, Liu YJ (2016) A public opinion simulation framework based on the multilayer synchronization network. In: IEEE international conference on systems, IEEE, New York, pp 15–20
6. Pluchino A, Latora V, Rapisarda A (2006) Compromise and synchronization in opinion dynamics. Eur Phys J B 50(1–2):169–176
7. Ye X, Fei C (2017) Researches on evaluations of large‑scale complex networks topologies. Procedia Comput Sci 107:577–583
8. Sun B, Tian S, Yao H (2018) The relationship between the small‑world effect and diffusion efficiency in an innovation network. Manag Rev 3(1):1–8
9. Mitra C, Kurths J, Donner RV (2017) Rewiring hierarchical scale‑free networks: influence on synchronizability and topology. Europhys Lett 119(3):15–30
10. Watts DJ, Strogatz SH (1998) Collective dynamics of ‘small‑world’ networks. Nature 393:440–442 11. Barabási AL, Albert R (1999) Emergence of scaling in random networks. Science 286(5439):509
12. Li C, Jiang G, Song Y, Xia L, Li Y, Song B (2018) Modeling and analysis of epidemic spreading on community networks with heterogeneity. J Parallel Distrib Comput 119:136–145
13. Medvedev GS, Tang X (2018) The Kuramoto model on power law graphs: synchronization and contrast states. J Non‑ linear Sci. https ://doi.org/10.1007/s0033 2‑018‑9489‑3
14. Pluchino A, Latora V, Rapisarda A (2005) Changing opinions in a changing world: a new perspective in sociophysics. Int J Mod Phys C 16(4):515–531
15. Hong H, Kim BJ, Choi MY (2004) Factors that predict better synchronizability on complex networks. Phys Rev E 69(6):067105
17. Sueur C, Deneubourg JL (2011) Self‑organization in primates: understanding the rules underlying collective move‑ ments. Int J Primatol 32(6):1413–1432
18. Rodrigues FA, Peron TKD, Ji P (2016) The Kuramoto model in complex networks. Phys Rep 610:1–98
19. Song X, Shi W, Ma Y et al (2015) Impact of informal networks on opinion dynamics in hierarchically formal organiza‑ tion. Physica A 436:916–924
20. Li J, Myers SC (2006) R2 around the world: new theory and new tests. J Financ Econ 79(2):257–292
21. Yaw MW, Chong KH, Kamil K (2017) Transform of artificial immune system algorithm optimization based on math‑ ematical test function. In: IEEE international conference on control system, computing and engineering, IEEE, New York, pp 147–150
22. Duma M, Twala B (2018) Optimising latent features using artificial immune system in collaborative filtering for recommender systems. Appl Soft Comput 71:183–198
23. Wang M, Feng S, He C et al (2017) An artificial immune system algorithm with social learning and its application in industrial PID controller design. Math Probl Eng 3:1–13
24. Chen W, Li T (2017) Parameter analysis of negative selection algorithm. Inf Sci 420:218–234
25. Zareizadeh Z, Helfroush MS, Rahideh A et al (2018) A robust gene clustering algorithm based on clonal selection in multiobjective optimization framework. Expert Syst Appl 113:301–314
26. Lin Q, Ma Y, Chen J et al (2018) An adaptive immune‑inspired multi‑objective algorithm with multiple differential evolution strategies. Inf Sci 430(431):46–64
27. Malkawi M, Murad O (2013) Artificial neuro fuzzy logic system for detecting human emotions. HumanCentric Com‑ put Inf Sci 3(1):13
28. Ju C, Chen T (2012) Simplifying multi‑project scheduling problem based on design structure matrix and its solution by an improved aiNet algorithm. Discrete Dyn Nat Soc. https ://doi.org/10.1155/2012/71374 0
29. Chen T, Xiao R (2014) Enhancing artificial bee colony algorithm with self‑adaptive searching strategy and artificial immune network operators for global optimization. Sci World J. https ://doi.org/10.1155/2014/43826 0
30. Zhao M, Zhou T, Wang BH (2006) Relations between average distance, heterogeneity and network synchronizability. Physica A 371(2):773–780
31. Çavdar T (2016) PSO tuned ANFIS equalizer based on fuzzy C‑means clustering algorithm. Int J Electron Commun 70(6):799–807
32. Parsaei MR, Mohammadi R, Javidan R (2017) A new adaptive traffic engineering method for telesurgery using ACO algorithm over software defined networks. Eur Res Telemed 6(3–4):173–180