Received: 7 November 2015
Revised: 27 March 2016
Accepted:
20 April 2016 of the Creative Commons Attribution-NonCommercial 4.0 Unported Licensehttp://creativecommons.org/licenses/by-nc/4.0/, which permits unrestricted non-commercial reuse, provided the original author and source are credited.
Cite this article as:
Kember SA, Hansen VN, Fast MF, Nill S, McDonald F, Ahmed M, et al. Evaluation of three presets for four-dimensional cone beam CT in lung radiotherapy verification by visual grading analysis.Br J Radiol2016;89: 20150933.
FULL PAPER
Evaluation of three presets for four-dimensional cone beam
CT in lung radiotherapy verification by visual
grading analysis
1SALLY A KEMBER,PhD,1,2VIBEKE N HANSEN,PhD,1,2MARTIN F FAST,PhD,1,2SIMEON NILL,PhD, 1,2FIONA MCDONALD,FRCR, MD(Res),1MERINA AHMED,FRCR, MD,1KAREN THOMAS,MSc
and1,2HELEN A MCNAIR,DCR(T), PhD 1Royal Marsden NHS Foundation Trust, London, UK 2
The Institute of Cancer Research, London, UK
Address correspondence to:Sally A Kember
E-mail:[email protected]
Objective: To evaluate three image acquisition presets for four-dimensional cone beam CT (CBCT) to identify an optimal preset for lung tumour image quality while minimizing dose and acquisition time.
Methods: Nine patients undergoing radical conventionally fractionated radiotherapy for lung cancer had verification CBCTs acquired using three presets: Preset 1 on Day 1 (11 mGy dose, 240 s acquisition time), Preset 2 on Day 2 (9 mGy dose, 133 s acquisition time) and Preset 3 on Day 3 (9 mGy dose, 67 s acquisition time). The clarity of the tumour and other thoracic structures, and the acceptability of the match, were retro-spectively graded by visual grading analysis (VGA). Logistic
regression was used to identify the most appropriate preset and any factors that might influence the result.
Results:Presets 1 and 2 met a clinical requirement of 75% of structures to be rated“Clear”or above and 75% of matches to be rated“Acceptable” or above. Clarity is significantly affected by preset, patient, observer and structure. Match acceptability is significantly affected by preset.
Conclusion:The application of VGA in this initial study enabled a provisional selection of an optimal preset (Preset 2) to be made.
Advances in knowledge:This was the first application of VGA to the investigation of presets for CBCT.
INTRODUCTION
Moving structures (for example, lung tumours) can produce artefacts and blurring that affect the accuracy of radiotherapy verification when using cone beam CT (CBCT).1,2This led to the development of four-dimensional CBCT (4D-CBCT) where the series of projections are binned into different phases of the breathing cycle which minimizes blurring.2The disadvantage is that the amount of data for image recon-struction of each phase is reduced compared with conven-tional three-dimensional CBCT (3D-CBCT). This leads to streak artefacts and some loss of image quality.3
One solution is to slow down the gantry speed so that more frames can be acquired.3However, this leads to additional dose to the patient, given that the dose per frame is the same and the frame acquisition rate is constant. The longer acquisition time reduces patient throughput and increases the possibility that the patient may move.3,4
Alternative reconstruction algorithms to reduce streaking,
studied with the aim of reducing dose and image acquisi-tion time.3,5–10These used quantitative methods for image quality to compare techniques using phantoms or very small numbers of patients (up to four).
Rit et al1 used accuracy of verification (measurement of patient-positioning errors) alongside quantitative methods in a study involving patients, by combining a different re-construction algorithm with two gantry speeds. The use of accuracy allows the effect of real patient factors to be included (principally tumour movement and location, and patient size).
image acceptability.12,13Structures are also identified when ver-ification is carried out in radiotherapy, therefore VGA is a good
fit for a study of verification image quality. The alternative observer-based method (receiver operating characteristics) tends to be used to determine the accuracy of a diagnostic technique.12 A hybrid between the two methods is also available.14
VGA has been used in radiotherapy verification by Sweeney et al15 when observers were asked to match 4D-CBCT scans using both four-dimensional (4D) and three-dimensional matching methods. They also found that 4D-CBCT was more accurate than 3D-CBCT because of improved visualization of small tumours with large motion amplitudes and of tumours close to the diaphragm.
Five other radiotherapy studies used VGA to compare portal
film with electronic portal imaging.16–20Three later studies also used VGA but compared other imaging methods.21–23 These included replacing the standard target in the linear accelerator by an aluminium target,21 a modified computed radiography (CR) cassette22and using two different methods of processing CR images.23In all the above studies (which covered a range of body sites including the lung), observers were asked to rate certain aspects of the images such as ease of verification, visi-bility of selected anatomical structures, comparison of one modality with the other or preference for one modality over the other. One study also included accuracy of verification.18
In the study reported here, an investigation of image quality and acceptability of 4D-CBCT for radiotherapy was carried out using VGA to evaluate the effect of three different presets with varying acquisition times and dose.
METHODS AND MATERIALS
The Elekta (Crawley, UK)-recommended preset in XVI software v. 4.5 (Elekta) for the acquisition of 4D-CBCT (known here as Preset 1) takes 4 min to acquire and has a high nominal [volume CT dose index (CTDIvol)] dose. CTDIvol is a standardized method of measuring dose using a cylindrical phantom.24Two additional presets had been created: Preset 3 (identical to the Elekta-recommended 3D-CBCT preset for lung treatment
veri-fication) and Preset 2 (designed to have the same dose as Preset 3 and to have a faster delivery than Preset 1) (Table 1). The likely reduction in image quality due to undersampling from the lower number of projections could render Presets 2 and 3 unsuitable for verification. Any increase in noise due to reduction in mAs is likely to be less significant.7,25 All three presets use 120-kVp X-rays and are delivered over 200° of rotation (start angle 340° and stop angle 180°) with a 27-cm diameterfield of view.
Approval for this study as a service evaluation was given by the Trust’s Research and Development Department. Verification images for this study came from ten patients receiving radical conventionally fractionated radiotherapy between August 2013 Table 1. Presets 1, 2 and 3 compared with a three-dimensional (3D) cone beam CT preset. Preset 1 and the 3D preset have Elekta (Crawley, UK)-recommended values
Preset parameter Preset 1 (Elekta) Preset 2 Preset 3 3D Preset (lung) (Elekta)
Gantry speed (degrees min21) 50 90 180 180
Delivery time 4 min 2 min and 13 s 1 min and 7 s 1 min and 7 s
Approximate number of frames (projections) 1320 700 360 360
mA/frame 20 20 25 25
ms/frame 16 25 40 40
mAs/frame 0.32 0.5 1 1
Total mAs 422.4 350 360 360
Nominal (CTDIvol measured) dose (mGy) 11 9 9 9
Dose (CT dose index scaled by mAs) (mGy) 10.56 8.75 9 9
CTDIvol, volume CT dose index.
and July 2014. These patients had all consented to the use of their images for research purposes as part of their consent to radiotherapy treatment. They were a convenience sample, and VGA was carried out retrospectively. One patient (Patient 6) was excluded from the study because his tumour had been excised, leaving nine patients in the study. All (except Patient 1) were treated supine with arms above their heads, supported by a standard lung board and with a knee rest. Patient 1 was treated prone with head and arms supported by a prone pillow, with a pad beneath his ankles, since a stable supine position had not been achievable without collision with the gantry. All had 4D-CT planning scans acquired (Phillips Brilliance big bore with 2-mm slice thickness). The patients had been unable to comply with the Assisted Breathing Coordinator™ (Elekta) normally used for radical treatment of patients with lung cancer.26
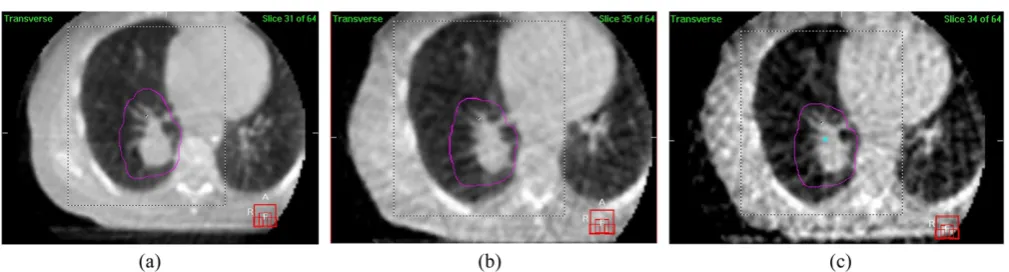
4D-CBCT images were acquired on thefirst three factions using Presets 1, 2 and 3 at Fractions 1, 2 and 3, respectively. Example screen shots are shown inFigure 1.
Four volunteer observers were recruited from the pool of radiographers with advanced competencies in verification for stereotactic lung radiotherapy (which includes the use of 4D-CBCT). The other radiographers would require training in the use of the software. Each observer reviewed all 27 images. For each patient, the images were reviewed from Preset 3first, then from Preset 2 andfinally from Preset 1. In this order, observers would not have prior knowledge of what they might see in the poorer quality images. Blinding the observers was not possible, and the lack of blinding could be a confounding factor.
The observers independently rated the clarity of the edges of the tumour and of certain other thoracic structures.12,16–23Each of the six edges of the tumour were rated since some edges may be clearer to see than others. The other thoracic structures were those commonly used as surrogate structures when reviewing images. The list was based on Yin et al20and was chosen because
it was a comprehensive list without being too onerous. These structures were the vertebrae, chest wall and ribs, clavicle, apex of lung, diaphragm, and trachea, bronchi and carina (the last three structures were combined together).
The clarity scale was chosen to have only four steps (“very clear”, “clear”,“unclear”and“not visible”) to avoid observers choosing the middle option.27 Other VGA studies in radiotherapy have
used an odd number of steps. Afifth option (“not imaged”) was included for the thoracic structures since some would not ap-pear in all of the images.
Next, the observers performed a 4D dual registration match (XVI software v. 4.5) (bone match to a large volume, then 4D grey match to a volume around the tumour) and recorded the translation and rotation patient-positioning errors and rated the acceptability of the match. The acceptability scale was based on the European standard for CT image quality13with changes in wording (“very acceptable”, “acceptable”, “acceptable with res-ervations”and“not acceptable”).
Guidelines were given with examples of images with very clear, clear and unclear tumours, and definitions of acceptability were added. The basis of these definitions is given below:
Very acceptable: The observer encountered no difficulties with
the automatic match.
Acceptable: The observer experienced some uncertainty or made a small manual adjustment (1 or 2 mm).
Acceptable with reservations: The observer used the automatic bone match alone or carried out a full manual match because the grey match failed, or there was excessive rotation, or the observer wanted to discuss the match with a colleague. Unacceptable: The observer would decline to treat based on this
image or wanted a clinician to review the image.
The location of tumour, size of tumour, amplitude of tumour motion and size of the patient were also recorded since they may
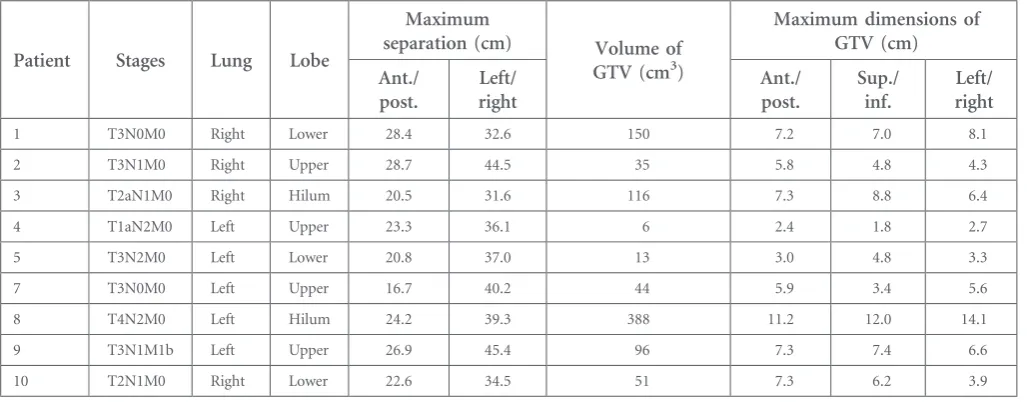
Table 2. Details of the nine patients included in this study with data from their four-dimensional CT planning scans. Patient 6 was excluded
Patient Stages Lung Lobe
Maximum
separation (cm) Volume of
GTV (cm3)
Maximum dimensions of GTV (cm)
Ant./ post.
Left/ right
Ant./ post.
Sup./ inf.
Left/ right
1 T3N0M0 Right Lower 28.4 32.6 150 7.2 7.0 8.1
2 T3N1M0 Right Upper 28.7 44.5 35 5.8 4.8 4.3
3 T2aN1M0 Right Hilum 20.5 31.6 116 7.3 8.8 6.4
4 T1aN2M0 Left Upper 23.3 36.1 6 2.4 1.8 2.7
5 T3N2M0 Left Lower 20.8 37.0 13 3.0 4.8 3.3
7 T3N0M0 Left Upper 16.7 40.2 44 5.9 3.4 5.6
8 T4N2M0 Left Hilum 24.2 39.3 388 11.2 12.0 14.1
9 T3N1M1b Left Upper 26.9 45.4 96 7.3 7.4 6.6
10 T2N1M0 Right Lower 22.6 34.5 51 7.3 6.2 3.9
affect clarity or acceptability.1,2,28The patient separation (anterior/ posterior and left/right), tumour volume and overall tumour size (gross tumour volume, at end exhale) were measured from the planning scans in the treatment planning system. Separation was taken to be the maximum separation on a CT slice containing the planning target volume. The 4D-CBCT software measures the peak-to-peak amplitude of the breathing motion. One factor that can affect image quality is the breathing rate.7The user does not have access to this information without additional equipment or processing of the raw data, therefore it was not included.
The data from the observers were carefully checked to identify errors of completeness in accordance with best practice.29There were nine instances of missing clarity values, which were“missing completely at random” since they were overlooked.29 They were generally replaced by the mode of the values chosen by the same observer for the other structures from the same scan. (A measure of central tendency is an acceptable method of replacing a missing value.29) The choices made by the other observers were also con-sidered since, in two cases,“not imaged”was an appropriate entry.
The analysis was carried out in SPSS® v. 22 (IBM Corp., New York, NY; formerly SPSS Inc., Chicago, IL) using binary logistic re-gression by converting the scales to binary values (the divisions were made between“clear”and “unclear”, and between “ accept-able”and“acceptable with reservations”).“Not imaged”was treated as missing data for the analysis. Logistic regression was chosen because the clarity and acceptability data were non-parametric.30 Ordinal logistic regression could have been used31 but dis-tinguishing between, say, “unclear” and “not visible” did not make clinical sense in this study. To estimate model goodness of
fit, Nagelkerke’s pseudo R2 (which has a potential range from
0 to 1, where 1 indicates a perfect model) was calculated.32
There was a clinical requirement (set by a consultant clinical oncologist) that a preset should get acceptability ratings of “acceptable”or higher and clarity ratings of“clear”or higher on at least 75% of images for it to be clinically useful. This was based on the requirement that an image should have sufficient quality for its purpose.11
RESULTS
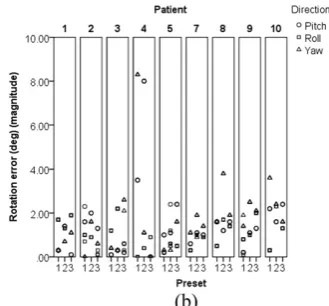
The data on patient size, tumour size and tumour location are presented inTable 2. Only Patient 9 was obese (body mass index .30), and none were severely obese. Scatter plots of patient-positioning errors and box plots of patient breathing motion are shown inFigures 2and3. The VGA results from the observers are summarized inFigures 4and5.
Clarity was tested against preset, patient, observer, structure, lung and lobe of lung, and against patient size, size of tumour and breathing motion. Each variable was tested individually, and those that were significant (p,0.05) were placed together in a backwards stepwise binary logistic regression. Thefinal model is shown inTable 3. Variables were removed from thefinal model if grossly not significant (p.0.1). Two terms that had been signifi -cant in an individual analysis but were removed from the final model (because their significance had increased to .0.1) were breathing motion amplitude in the superior/inferior direction
Figure 3. Tumour motion due to breathing by patient from all images (left/right motion is ,2 mm for all patients and therefore is not included here).
[p50.002, odds ratio (OR)56.912] and breathing motion am-plitude in the anterior/posterior direction (p50.022, OR51.442).
Acceptability was tested against preset, patient, observer, lung and lobe of lung, and against patient size, size of tumour, breathing motion and the magnitude of the positioning errors. The same logistic regression method was used. Acceptability could not be tested against clarity because clarity was assessed 13 times in each scan while acceptability was assessed once. The result showing thefinal model is shown inTable 4. Two terms that had been significant individually were removed from the
final model; they were anterior/posterior dimension of the gross tumour volume (p50.03, OR51.262) and the pitch rotation positioning error (p50.049, OR51.246).
Both clarity and acceptability could not be tested by patient in the
final analyses because the degrees of freedom were reduced. The individual logistic regression results are shown inTables 5and6.
Preset 3 only achieves 44% for clarity (ignoring the “not im-aged”results) and 58% for acceptability, and therefore fails the clinical requirement (Figures 4aand 5a). Preset 2 has 78% for
clarity and 86% for acceptability, whereas Preset 1 has 89% for clarity and 97% for acceptability, therefore both presets meet the clinical requirement.
DISCUSSION
Clarity and acceptability are both significantly affected by preset (Tables 3and4). Preset 1 has the best results, whereas Preset 3 has the least acceptable (lower OR values than either Preset 1 or 2). Preset 2 has the same dose as Preset 3 but has better image quality because more projections are taken thereby reducing undersampling.7
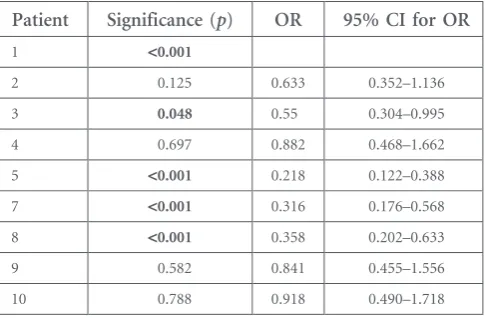
The patient has a statistically significant effect on clarity (Table 5, Figure 4b). Those patients who had a statistically significant effect (Patients 5, 7 and 8) all had tumours that were close to other structures so that the edges were unclear (Figure 4c). These three patients were responsible for most of the“unclear”and“not visible”results for Presets 1 and 2. In clinical practice, images such as these would be reviewed by a clinician and radiographer. Patient 3 is also just statistically significant (p50.048), and this is due to poor visibility of tumour edges with Preset 3, which had been commented on by the
Figure 5. Results for acceptability: (a) by preset and (b) by patient and subdivided by preset.
observers. The OR values show that these patients have lower clarity than Patient 1. The Nagelkerke’sR2value is low (0.075), suggesting that the patients did not influence clarity strongly (other factors may have more influence).30
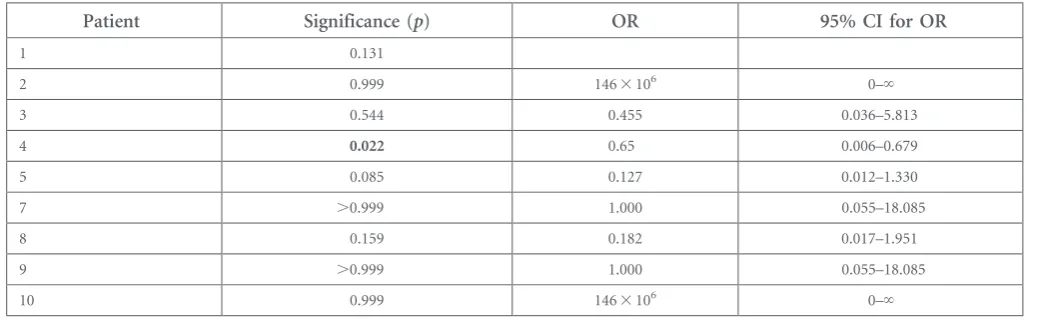
Acceptability is not dependent upon patients but Patient 4 has a significantly poorer acceptability than Patient 1 (Table 6, Figure 5b), and this is due to the high translation and rotation positioning errors seen in the images for this patient (Figure 2). These errors were independent of preset since they occurred on all 3 days. Patient 4 also had a separate nodal planning target volume which made verification decision-making difficult. The positioning errors for this patient are probably responsible for the significance of the anterior/posterior translation error in the
final model for acceptability (Table 4). SPSS was unable tofind a solution for one of the test statistics leading to the calculation of the goodness offit parameters.
Despite providing examples of images where the tumours were “very clear”, “clear” and “unclear” in the instructions, there was still significant variation between observers for clarity (Table 3). Observer 1 was significantly more likely to select “clear” or “very clear” than the other three (their ORs are similar and ,1). The variation existed despite providing sample images, but it is likely that this variation cannot be completely removed. This agrees with the findings of other studies.16,20,23 Defining terms for acceptability did reduce variation between observers.
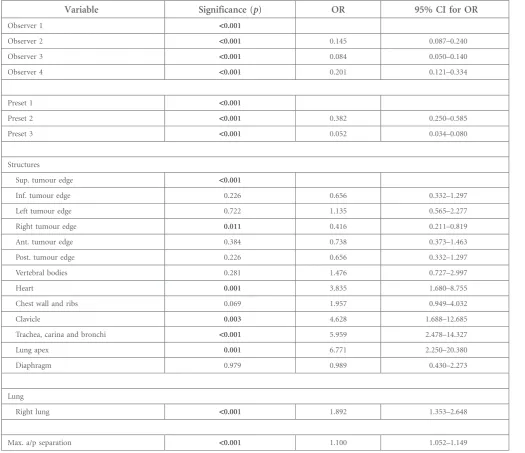
Table 3. Final logistic regression model for clarity. Nagelkerke’sR250.446
Variable Significance (p) OR 95% CI for OR
Observer 1 <0.001
Observer 2 <0.001 0.145 0.087–0.240
Observer 3 <0.001 0.084 0.050–0.140
Observer 4 <0.001 0.201 0.121–0.334
Preset 1 <0.001
Preset 2 <0.001 0.382 0.250–0.585
Preset 3 <0.001 0.052 0.034–0.080
Structures
Sup. tumour edge <0.001
Inf. tumour edge 0.226 0.656 0.332–1.297
Left tumour edge 0.722 1.135 0.565–2.277
Right tumour edge 0.011 0.416 0.211–0.819
Ant. tumour edge 0.384 0.738 0.373–1.463
Post. tumour edge 0.226 0.656 0.332–1.297
Vertebral bodies 0.281 1.476 0.727–2.997
Heart 0.001 3.835 1.680–8.755
Chest wall and ribs 0.069 1.957 0.949–4.032
Clavicle 0.003 4.628 1.688–12.685
Trachea, carina and bronchi <0.001 5.959 2.478–14.327
Lung apex 0.001 6.771 2.250–20.380
Diaphragm 0.979 0.989 0.430–2.273
Lung
Right lung <0.001 1.892 1.353–2.648
Max. a/p separation <0.001 1.100 1.052–1.149
ant., anterior; CI, confidence interval; inf., inferior; Max. a/p separation, maximum anterior/posterior separation of the patient; OR, odds ratio; post., posterior; sup., superior.
The significant structures (Table 3) for clarity are mostly those with many instances of “not imaged”, so their significance probably is artificially raised and the low numbers are often below or close to the requirement for 10 events for binary lo-gistic regression.29 However in certain patients (particularly, Patients 5, 7 and 8), some tumour edges were difficult to dis-tinguish from other adjacent structures which probably accounts for the significant result and low OR for the right edge of tu-mour. All the instances of “acceptable with reservations” for Presets 1 and 2 were associated with Patients 5 and 8, with Patient 4 (due to high positioning errors).
The patient-dependent variables that were thought to affect clarity and acceptability were generally not significant and not included in the final analyses. Further study of more patients would be required to investigate the effect of patient-dependent variables. Right lung had a higher OR than left lung and was significant for both clarity and acceptability. Patients 5, 7 and 8 (with tumours adjacent to other structures) and Patient 4 (with the large positioning errors) had left lung tumours, thereby re-ducing clarity and acceptability for the patients with left lung tumours. The maximum anterior/posterior patient separation was a significant term in thefinal model for clarity but with an OR.1. This suggests that clarity improves as the patient sep-aration increases, which does not make clinical sense.28Patients 5 and 7 (with low clarity levels) had small anterior/posterior separations which may be one explanation for this result.
The Nagelkerke’sR2values suggest that the terms in the models are reasonable predictors of acceptability (0.503) and clarity (0.446).30The events per variable for acceptability is low at 7 (a total of 21 “not acceptable” or “acceptable with reservations” results and 3 variables in thefinal model) while the ideal is 10 or more. This could be improved by more patients or more observers. This suggests that the final model has some un-certainty. The events per variable for clarity is 72 (361 “not visible”or“unclear”results and 5 variables in thefinal model) which is acceptable and suggests a more reliable model.
The logistic regression models show that clarity varies with preset and observer and that acceptability varies with preset. The presence of other significant terms in the models seems to depend more on
whether the tumour is attached/not attached to other structures than the actual values of the terms (e.g.left or right lung).
A prospective study, where the presets could be applied in a random order, may avoid any bias from possible patient anxiety. Patients could also be selected to reduce variability, for example, by excluding those with unusual immobilization, nodal disease or with tumours attached to other structures. Other studies have excluded patient groups such as those with breathing motion ,5 mm1 or those with nodal disease.4 The effect of breathing rate could also be investigated if an external method of measuring could be added.
CONCLUSION
An initial recommendation of Preset 2 could be made, with Preset 1 in reserve for when image quality is insufficient. By choosing Preset 2, the nominal dose is reduced by 18% and the acquisition time is reduced by almost half compared with Preset 1. In certain circumstances, Preset 1 could be preferred. This may include imaging a tumour where the edges are hard to distinguish. Another circumstance might include where the patient has a large separation (larger than the patients in this study), but there was insufficient evidence to state this definitely.
Table 5. Individual logistic regression model for clarity by patient. Nagelkerke’sR250.075
Patient Significance (p) OR 95% CI for OR
1 <0.001
2 0.125 0.633 0.352–1.136
3 0.048 0.55 0.304–0.995
4 0.697 0.882 0.468–1.662
5 <0.001 0.218 0.122–0.388
7 <0.001 0.316 0.176–0.568
8 <0.001 0.358 0.202–0.633
9 0.582 0.841 0.455–1.556
10 0.788 0.918 0.490–1.718
CI, confidence interval; OR, odds ratio. p-values,0.05 are shown in bold. Table 4. Final logistic regression model for acceptability. Nagelkerke’sR250.503
Variable Significance (p) OR 95% CI for OR
Preset 1 0.001
Preset 2 0.242 0.250 0.024–2.552
Preset 3 0.002 0.030 0.003–0.273
a/p error 0.007 0.076 0.012–0.488
Lung
Right lung 0.002 12.264 2.523–57.615
Preset 3 is not recommended since the clarity of the structures and acceptability of the matches was not of sufficient quality to be used for verification.
Future work could include investigating patient breathing mo-tion from both 4D-CT and 4D-CBCT to predict patients who would benefit most from 4D-CBCT. Comparing accuracy of three dimensional and 4D-CBCT matches may also contribute to the selection of patients.
CONFLICTS OF INTEREST
The views expressed in this publication are those of the authors and not necessarily those of the NHS Executive.
FUNDING
This work was supported by The Institute of Cancer Research (ICR) and Cancer Research UK grant numbers C46/A3970 and C33589/A19727 to the ICR Section of Radiotherapy. This work was undertaken in The Royal Marsden NHS Foundation Trust which received a proportion of its funding from the NHS Ex-ecutive. The authors acknowledge NHS funding to the NIHR Biomedical Research Centre at The Royal Marsden and The Institute of Cancer Research.
ACKNOWLEDGMENTS
The authors thank the radiographers who volunteered to act as observers.
REFERENCES
1. Rit S, Nijkamp J, van Herk M, Sonke JJ. Comparative study of respiratory motion correction techniques in cone-beam computed tomography.
Radiother Oncol2011;100: 356–9. doi: http://dx.doi.org/10.1016/j.
radonc.2011.08.018
2. Sonke JJ, Zijp L, Remeijer P, van Herk M. Respiratory correlated cone beam CT.Med Phys2005;32: 1176–86. doi:http://dx.doi. org/10.1118/1.1869074
3. Leng S, Zambelli J, Tolakanahalli R, Nett B, Munro P, Star-Lack J, et al. Streaking artefacts reduction in four-dimensional cone-beam computed tomography.Med Phys2008;35: 4649–59. doi:http://dx.doi.org/10.1118/ 1.2977736
4. Gottlieb KL, Hansen CR, Hansen O, Westberg J, Brink C. Investigation of respi-ration induced intra- and inter-fractional tumour motion using a standard Cone Beam CT.Acta Oncol2010;49: 1192–8.
doi:http://dx.doi.org/10.3109/ 0284186X.2010.498834
5. Brehm M, Paysan P, Oelhafen M, Kunz P, Kachelrieß M. Self-adapting cyclic registra-tion for moregistra-tion-compensated cone-beam CT in image-guided radiation therapy.Med Phys
2012;39: 7603–18. doi:http://dx.doi.org/ 10.1118/1.4766435
6. Jia X, Tian Z, Lou Y, Sonke JJ, Jiang SB. Four-dimensional cone beam CT reconstruction and enhancement using a temporal nonlocal means method.Med Phys2012;39: 5592–602. doi:http://dx.doi.org/10.1118/ 1.4745559
7. Li T, Xing L. Optimizing 4D cone-beam CT acquisition protocol for external beam ra-diotherapy.Int J Radiat Oncol Biol Phys2007; 67: 1211–19. doi:http://dx.doi.org/10.1016/j. ijrobp.2006.10.024
8. Lu J, Guerrero TM, Munro P, Jeung A, Chi PC, Balter P, et al. Four-dimensional cone beam CT with adaptive gantry rotation and
adaptive data sampling.Med Phys2007;34: 3520–9. doi:http://dx.doi.org/10.1118/ 1.2767145
9. Maurer J, Godfrey D, Wang Z, Yin FF. On-board four-dimensional digital tomosynthe-sis:first experimental results.Med Phys2008; 35: 3574–84. doi:http://dx.doi.org/10.1118/ 1.2953561
10. Fast MF, Wisotzky E, Oelfke U, Nill S. Actively triggered 4d cone-beam CT acquisi-tion.Med Phys2013;40: 091909. doi:http:// dx.doi.org/10.1118/1.4817479
11. National Radiotherapy Implementation Group (UK). Image guided radiotherapy; 2012. Available from:http://webarchive. nationalarchives.gov.uk/20130513211237/ http://ncat.nhs.uk/sites/default/files/ work-docs/National%20Radiotherapy% 20Implementation%20Group%20Report% 20IGRTAugust%2020121.pdf
12. Bath M. Evaluating imaging systems: practi-˚ cal applications.Radiat Prot Dosimetry2010;
Table 6. Individual logistic regression model for acceptability by patient. Nagelkerke’sR250.354, but SPSS® (IBM Corp., New York, NY; formerly SPSS Inc., Chicago, IL) had been unable to achieve a final solution
Patient Significance (p) OR 95% CI for OR
1 0.131
2 0.999 1463106 0–‘
3 0.544 0.455 0.036–5.813
4 0.022 0.65 0.006–0.679
5 0.085 0.127 0.012–1.330
7 .0.999 1.000 0.055–18.085
8 0.159 0.182 0.017–1.951
9 .0.999 1.000 0.055–18.085
10 0.999 1463106 0–‘
139: 26–36. doi:http://dx.doi.org/10.1093/ rpd/ncq007
13. European Commission.European guidelines on quality criteria for computed tomography (EUR 16262 EN). Luxembourg: Office for Official Publications of the European Com-munities; 2000.
14. Bath M, M˚ ansson LG. Visual grading charac-˚ teristics (VGC) analysis: a non-parametric rank-invariant statistical method for image quality evaluation.Br J Radiol2007;80: 169–76. doi: http://dx.doi.org/10.1259/bjr/35012658 15. Sweeney RA, Seubert B, Stark S, Homann V,
M¨uller G, Flentje M, et al. Accuracy and inter-observer variability of 3D versus 4D cone-beam CT based image-guidance in SBRT for lung tumors.Radiat Oncol2012;7: 81. doi: http://dx.doi.org/10.1186/1748-717X-7-81 16. Gagel B, Schramm O, Harms W, Mulhern A,
Wenz F, van Kampen M, et al. The electronic portal imaging system Siemens Beamview Plus versus the conventional verification
films CEA-TVS and DuPont COL-7. A critical appraisal of visual image quality.
Strahlenther Onkol2002;178: 446–52. 17. Hatherly K, Smylie J, Rodger A. A
compar-ison offield-only electronic portal imaging hard copies with double exposure portfilms in radiation therapy treatment setup confi r-mation to determine its clinical application in a radiotherapy center.Int J Radiat Oncol Biol Phys1999;45: 791–6. doi:http://dx.doi. org/10.1016/S0360-3016(99)00249-7 18. Kruse JJ, Herman MG, Hagness CR, Davis BJ,
Garces YI, Haddock MG, et al. Electronic and
film portal images: a comparison of land-mark visibility and review accuracy.Int J
Radiat Oncol Biol Phys2002;54: 584–91. doi: http://dx.doi.org/10.1016/S0360-3016(02) 02955-3
19. Lavertu S, Girouard LM, Pouliot J. Observa-tion study of electronic portal images for off-line verification.Radiother Oncol2000; 54: 47–55. doi:http://dx.doi.org/10.1016/ S0167-8140(99)00171-1
20. Yin FF, Rubin P, Schell MC, Wynn R, Raubertas RF, Uschold G, et al. An observer study for direct comparison of clinical efficacy of electronic tofilm portal images.
Int J Radiat Oncol Biol Phys1996;35: 985–91. doi:http://dx.doi.org/10.1016/0360-3016(96) 00205-2
21. Flampouri S, McNair HA, Donovan EM, Evans PM, Partridge M, Verhaegen F, et al. Initial patient imaging with an optimised radiotherapy beam for portal imaging.
Radiother Oncol2005;76: 63–71. doi:http:// dx.doi.org/10.1016/j.radonc.2005.04.006 22. Fujita H, Morimi S, Yamaguchi M, Fukuda
H, Murase K. Effectiveness of the single-shot dual-energy subtraction technique for portal images.J Appl Clin Med Phys2011;12: 24–32. doi:http://dx.doi.org/10.1120/jacmp. v12i4.3232
23. Yamada S, Murase K. Effectiveness offlexible noise control image processing for digital portal images using computed radiography.
Br J Radiol2005;78: 519–27. doi:http://dx. doi.org/10.1259/bjr/26039330
24. Hyer DE, Hintenlang DE. Estimation of organ doses from kilovoltage cone-beam CT imaging during radiotherapy patient position verification.Med Phys2010;37: 4620–6. doi: http://dx.doi.org/10.1118/1.3476459
25. Zarb F, Rainford L, McEntee MF. Image quality assessment tools for optimization of CT images.Radiography2010;16: 147–53. doi:http://dx.doi.org/10.1016/j.
radi.2009.10.002
26. McNair HA, Brock J, Symonds-Tayler JR, Ashley S, Eagle S, Evans PM, et al. Feasibility of the use of the Active Breathing Co-ordinator (ABC) in patients receiving radical radiotherapy for non-small cell lung cancer (NSCLC).Radiother Oncol2009;93: 424–9. doi:http://dx.doi.org/10.1016/j.
radonc.2009.09.012
27. Petrie A, Sabin C.Medical statistics at a glance. 3rd edn. Oxford, UK: Wiley-Blackwell; 2009. p. 102.
28. Gardner SJ, Studenski MT, Giaddui T, Cui Y, Galvin J, Yu Y, et al. Investigation into image quality and dose for different patient geom-etries with multiple cone-beam CT systems.
Med Phys2014;41: 031908. doi:http://dx. doi.org/10.1118/1.4865788
29. Peacock JL, Peacock PJ.Oxford
handbook of medical statistics. Oxford, UK: Oxford University Press; 2011. p. 116. pp. 402–27.
30. Dancey CP, Reidy JG, Rowe R.Statistics for the health sciences. London, UK: SAGE Publications; 2012. pp. 402–24. 31. Smedby ¨O, Fredrikson M. Visual grading
regression: analysing data from visual grading experiments with regression models.Br J Radiol2010;83: 767–75. doi:http://dx.doi. org/10.1259/bjr/35254923