International Journal of Synergy and Research
Vol. 7, 2018 pp. 145-159
Demographic
Aging of Polish
Society and Its
Effects from the
Point of View of
Pension Finance
Demographic Aging of Polish Society
and Its Effects from the Point of View
of Pension Finance
Maciej Raszewski
Faculty of Economics, Maria Curie-Skłodowska University, Poland
[email protected]
Teresa H. Bednarczyk
Faculty of Economics, Maria Curie-Skłodowska University, Poland
[email protected]
Abstract
Purpose – The aim of the study was to assess the effects of introducing the formula of defined contribution, as analyzed from the perspective of pension adequacy in Poland.
Methodology – The main research methods employed included literature studies, theoretical considerations, and an empirical analysis of statistical data.
Findings – The Polish pension system may be closer to balancing, but at the expense of lowering the replacement rate, which under the current conditions may even fall below the poverty threshold. Extending the universal retirement age may partly improve the financial situation of future pensioners, especially women.
Originality/Value – In conclusion, it was observed that the legislators’ excessive preoccupation with maintaining long-term financial sustainability is not conducive to the achievement of other important goals of the pension system, such as ensuring the adequacy of pensions and preventing elderly people from falling into poverty. In light of the above, further reforms may still be required.
Keywords – retirement, social insurance, contributions, demography, poverty
1. Introduction
The 1999 reform of the Polish pension system introduced many important changes, including a shift from a defined benefit system to a defined contribution system where the formula for calculating pensions is concerned (ZUS, 2016, p. 12). The legislators were primarily concerned with ensuring the long-term sustainability of the pension fund by automatically adjusting the amount of due benefits to the value of contributions to the system (MRPiPS n.d.; Nowacka and Sciblo, 2017, p. 192; Hady et al., 2007, p. 6). The new formula also takes into account the number of payments resulting from the longer life expectancy of retirees (Waligórska, 2011, pp. 20–30). The logical consequence of this mechanism is the possible improvement of systemic solvency, but achieved at the expense of the pension-to-wage ratio, as measured with the so-called theoretical replacement rate (Jędrasik-Jankowska, 2008, p. 22; Bednarczyk, 2015, p. 45). As the average life expectancy of retirees continues to grow, mechanisms are required that
IJSR
7
will at least partially compensate for the projected decrease in replacement rates, one of which entails extending the period of professional activity (Wiktorowicz, 2014, p. 7), which can be achieved by increasing the universal retirement age (Ratajczyk-Tuchołka, 2012, pp. 64–69; Owczarek, 2009, p. 4) or postponing individual employees’ retirement decisions (Sztanderska, 2008, p. 70).
The main objective of the study was to assess the economic impact of introducing the defined contribution system from the point of view of income adequacy of pensions in Poland. An additional goal was to analyze the change of universal retirement age and to estimate its effects on the future level of replacement rates. The research question was: will the Polish pension system, after the reforms carried out, protect all insured citizens from poverty?
The research hypotheses were verified. H1: The public pension system in Poland may be closer to financial sustainability, but at the cost of lowering the replacement rate, which under current demographic conditions may indeed drop below the poverty threshold. H2: Extending the universal retirement age may partly improve the financial situation of future pensioners, especially women.
The main research methods included a literature review, theoretical considerations and an empirical analysis of statistical data. Statistical data was used to simulate pension amounts (in two variants) based on the defined contribution pension formula. The results obtained were compared with the poverty risk indicator and the level of remuneration in Poland.
The research has some limitations. First of all, the author assumes the indexation of pensions (cost of living adjustment) and inflation were omitted, assuming that the economic growth rate will be at least equal to inflation so that the phenomena will cancel each other out. In practice, indexation of pensions depends on the government’s decision and may be higher than inflation. Secondly, the amount of the minimum wage (set by the government) can grow faster than the average wage. Thirdly, demographic conditions may change due to the phenomenon of immigration of foreigners to Poland.
The structure of the article is as follows: the first part outlines the demographic situation in Poland in the context of balancing the pension system, the second part presets a two-variant simulation of the adequacy of Poles’ future pensions, and the conclusion presents a synthesis of the research findings.
2. Demographic situation in Poland in the context of
balancing the pension system
Demography is the most important factor affecting the sustainability and adequacy of public pension systems operating within the social insurance framework. Like many other European countries, Poland is currently struggling with the demographic aging of its society. The phenomenon stems from the progressing depopulation of the country coupled with a continually deteriorating old-age dependency ratio. Demographic forecasts for Poland, in the form of age pyramids, are presented in Figure 1.
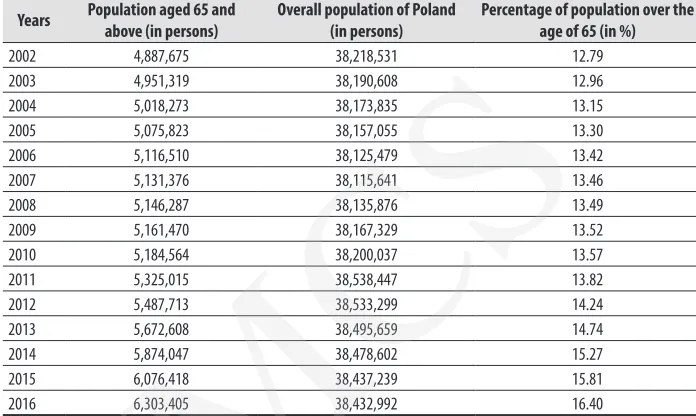
What follows from an analysis of the population pyramids is that between the 1960s and the mid-1990s, the Polish population continued to grow. Unfortunately, by 2017, the population had already decreased by over 28 thousand people and the forecasts for 2060 suggest that the Polish population is likely to suffer a further rapid decline (as many as 8 million people over a period of 43 years). In addition, the age structure is also bound to change significantly. The number of retirees continues to increase (the top of the pyramid is expanding), while the number of people of working age is decreasing (the central part of the pyramid is narrowing). Equally worrying is the visible decline in the pre-working age population (the narrowing bottom part of the pyramid) as it is a clear indication that in the following years, the age structure is bound to deteriorate further, and the phenomena of depopulation and aging can only be expected to exacerbate. The demographic forecasts prove to be fairly reliable seeing as the percentage of people aged over 65 years has been constantly growing since the year 2000 (cf. Table 1).
Figure 1.
Population Pyramids for Poland, factual situation (1960, 1995, 2017) and forecast (2060)
Source: Population Pyramids of the World (2018).
Demographic
Aging of Polish
Society and Its
Effects from the
Point of View of
Pension Finance
IJSR
7
Years Population aged 65 and above (in persons) Overall population of Poland(in persons) Percentage of population over the age of 65 (in %)2002 4,887,675 38,218,531 12.79
2003 4,951,319 38,190,608 12.96
2004 5,018,273 38,173,835 13.15
2005 5,075,823 38,157,055 13.30
2006 5,116,510 38,125,479 13.42
2007 5,131,376 38,115,641 13.46
2008 5,146,287 38,135,876 13.49
2009 5,161,470 38,167,329 13.52
2010 5,184,564 38,200,037 13.57
2011 5,325,015 38,538,447 13.82
2012 5,487,713 38,533,299 14.24
2013 5,672,608 38,495,659 14.74
2014 5,874,047 38,478,602 15.27
2015 6,076,418 38,437,239 15.81
2016 6,303,405 38,432,992 16.40
Source: Authors’ elaboration based on GUS (2018a).
In the context of worldwide demographic changes, Poland finds itself in a group of countries where the percentage of people over the age of 65 approaches 20%. The international demographic situation is presented in Figure 2.
Source: Based on data from Population Pyramids of the World (2018).
Poland has based its pension system on the insurance principle (pay-as-you-go), which is the most common system in Europe (European Commission, 2017, p. 1). However, the demographic situation had a negative impact on pension finance. Ageing population means that the volume of contributions is not sufficient to finance current
Table 1.
Population aged 65 and above in Poland (2002–2016)
Figure 2.
Map of population aged 65 and above (% of total)
pensions. The pension fund deficit has been a problem for many years and can now be fairly safely assumed to be a permanent factor. Another problem which has had an increasingly significant impact on the situation over the last several decades stems from the state’s use of the pension system as an instrument in the fight against unemployment. In 1990–2010, the citizens have been granted the ability to terminate their professional activity prematurely (early retirement, bridging pensions, pre-retirement benefits) and state policy did nothing to discourage their early withdrawal from the labor market (Rosner and Stanny, 2008, p. 5).
The pension fund deficit and the growing need for subsidies to cover the same were the main reasons behind the changes introduced in 1999. This rather radical reform introduced, among other elements, the formula of defined contributions (DC) which promised a chance to reduce the deficit without raising pension contributions at the expense of reducing the amount of future pensions. The phenomenon of growing life expectancy observed in recent years (see Tables 2 and 3) also does not facilitate the balancing of the pension fund.
Years
Males Females by age
0 15 30 45 60 65 67 75 0 15 30 45 60 65 67 75
1990 66.2 53.1 39.1 26.1 15.3 12.4 11.3 7.5 75.2 61.8 47.2 33 20 16.1 14.6 9.5 1991 65.9 52.6 38.6 25.7 15.1 12.3 11.2 7.4 75.1 61.6 46.9 32.7 19.8 15.9 14.4 9.3 1992 66.5 53.1 39.1 26.1 15.4 12.5 11.5 7.7 75.5 61.9 47.3 33.1 20.1 16.2 14.7 9.5 1993 67.2 53.7 39.6 26.4 15.5 12.6 11.5 7.7 75.8 62.2 47.5 33.2 20.1 16.2 14.7 9.4 1994 67.5 53.9 39.9 26.7 15.8 12.8 11.7 7.8 76.1 62.4 47.7 33.5 20.4 16.4 14.9 9.6 1995 67.6 53.9 39.8 26.7 15.8 12.9 11.8 7.9 76.4 62.6 47.9 33.6 20.5 16.6 15.1 9.7 1996 68.1 54.3 40.2 26.9 15.9 12.9 11.8 7.9 76.6 62.7 48 33.7 20.5 16.5 15.0 9.7 1997 68.5 54.5 40.4 27.1 16.1 13.1 12.0 8.2 77 62.9 48.2 33.9 20.8 16.8 15.3 9.9 1998 68.9 54.8 40.7 27.4 16.4 13.4 12.3 8.4 77.3 63.2 48.5 34.2 21 17.0 15.5 10 1999 68.8 54.8 40.6 27.3 16.3 13.3 12.2 8.3 77.5 63.3 48.6 34.3 21.1 17.1 15.6 10.1 2000 69.7 55.6 41.4 27.9 16.7 13.6 12.5 8.6 78 63.8 49 34.7 21.5 17.5 15.9 10.4 2001 70.2 56 41.8 28.3 17 13.9 12.8 8.8 78.4 64.1 49.4 35 21.8 17.7 16.2 10.6 2002 70.4 56.2 42 28.5 17.2 14.1 12.9 8.8 78.8 64.5 49.8 35.4 22.2 18.0 16.5 10.8 2003 70.5 56.3 42 28.5 17.1 14.0 12.8 8.7 78.9 64.6 49.8 35.4 22.2 18.1 16.5 10.8 2004 70.7 56.4 42.1 28.6 17.4 14.2 13.1 8.9 79.2 64.9 50.1 35.7 22.5 18.4 16.8 11 2005 70.8 56.5 42.2 28.7 17.5 14.4 13.2 9 79.4 65 50.3 35.8 22.7 18.6 17.0 11.2 2006 70.9 56.6 42.3 28.8 17.7 14.5 13.3 9.1 79.6 65.2 50.5 36 22.8 18.8 17.2 11.3 2007 71 56.6 42.4 28.8 17.7 14.6 13.4 9.1 79.7 65.3 50.6 36.1 22.9 18.9 17.3 11.4 2008 71.3 56.9 42.6 29.1 17.9 14.7 13.5 9.2 80 65.5 50.8 36.3 23.1 19.0 17.5 11.5
Demographic
Aging of Polish
Society and Its
Effects from the
Point of View of
Pension Finance
Table 2.
Life expectancy in Poland 1990–2016
IJSR
7
Years Males by age Females0 15 30 45 60 65 67 75 0 15 30 45 60 65 67 75
2009 71.5 57.1 42.9 29.3 17.9 14.7 13.6 9.2 80.1 65.6 50.9 36.4 23.2 19.1 17.5 11.6 2010 72.1 57.6 43.3 29.7 18.3 15.1 13.9 9.5 80.6 66.1 51.3 36.8 23.5 19.4 17.8 11.9 2011 72.4 58 43.7 30 18.5 15.3 14.1 9.7 80.9 66.4 51.6 37.1 23.8 19.7 18.1 12.1 2012 72.7 58.2 43.9 30.2 18.6 15.4 14.2 9.7 81 66.5 51.7 37.1 23.8 19.7 18.1 12.2 2013 73.1 58.6 44.3 30.5 18.7 15.5 14.3 9.8 81.1 66.6 51.8 37.3 23.9 19.8 18.2 12.3 2014 73.8 59.2 44.9 31 19.2 15.9 14.6 10.1 81.6 67.1 52.3 37.7 24.3 20.2 18.6 12.6 2015 73.6 59 44.7 30.8 19 15.7 14.5 10 81.6 67 52.2 37.6 24.1 20.1 18.5 12.5 2016 73.9 59.4 45 31.2 19.3 16.0 14.8 10.3 81.9 67.3 52.5 38 24.5 20.4 18.8 12.8
Source: Authors’ elaboration based on GUS (2018b).
Men – life expectancy (in years)
Years Age 0 Age 65 Age 67
1990 66.2 12.4 11.3
2016 73.9 16.0 14.8
Increase 7.7 3.6 3.5
Women – life expectancy (in years)
Year Age 0 Age 60 Age 67
1990 75.2 20 14.6
2016 81.9 24.5 18.8
Increase 6.7 4.5 4.2
Source: Authors’ elaboration based on GUS (2018b).
According to the forecasts published by GUS (Polish Central Statistical Office), men born in 2016 will live longer by 7.7 years than men born in 1990, and women by 6.7 years, respectively. The longer life expectancy and, consequently, longer period of pension eligibility, will obviously increase the expenditure of the pension fund. A man born in 1990 is expected, on average, to receive a pension for a period of 12.4 years, whereas for one born in 2016 the period of pension eligibility will be 16 years, i.e. 3.6 years longer. For a woman the periods will be, respectively, 20 and 24.5 years, i.e. 4.5 years longer. The period of pension eligibility for both sexes can be reduced by extending the retirement age to 67 years (see Table 3).
The pension fund deficit has not been eliminated despite the reform introduced in 1999 (see Table 4). This suggests that said deficit may stem from a variety of factors related both to the levels of revenues and expenditures of the pension fund, including: unfavorable demographic phenomena, too low pension contribution rate (currently 19.52% of the basis), too low remuneration basis (low earnings of most employees), contribution exemptions for top earners (income thresholds), no reduction in the pension amount for professionally active retirees (Ancyparowicz, 2014, pp. 6–7).
Table 2.
Life expectancy in Poland 1990–2016
Table 3.
Life expectancy for 0-, 60-, 65- and
Polish pension fund Years Income
(PLN billion)
Expenses (PLN billion)
Balance (deficit) (PLN billion)
Year-on-year dynamics (%)
1999 27.84 37.80 -9.96 100
2000 29.18 40.34 -11.16 112
2001 33.82 46.14 -12.32 110
2002 31.48 48.98 -17.50 142
2003 34.51 52.94 -18.43 105
2004 34.71 58.01 -23.30 126
2005 35.94 61.02 -25.08 108
2006 39.03 69.16 -30.13 120
2007 45.06 73.70 -28.64 95
2008 47.02 84.12 -37.10 130
2009 46.90 95.34 -48.44 131
2010 51.06 101.69 -50.63 105
2011 61.61 106.24 -44.63 88
2012 72.00 111.12 -39.12 88
2013 75.69 116.99 -41.30 106
2014 78.69 121.26 -42.57 103
2015 88.22 126.34 -38.12 90
2016 93.89 131.08 -37.19 98
Source: Authors’ elaboration based on Polish budget acts 1999–2016 (Ministry of Finance, 2017).
Poland is not the only country whose pension system is affected by the demographic situation. The circumstances require that, e.g. the universal retirement age be adapted to the demographic and economic situation of the country in question (Żukowski, 2014, pp. 43–52). Failure to adjust the universal retirement age to the demographic situation and maintaining a relatively low retirement age may pose a problem for the long-term financial sustainability of the pension system and consequently the standard of living of individual pensioners (Szukalski, 2006, pp. 57–58).
Initially (1999), the retirement age was gender-dependent, 60 years for women and 65 for men. It was not until 2013 that a decision was made to gradually increase the retirement age to 67 and equalize it for both sexes as a part of the efforts to reduce the deficit of the pension fund. However, after only 4 years the reform was discontinued. In 2017, a decision was made to return to the previous retirement age thresholds (60 years for women and 65 years for men). The authorities argued that the reduction of the retirement age was necessitated by the regulations of Convention No. 102 of the International Labor Organization (ILO, 1952, p. 26) which stated that the retirement age cannot exceed 65 years and any further extension thereof should depend on the elderly people’s ability to work in a given country. Another argument brought up in favor of returning to the 60/65 retirement age threshold related to the difference between general life expectancy and healthy life expectancy. The average healthy life expectancy in Poland is currently lower than the EU average (cf. Table 5).
Demographic
Aging of Polish
Society and Its
Effects from the
Point of View of
Pension Finance
Table 4.
Balance sheet of the Polish pension fund 1999–2016
IJSR
7
Years 2005 2006 2007 2008 2009Female2010 2011 2012 2013 2014 2015UE 8.9 9 9 8.5 8.4 8.8 8.6 8.5 8.6 8.6 9.4
Poland 10.2 8.2 7.1 7.7 7.7 7.5 8.3 7.8 7.8 8.1 8.4
Male
UE 8.6 8.8 8.7 8.3 8.4 8.7 8.5 8.5 8.5 8.6 9.4
Poland 8.4 7.3 6.5 7 6.9 6.7 7.6 7.4 7.2 7.5 7.6
Source: Authors’ elaboration based on Eurostat (2018a).
The reduction of the retirement age introduced in October 2017 resulted in the predictable increase in the number of retirees and, in consequence, in overall pension fund expenditures (see Table 6).
Month Year Number of r
etir
ees
(in thousands) Number of r
etir
ees
dynamics (Jan. 2017 = 100%) Expenditur
e of the
pension fund (PLN billion) Dynamics of the pension fund
’s
expenditur
e
(Jan. 2017 = 100%) Average pension (PLN) Average pension dynamics (Jan. 2017 = 100%) January 2017 5,168.60 100.00% 11.10 100.00% 2,177.09 100.00% February 2017 5,168.50 100.00% 11.07 99.73% 2,141.85 99.76% March 2017 5,165.10 99.93% 11.19 100.81% 2,166.54 100.91% April 2017 5,175.60 100.14% 11.22 101.08% 2,167.82 100.97%
May 2017 5,185.00 100.32% 11.26 101.44% 2,171.53 101.14%
June 2017 5,190.40 100.42% 11.23 101.17% 2,164.31 100.80%
July 2017 5,189.10 100.40% 11.25 101.35% 2,167.19 100.94%
August 2017 5,195.70 100.52% 11.34 102.16% 2,181.90 101.62% September 2017 5,214.00 100.88% 11.37 102.43% 2,181.59 101.61% October 2017 5,422.60 101.24% 11.66 105.05% 2,228.89 103.81% November 2017 5,388.80 104.26% 12.17 109.64% 2,257.60 105.15% December 2017 5,493.80 106.29% 12.13 109.28% 2,207.92 102.83% January 2018 5,525.00 106.90% 12.19 109.82% 2,206.66 102.77%
Source: Authors’ elaboration based on ZUS (2018a, pp. 15–17; 2018b, pp. 15–17).
After analyzing the tabularized data above we observe that the dynamics of pension fund expenditures grew faster than the dynamics of the number of retirees, with a significant decrease in the average pension as from November 2017 (the month following the month of the reform re-lowering the universal retirement age).
Table 5.
Healthy life years at age 65 in EU and Poland (by gender)
Table 6.
Amount of pension payments from the Pension Fund, number of retirees and average pension in Poland
3. The adequacy of pensions in Poland – simulations
The phenomenon of increasing life expectancy has a negative impact on the level of future pensions, mainly due to the adopted formula of defined contribution (pensions before the reform were calculated based on the formula of defined benefit). Insured persons who started their professional activity after 1998 will have pensions calculated according to the following formula.
Source: Based on Article 26 of the Act on old-age and disability pensions from the Social Insurance Fund (Polish Journal of Laws 1998, p. 25).
It follows from the above that the pension amount is inversely proportional to average life expectancy. The constantly growing average life expectancy means that for a given value of recorded contributions, pensions awarded to retirees of the successive age groups must be lower.
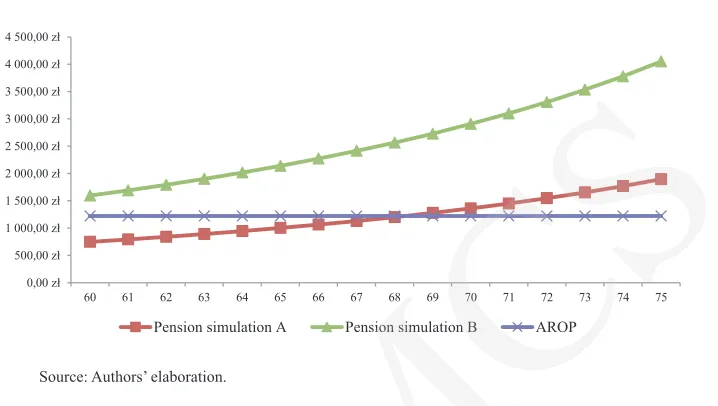
The adequacy of future pensions can be assessed on the basis of the theoretical replacement rate, understood as the relation of the future pension in question to the average wage. Table 7 presents the results of simplified simulations regarding the amount of future benefits of Polish pensioners and the probable replacement rate depending on the amount of earnings and the retirement age. We assume that an 18-year-old employee beginning his or her professional activity in 2017 will remain professionally active for at least 42 years. In simulation A, we assume that the employee’s earnings oscillate around the minimum wage throughout the entire period of his/her work life (in 2017 it was PLN 2,000). In simulation B, we assume that these earnings oscillate around the average wage in the economy (in 2017 it was PLN 4,271.51). In the simulations, the indexation of pensions (cost of living adjustment) and inflation were omitted, assuming that the economic growth rate will be at least equal to inflation so that the phenomena will cancel each other out.
In assessing the extent to which the pension system’s objective of preventing poverty is realized, the at-risk-of-poverty threshold (AROP) was adopted as the basic measure of poverty. When calculated for an adult individual in Poland in 2016, the threshold was PLN 1,222 per month (GUS, 2017a, p. 156). As a relative measure, AROP is defined as 60% of the national median equivalised disposable income after social transfers (Eurostat, 2018b). Upon analyzing the data in Table 7 it can be observed that the respective levels of pensions and replacement rates for people whose earnings oscillate around the minimum wage are very low. In order to secure a pension at the level at least equal to the 2016 poverty threshold would require a person earning the minimum wage to postpone their retirement decision until at least the age of 68. The decision to retire at an earlier age creates a very tangible risk of pensioner poverty (the pension amount will be lower than PLN 1,222). The situation is further exacerbated given that the current universal retirement age for women is 60 years and many women indeed decide to quit their professional activity at this age. According to the simulation, the retirement pension for a 60-year-old female pensioner whose earnings throughout the period of
Demographic
Aging of Polish
Society and Its
Effects from the
Point of View of
Pension Finance
IJSR
7
her professional activity oscillated around minimum wage is PLN 748 (the theoretical replacement rate, understood as the relation between retirement benefit and the average wage in 2017, will be only 17.5%). In Poland, the average earnings of women are still lower than those of men (gender pay gap) (GUS, 2016, p. 3). A man retiring at the age of 65 will receive a pension of PLN 1,003 and the relevant replacement rate will be approx. 23.5%. In practice, these pensions may be even lower if the actual seniority is shorter than assumed in the simulation for reasons such as later start of professional activity (e.g. extension of the study period) or breaks in employment (e.g. periods of unemployment).
The difficult situation of future pensioners who have low salaries and paid low pension contributions is somewhat mitigated by the minimum guaranteed pension mechanism. Statutory regulations (Polish Journal of Laws, 1998, pp. 52–53) ensure that people with adequate seniority (20 years for women and 25 years for men) receive a pension in the amount not lower than PLN 1,000 (in 2017). However, the current minimum old-age pension is nonetheless already lower than the poverty threshold (AROP = 1,222 PLN).
The situation of people earning the average wage is considerably better. The simulated pension for a woman retiring at the age of 60 is PLN 1,597 with the replacement rate of 37.4%. The simulated pension for a man retiring at the age of 65 is higher and amounts to PLN 2,141 (replacement rate 50.1%). It is higher than the minimum wage.
Table 7.
Simulated pension and replacement rate depending on earnings and retirement age Retirement age (years) Average life expectancy (in months) Seniority (years) Simulation A
An insured employee earning a minimum wage (PLN 2,000 in 2017)
Simulation B
An insured employee earning an average wage (PLN 4,271.51 in 2017) Pension (PLN) Replacement rate (%) Pension (PLN) Replacement rate (%)
60 263.2 42 747.57 17.50 1,596.64 37.38
61 254.2 43 792.47 18.55 1,692.53 39.62
62 245.4 44 839.98 19.66 1,793.99 42.00
63 236.6 45 891.02 20.86 1,903.01 44.55
64 228.1 46 944.76 22.12 2,017.79 47.24
65 219.6 47 1,002.67 23.47 2,141.45 50.13
66 211.3 48 1,064.22 24.91 2,272.92 53.21
67 203.0 49 1,130.81 26.47 2,415.14 56.54
68 194.9 50 1,201.85 28.14 2,566.85 60.09
69 186.9 51 1,278.36 29.93 2,730.26 63.92
70 178.9 52 1,361.71 31.88 2,908.28 68.09
71 171.1 53 1,451.17 33.97 3,099.33 72.56
72 163.4 54 1,548.22 36.25 3,306.62 77.41
73 155.7 55 1,654.87 38.74 3,534.41 82.74
74 148.2 56 1,770.23 41.44 3,780.79 88.51
75 140.8 57 1,896.55 44.40 4,050.56 94.83
Source: Authors’ elaboration.
Source: Authors’ elaboration.
The following conclusions can be drawn from the data in Table 7. Pensions of people earning the minimum wage will be very low and will fall below the poverty threshold. Only earnings at the level of the average wage can protect pensioners against poverty. People earning the minimum wage have little hope for a decent pension even if the decision to retire is postponed. To achieve a replacement rate of 40% one would have to continue working until 73–74 years of age. Moreover, given the growing life expectancy indicators, the same is not even the worst case scenario (cf. Table 2). What follows is the conclusion that the basic tasks of social insurance – i.e. prevention of old-age poverty – will not be fully realized.
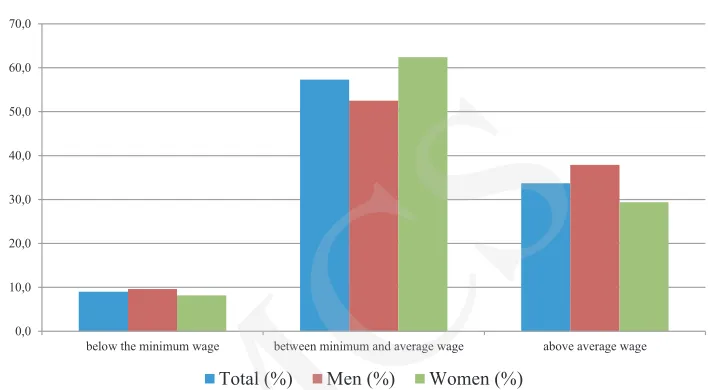
On the basis of the described simplified simulations, it can be stated that under the current conditions, the pension system can provide protection against poverty only to people whose earnings are at least on a par with the average wage. According to data from 2016, this applies only to 34% of all employees, including almost 40% of men and 30% of women (see Table 8 and Figure 4). Over 66% of Polish employees in Poland earn wages below the average, a percentage that reaches almost 71% in the case of women.
Remuneration Total Men Women (%) (%) (%)
Below the minimum wage 9.0 9.6 8.2
Between minimum and average wage 57.3 52.5 62.4
Above average wage 33.7 37.9 29.4
In total 100 100 100
Below average wage 66.3 62.1 70.6
Source: Authors’ elaboration based on GUS (2018b, p. 288).
Demographic
Aging of Polish
Society and Its
Effects from the
Point of View of
Pension Finance
Figure 3.
The forecasted pension amounts according to A and B simulations relative to the poverty threshold (AROP – 2016)
Table 8.
Paid employment by gross wage amount (2016, by gender)
0,00 zł 500,00 zł 1 000,00 zł 1 500,00 zł 2 000,00 zł 2 500,00 zł 3 000,00 zł 3 500,00 zł 4 000,00 zł 4 500,00 zł
60 61 62 63 64 65 66 67 68 69 70 71 72 73 74 75
Pension simulation A Pension simulation B AROP
IJSR
7
Source: Authors’ elaboration based on GUS (2018b, p. 288).
The Polish pension system will require additional reforms. The possibility of raising the retirement age to 67 years for both sexes should be taken into account. However, it should be noted that even then the amount of old-age pension for people earning the minimum wage will remain dangerously close to the poverty threshold and will not substantially improve their financial situation.
The final issue to consider is the vulnerability of the pension system to the so-called political risk. The powers-that-be tend to undertake reforms of the pension system with the average voter in mind. If the median of the average voter is elderly, the authorities can decide on reforms that will benefit the elderly. Young people may feel reluctant to support an aging population and choose to emigrate to countries with a better demographic balance (Blake, 2006, p. 176). The deteriorating demography in Poland will also have a negative impact on the internal market, which may in turn influence the rates of consumption and investment. A similar situation can be observed in Bulgaria and Lithuania (Standerski & Konopczyński, 2017, p. 9).
4. Conclusions
The Polish pension system is structured within the framework of the insurance doctrine and based on the formula of defined contribution (DC). The system is sensitive to the current demographic changes taking place in the country. Depopulation and aging society threaten further exacerbation of the system’s inefficiencies. The deteriorating old-age dependency ratio throttles the system’s ability to finance current pensions from current pension contributions. Subsidies from the state budget are necessary to guarantee system stability.
The 1999 reform of the Polish pension system which changed the formula for calculating retirement benefits, from the formula of a defined benefit (DB) to the formula of a defined contribution, has failed to produce the expected effects. Due to the demographic situation, the deficit of the pension fund has not decreased, which suggests
0,0 10,0 20,0 30,0 40,0 50,0 60,0 70,0
below the minimum wage between minimum and average wage above average wage Total (%) Men (%) Women (%)
Figure 4.
Paid employment by gross wage amount (2016, by gender)
that it is a permanent (chronic) condition. The next system reform introduced in 2013 increased the universal retirement age (to 67 years for both genders), thus giving hope that the deficit of the pension fund could indeed be reduced. However, the subsequent return of the universal retirement age in October 2017 to the previous levels of 60 and 65 years for women and men, respectively, yielded a further increase in the number of retirees, which translates into deepening the negative balance of the pension fund in the subsequent years.
The lower retirement age will not improve the adequacy of retirement benefits. The formula for calculating the amount of the pension, which makes it dependent on the sum of the registered contributions and the age of retirement (indirectly, through the indicator of further life expectancy), means that pensions of people finishing their professional careers faster will be lower. The simplified simulation whose results are presented in Table 7, allows to conclude that the adequacy of pensions will be determined to a greater extent by the length of service and the amount of current earnings over the entire period of professional activity. The actual age when professional activity is ceased will be less important.
The simulation indicates that the amount of pensions for low-wage earners may be below the poverty threshold, even with the guaranteed minimum pension mechanism. Protection against poverty is only ensured by a higher salary and a sufficiently long seniority, which can be extended by postponing the decision to retire.
When analyzing the consequences of the 1999 pension reform and the further changes of the pension system in the context of demographic change, it must be concluded that they have not produced satisfactory results. The deficit of pension finance has not diminished while many simulations indicate that the replacement rate for future pensions will be low, in most cases at or even below the poverty threshold. At least two underlying reasons for this state of affairs can be readily identified. Firstly, the adopted formula of defined contribution and secondly the overall relatively low wages in Poland. Thus, the key to improving the situation of Polish pensioners is found not so much in further extension of the retirement age, but rather in the improvement of the future retirees’ income (wages). Only a higher level of national income and a fair distribution thereof may improve the situation of future pensioners in Poland. The current pension system pays less attention to intra-generation redistribution, becoming instead a mechanism of sharing consumption in the employee’s life cycle.
References
Ancyparowicz, G. (2014), „Przyczyny narastania deficytu Funduszu Ubezpieczeń Społecznych”, Zeszyty Naukowe Uniwersytetu Szczecińskiego, no. 62, pp. 1–12.
Bednarczyk, T. (2015), „Wyzwania demograficzne dla systemów emerytalnych w Unii Europejskiej”, Annales UMCS, vol. XLIX, pp. 33–50.
Blake, D. (2006), Pension Economics, John Wiley & Sons, West Sussex.
European Commission (2017). Adequacy and Sustainability of Pensions, available at: https://ec.europa. eu/info/sites/info/files/european-semester_thematic-factsheet_adequacy-sustainability-pensions_ en.pdf (accessed: 5 April 2018).
Eurostat (2018a), Healthy Life Years and Life Expectancy at Age 65 by Sex, available at: http:// ec.europa.eu/eurostat/tgm/table.do?tab=table&plugin=1&language=en&pcode=tepsr_sp320 (accessed: 24 March 2018).
Demographic
Aging of Polish
Society and Its
Effects from the
Point of View of
Pension Finance
IJSR
7
Eurostat (2018b), Glossary: At-risk-of-poverty rate, available at: http://ec.europa.eu/eurostat/ statistics-explained/index.php/Glossary:At-risk-of-poverty_rate (accessed: 24 March 2018). GUS (2016), Różnice w wynagrodzeniach kobiet i mężczyzn w Polsce, available at: https:// stat.gov.pl/files/gfx/portalinformacyjny/pl/defaultaktualnosci/5474/12/1/1/roznice_w_ wynagrodzeniach_i_kobiet_i_mezczyzn_w_2014.pdf (accessed: 21 March 2018).
GUS (2017a), Incomes and living conditions of the population of Poland, GUS, Warszawa. GUS (2017b), Rocznik Statystyczny Pracy 2017, GUS, Warszawa.
GUS (2018a), Bazademografia, available at: http://demografia.stat.gov.pl/bazademografia/ CustomSelect.aspx (accessed: 21 March 2018).
GUS (2018b), Tablica trwania życia, available at: http://demografia.stat.gov.pl/bazademografia/ Downloader.aspx?file=lifetables1990-2016.zip&sys=trwanie (accessed: 12 March 2018). Hady, J., Hospod, E., and Rodzinka, J. (2007), „Przyczyny wprowadzenia reformy systemu
emerytalnego w Polsce”, E-Finanse, no. 3, pp. 1–7.
ILO (1952), Convention concerning Minimum Standards of Social Security, available at: http:// www.ilo.org/dyn/normlex/en/f?p=NORMLEXPUB:12100:0::NO::P12100_ILO_CODE:C102 (accessed: 6 September 2017).
Jędrasik-Jankowska, I. (2017), Pojęcia i konstrukcje prawne ubezpieczenia społecznego, Wolters Kluwer, Warszawa.
Ministry of Finance. (2017), Sprawozdanie z wykonania budżetu państwa, available at: https:// www.mf.gov.pl (accessed: 6 September 2018).
MRPiPS (n.d.), System emerytalny, available at: https://www.mpips.gov.pl/ubezpieczenia-spoleczne/ ubezpieczenie-emerytalne/system-emerytalny (accessed: 25 March 2018).
Nowacka, A., and Scibło, A. (2017), „Uwarunkowania systemu emerytalnego w Polsce”, Zeszyty Naukowe PWSZ w Płocku Nauki Ekonomiczne, no. 25, pp. 189–201.
Owczarek, J. (2009), „Redystrybucyjność bazowego systemu emerytalnego w Polsce”, Rozprawy Ubezpieczeniowe, no. 2, pp. 1–21.
Population Pyramids of the World (2018), Population pyramids of the world from 1950 to 2100, available at: https://www.populationpyramid.net (accessed: 12 March 2018).
Ratajczyk-Tuchołka, J. (2012), „Wydłużanie i podwyższanie wieku emerytalnego kobiet i mężczyzn”, in: T. Nawrocka-Szczerbik (ed.), Wiek emerytalny, PSUS, Kazimierz Dolny, pp. 61–75. Rosner, A., and Stanny, M. (2008), „Demograficzne aspekty zasobów pracy w Polsce do 2030 r.”,
Polityka Społeczna, no. 1, pp. 1–5.
Standerski, D., and Konopczyński, F. (2017), Jak uniknąć katastrofy? Perspektywy polskiego systemu emerytalnego, Fundacja Kaleckiego, Warszawa.
Szukalski, P. (2006), „Wiek przechodzenia na emeryturę w Polsce”, in: J. Kowaleski, P. Szukalski (eds.), Starość i starzenie się jako doświadczenie jednostek i zbiorowości ludzkich, Zakład Demografii Uniwersytetu Łódzkiego, Łódź, pp. 57–58.
Sztanderska, U. (2008), „Przyczyny wczesnej dezaktywizacji zawodowej i emerytalnej osób ubezpieczonych w ZUS”, in: Dezaktywizacja osób w wieku około emerytalnym, Departament Analiz Ekonomicznych i Prognoz Ministerstwa Pracy i Polityki Społecznej, Warszawa, pp. 18–70. Ustawa o emeryturach i rentach z Funduszu Ubezpieczeń Społecznych, Polish Journal of Laws
No. 162 item 1118 (1998).
Waligórska, M. (2011), „Prognoza ludności Głównego Urzędu Statystycznego na lata 2008–2035”, in: System emerytalny – problemy na przyszłość, ZUS, Warszawa, pp. 20–30.
Wiktorowicz, J. (2014), „Wydłużenie aktywności zawodowej czy przejście na emeryturę? Studium mikroekonomiczne”, Studia Demograficzne, no. 166, pp. 7–36.
ZUS (2016), Zielona księga, ZUS, Warszawa.
ZUS (2018a), Informacja o wybranych świadczeniach pieniężnych. Grudzień 2017 r., available at: http://www.zus.pl/documents/10182/167606/wst%C4%99pna+_12_2017.pdf/9d71f497-8af8-4517-a2c2-4c02b90afb6f (accessed: 12 March 2018).
ZUS (2018b), Informacja o wybranych świadczeniach pieniężnych. Luty 2017r., available at: http://www.zus.pl/documents/10182/167606/wst%C4%99pna+_02_2018/178d7b96-09ec-460e-9bff-9b95d2cabadc (accessed: 12 March 2018).
Żukowski, M. (2014), „Ekonomiczne aspekty ubezpieczeń społecznych”, in: B. Kaczyńska (ed.), Ubezpieczenia społeczne w procesie zmian, ZUS, Warszawa, pp. 43–52.