The Association of Level of
Care With NICU Quality
Jochen Profi t, MD, MPH,a,b Jeffrey B. Gould,a,b Mihoko Bennett, PhD,a,b Benjamin A. Goldstein,
PhD,c David Draper, PhD,d,e Ciaran S. Phibbs, PhD,a,f Henry C. Lee, MD, MSa,b
abstract
BACKGROUND: Regionalized care delivery purportedly optimizes care to vulnerable very low birth weight (VLBW; <1500 g) infants. However, a comprehensive assessment of quality of care delivery across different levels of NICUs has not been done.
METHODS: We conducted a cross-sectional analysis of 21 051 VLBW infants in 134 California NICUs. NICUs designated their level of care according to 2012 American Academy of Pediatrics guidelines. We assessed quality of care delivery via the Baby-MONITOR, a composite indicator, which combines 9 risk-adjusted measures of quality. Baby-MONITOR scores are measured as observed minus expected performance, expressed in standard units with a mean of 0 and an SD of 1.
RESULTS: Wide variation in Baby-MONITOR scores exists across California (mean [SD] 0.18 (1.14), range –2.26 to 3.39). However, level of care was not associated with overall quality scores. Subcomponent analysis revealed trends for higher performance of Level IV NICUs on several process measures, including antenatal steroids and any human milk feeding at discharge, but lower scores for several outcomes including any health care associated infection, pneumothorax, and growth velocity. No other health system or organizational factors including hospital ownership, neonatologist coverage, urban or rural location, and hospital teaching status, were significantly associated with Baby-MONITOR scores.
CONCLUSIONS: The comprehensive assessment of the effect of level of care on quality reveals differential opportunities for improvement and allows monitoring of efforts to ensure that fragile VLBW infants receive care in appropriate facilities.
aPerinatal Epidemiology and Health Outcomes Research Unit, Division of Neonatology, Department of Pediatrics,
Stanford University School of Medicine and Lucile Packard Children’s Hospital, Palo Alto, California; bCalifornia
Perinatal Quality Care Collaborative, Palo Alto, California; cDepartment of Biostatistics & Bioinformatics, Duke
University, Durham, North Carolina; dDepartment of Applied Mathematics and Statistics, Baskin School of
Engineering, University of California, Santa Cruz, California; eeBay Research Laboratories, San Jose, California;
and fVeteran’s Affairs Palo Alto Health Care System, Palo Alto, California
Dr Profi t had full access to all of the data in the study and takes responsibility for the integrity of the data and the accuracy of the data analysis; he acquired funding for the study, conceptualized and designed the study, selected data for inclusion in analyses, analyzed the data, interpreted the results, and drafted the initial manuscript; Drs Gould, Goldstein, and Phibbs helped design the analysis and interpret the results and revised the manuscript; Dr Bennett executed the analysis, helped to interpret the results, and revised the manuscript; Dr Draper helped design the analysis and interpret the results, analyzed the data, and revised the manuscript; Dr Lee helped design the study, assisted with interpretation of the results, and revised the manuscript; and all authors approved the fi nal manuscript as submitted.
DOI: 10.1542/peds.2014-4210 Accepted for publication Dec 1, 2015
Address correspondence to Jochen Profi t, MD, MPH, Perinatal Epidemiology and Health Outcomes Research Unit, Division of Neonatology, Department of Pediatrics, Stanford University School of Medicine, MSOB Room x115, 1265 Welch Rd, Stanford, CA 94305. E-mail: profi [email protected]
NIH
To cite: Profi t J, Gould JB, Bennett M, et al. The Association of Level of Care With NICU Quality. Pediatrics.
2016;137(3):e20144210
WHAT’S KNOWN ON THIS SUBJECT: Regionalized NICU care delivery and birth at perinatal centers minimizes mortality in very low birth weight infants. There is a lack of a more comprehensive assessment of quality and outcomes of care across different levels of care.
Delivery of neonatal intensive care in regionalized systems has long been regarded as critical to providing high-quality health care to vulnerable very low birth weight (VLBW; <1500 g) infants. However, over the past decades the regionalized care systems for sick newborns may have been weakened by financial rewards under fee-for-service arrangements and demand from community hospitals and families seeking to deliver close to home.1
Lower mortality of VLBW infants has been observed after birth in a perinatal center.2 Phibbs and
colleagues showed higher mortality in lower-level and lower-volume NICUs.3,4 A meta-analysis indicated
62% higher odds of mortality during the birth hospitalization with birth outside a high-level NICU.5
NICU volume may be an even more important predictor of mortality.6,7
These studies imply that quality of care delivery for vulnerable VLBW infants at lower-level NICUs may be suboptimal. However, mortality as a sole measure of quality is limited. In isolation, it provides little information about the care provided to the 85% of infants8 who survive
to discharge.9 Yet a comprehensive
assessment of care and outcomes across different levels of NICUs does not exist.
Neonatal intensive care is a complex and multidimensional activity, and the measurement of its quality should reflect this fact. Although individual measures contain important information, there is also value in summarizing performance by combining the information from multiple measures because such a summary can convey quality from many different perspectives.10
In previous work, we created a composite indicator, the Baby-MONITOR, as a comprehensive measure of the care and outcomes for VLBW infants.11,12 In this article,
we used the Baby-MONITOR and its individual components to examine
whether care and outcomes differ between different NICU levels.
METHODS
Overview
We conducted a cross-sectional population-based analysis of clinical data obtained from the California Perinatal Quality Care Collaborative (CPQCC).13 More than 90% of
California NICUs are members of the CPQCC. Data for this study are derived from the CPQCC clinical data sets, which include several quality assurance mechanisms. Annual training sessions for local NICU personnel help to promote accuracy and uniformity in data abstraction. In addition, each record has range and logic checks, both at the time of data collection and data closeout, with auditing of records with excessive missing data.
The sample included live-born infants with a birth weight of 401 to 1500 g or a gestational age between 25 0/7 and 31 6/7 weeks. We used multiyear analyses (January 1, 2008, to December 31, 2012) because of the small number of VLBW infants cared for in some institutions.
We used previously published selection criteria aimed at creating a relatively homogenous sample of VLBW infants.11 To ensure that
patient outcomes reflected NICU quality of care, we excluded infants who died before 12 hours of life and those with severe congenital anomalies (see Supplemental Information). We also excluded infants born before 25 weeks of gestation to minimize bias at the threshold of viability.14
Data for individual infants are linked such that they can be followed if transferred between CPQCC NICUs. Because patient transfers may bias NICU performance assessments, we developed detailed algorithms to avoid unduly crediting or penalizing NICUs for care delivered elsewhere.
Guiding principles for these algorithms were as follows:
1. Only infants with at most 3 admission records from 2 hospitals are included.
2. If the birth hospital transferred an infant by 3 days of age (day 1 being the day of birth), subsequent relevant outcomes (eg, chronic lung disease) accrue to the receiving hospital (counted as missing for the birth hospital).
3. If the birth hospital transferred an infant after 3 days of age, subsequent relevant outcomes accrue to the birth hospital (counted as missing for the receiving hospital).
Measures
See also Supplemental Table 3.
Outcome Variable
Baby-MONITOR: measures for the composite scale were selected by an expert panel15 and affirmed by
practicing neonatologists.16 Measure
definitions used standard CPQCC algorithms. The measures were expressed as binary variables at the patient level and as proportions at the unit level. They include (1) any antenatal steroid administration; (2) moderate hypothermia (<36°C) on admission; (3) non–surgically induced pneumothorax; (4)
hospital-acquired bacterial or fungal infection; (5) oxygen requirement at 36 weeks’ gestational age; (6) retinopathy of prematurity screening at the age recommended by the American Academy of Pediatrics (AAP); (7) discharge on any human milk; (8) mortality during the birth hospitalization; and (9) growth velocity (less or more than the median of 12.9 g/kg/day) calculated by using a logarithmic function.17
Variable of Interest: Level of Care
Designations follow the 2012 definitions set forth by the AAP.18
This study included Level (L) II through IV NICUs.
Missing AAP levels and discrepancies were checked and confirmed with the NICUs. Four centers only provided the older AAP levels (eg, IIA, IIB), in which case we determined the new AAP level based on the ventilation duration, the number of cardiac surgeries, and care levels as designated by the California Children’s Services.19
Additional Covariates
Organizational variables: hospital ownership (government, not-for-profit, not-for-profit, other) and neonatologist coverage (in-house or at home) were obtained from the 2012 Vermont Oxford Network Annual Survey of NICU directors. Hospital volume was obtained from the eligible infants from the study cohort in the CPQCC data. Hospital teaching status was derived from the Regional Perinatal Programs of California.20
Clinical variables: these data were obtained from the CPQCC data set and included prenatal care, gender, weight for gestational age below the 10th percentile, outborn, multiple birth, 5-minute Apgar score, and Cesarean delivery. Gestational age at birth was categorized into 25 weeks to 27 weeks 6 days, 28 weeks to 29 weeks 6 days, and ≥30 weeks gestation groups, based on similar patient numbers among groups. Apgar score was categorized as ≤3, between 4 and 6, and >6. Prenatal care was defined as receipt of any prenatal obstetrical care before the admission during which birth occurred.
Analyses
Baby-MONITOR Scores
Computation of Baby-MONITOR scores requires that its
subcomponents are aligned according to valence (higher score = better performance), risk
adjusted, and standardized using the Draper-Gittoes method.12,21
With this method, a standardized observed minus expected z score was computed, with an expected mean of 0 and a SD of 1. Each z score was equally weighted and averaged to derive a Baby-MONITOR score for each NICU. We used bootstrapping (a simulation in which each NICU’s patients were resampled with replacement 500 times22) to compute
95% confidence intervals.
Association of Baby-MONITOR Scores With Level of NICU Care
We grouped NICUs according to their level of care and calculated Baby-MONITOR scores for each level weighted by number of infants. We used the F and t tests to assess differences in composite scores between NICU levels. To examine the effect of patient volume on quality of care delivery, we stratified the analyses according to VLBW volume using the cutoffs for high- and low-volume based on median annual volumes, achieving balance of NICUs within high- and low-volume groups (ie, L II: 1–6 = low, >6 = high; L III: 1–29 = low, >29 = high; L IV: 1–61 = low, >61 = high). These cut points are broadly consistent with those used in the literature, which had an empirical basis.5,8
Controlling for the Effects of Organizational Variables
We performed a multivariate analysis regressing Baby-MONITOR score onto NICU level, controlling for other covariates. To choose the covariates for the final model, we used
backward selection with a P value criterion of <.15.
Differences in Baby-MONITOR Subcomponents by Level of Care
We used analysis of variance to test for differences in performance on risk adjusted Baby-MONITOR subcomponent scores across levels of care. We used Bonferroni adjustment to correct for multiple testing.
Human Subjects Compliance
This study was approved by the Stanford Internal Review Board.
RESULTS
Sample Characteristics
The sample included 21 051 VLBW infants with 22 984 hospital records (transfers included) in 134 NICUs born between January 1, 2008, and December 31, 2012 who met the inclusion criteria. Of these NICUs, 25 are designated as L II, 89 as L III, and 20 as L IV.18 Approximately 4%
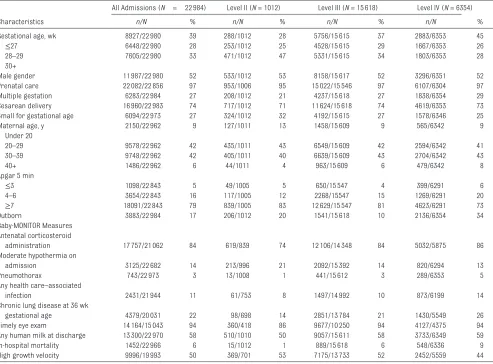
of infants were born at L 1 hospitals, other outpatient setting, out of state, or military hospitals. Excluded from the analysis were 1194 infants (∼5%) who were transferred to ≥3 institutions. Of these, nearly 70% received cared at L IV NICUs. Table 1 shows the unadjusted population and NICU characteristics for the combined sample. Approximately 5% of infants were born at an L II NICU (1012 of 21 051). L IV NICUs cared for a higher proportion of high-risk infants. On average, infants in L IV NICUs were of lower gestational age and their mothers were more likely to be of advanced maternal age and carrying multiples. In unadjusted analyses, L II NICUs exhibited significant opportunities for process improvement. They had lower rates of antenatal steroid administration, eye examinations, and any human milk feeding at discharge, and higher rates of hypothermia on admission. On the other hand, they exhibited lower rates among several outcome measures including rates of pneumothoraces, health care associated infections, chronic lung disease, and mortality (P < .05 for all comparisons).
Baby-MONITOR Scores Across NICUs
ordered with regard to ascending composite score for the clinical measures. We show both a figure based on the standard units (Fig 1A) and a conversion to percentiles (Fig 1B). The variation in performance between these NICUs was highly significant in practical terms (indicated by the 5.65 standard units of difference between the top and bottom providers). These results were robust with regard to changing the transfer cutoff days from a baseline of day 3 to scenarios including transfer on days 2 and 4 of age, as well as assigning outcomes for all transfers to the birth hospital. Finally, we included all deaths before 12 hours of age in the analysis. The correlation in Baby-MONITOR scores between these scenarios was high, ranging from 0.94 to 0.99, consistent
with our previous work23 (see online
Supplemental Table 4).
Level of Care and Baby-MONITOR Scores
On average, L III NICUs achieved the highest Baby-MONITOR scores (L III mean [SD (range)] 0.43 [1.35 (–2.26 to 2.64)], L IV 0.37 [1.39 (–1.61 to 3.39)], L II –0.22 [0.89 (–1.82 to 1.23]), but these differences were not statistically significant (P = .53). Stratification (Fig 2) revealed a VLBW volume effect that widened with increasing level of care (L II low 0.15 [0.5] versus high –0.3 [0.93]; L III low 0.15 [1.02] versus high 0.52 [1.43]; L IV low –0.08 [1.08] versus high 0.52 [1.45]). Neither these differences nor any of the associations of Baby-MONITOR scores with organizational variables,
including hospital ownership, neonatologist coverage, and hospital teaching status, reached statistical significance (see Supplemental Information, Sensitivity Analysis).
Level of Care and Baby-MONITOR Subcomponents
Figure 3 shows significant differences across levels of care for several subcomponents with L IV NICUs scoring higher on several process measures of care, including antenatal steroids (P = .002) and any human milk at discharge (P = .092), but lower on other outcomes such as health care–associated infections (P = .040), pneumothorax (P < .001), and growth velocity (P = .006).
Table 2 also shows pairwise comparisons using L IV NICUs as TABLE 1 Sample Characteristics
Characteristics
All Admissions (N = 22 984) Level II (N = 1012) Level III (N = 15 618) Level IV (N = 6354)
n/N % n/N % n/N % n/N %
Gestational age, wk 8927/22 980 39 288/1012 28 5756/15 615 37 2883/6353 45
≤27 6448/22 980 28 253/1012 25 4528/15 615 29 1667/6353 26
28–29 7605/22 980 33 471/1012 47 5331/15 615 34 1803/6353 28
30+
Male gender 11 987/22 980 52 533/1012 53 8158/15 617 52 3296/6351 52
Prenatal care 22 082/22 856 97 953/1006 95 15 022/15 546 97 6107/6304 97
Multiple gestation 6283/22 984 27 208/1012 21 4237/15 618 27 1838/6354 29
Cesarean delivery 16 960/22 983 74 717/1012 71 11 624/15 618 74 4619/6353 73
Small for gestational age 6094/22 973 27 324/1012 32 4192/15 615 27 1578/6346 25
Maternal age, y 2150/22 962 9 127/1011 13 1458/15 609 9 565/6342 9
Under 20
20–29 9578/22 962 42 435/1011 43 6549/15 609 42 2594/6342 41
30–39 9748/22 962 42 405/1011 40 6639/15 609 43 2704/6342 43
40+ 1486/22 962 6 44/1011 4 963/15 609 6 479/6342 8
Apgar 5 min
≤3 1098/22 843 5 49/1005 5 650/15 547 4 399/6291 6
4–6 3654/22 843 16 117/1005 12 2268/15547 15 1269/6291 20
≥7 18091/22 843 79 839/1005 83 12 629/15 547 81 4623/6291 73
Outborn 3883/22 984 17 206/1012 20 1541/15 618 10 2136/6354 34
Baby-MONITOR Measures Antenatal corticosteroid
administration 17 757/21 062 84 619/839 74 12 106/14 348 84 5032/5875 86
Moderate hypothermia on
admission 3125/22 682 14 213/996 21 2092/15 392 14 820/6294 13
Pneumothorax 743/22 973 3 13/1008 1 441/15 612 3 289/6353 5
Any health care–associated
infection 2431/21 944 11 61/753 8 1497/14 992 10 873/6199 14
Chronic lung disease at 36 wk
gestational age 4379/20 031 22 98/698 14 2851/13 784 21 1430/5549 26
Timely eye exam 14 164/15 043 94 360/418 86 9677/10 250 94 4127/4375 94
Any human milk at discharge 13 300/22 970 58 510/1010 50 9057/15 611 58 3733/6349 59
In-hospital mortality 1452/22 966 6 15/1012 1 889/15 618 6 548/6336 9
a reference. Compared with L III NICUs, they had higher rates of antenatal steroids (P = .040), any human milk at discharge (P = .030), and survival (P = .045), but also of health care–associated infections (P = .014) and poor growth (P = .002). After Bonferroni adjustment, survival and human milk at discharge were no longer significant.
Compared with L II NICUs, we found higher rates of antenatal steroids (P = .036), pneumothorax (P = .012) and a trend toward higher retinopathy of prematurity examinations (P = .099). After Bonferroni adjustment, only pneumothorax remained significant.
DISCUSSION
Using population-based data, we present a multidimensional, nuanced assessment of the relation between quality of NICU care provided to VLBW infants and NICU level of care. We found significant variation in Baby-MONITOR scores across NICUs but no statistically significant association with level of care. Subcomponent analysis revealed interesting differences, with L IV NICUs performing better on process measures, as well as marginally on survival, and L II NICUs better on other outcome measures.
We consider 4 potential causes to explain our findings. First, previous literature and general advances in high-risk maternal care, including greater use of antenatal corticosteroids24 and imaging, may
have fostered more appropriate utilization and regionalization patterns. Compared with previous studies,3,4 we found an inconsistent
association between level of care and survival. The proportion of infants born in L II NICUs is low (5%), and case mix is favorable to survival. Thus, selection bias may have impeded our ability to demonstrate significant differences in survival of infants in L II compared with L IV NICUs. Consistent with previous
FIGURE 1
Baby-MONITOR scores for 132 California NICUs. The different colors and symbols designate different levels of NICUs, and the stars designate low VLBW infant volume L IV NICUs. A, Mean (95% confi dence interval) expressed in observed minus expected z scores, measured in standard units. B, Information expressed as percentiles of the distribution of ranking of the NICUs against each other. This illustration highlights the relative uncertainty in NICU rankings. For instance, the lowest-ranking NICU has all of its vertical line close to the 0th percentile, meaning that we are confi dent that its Baby-MONITOR scores are much lower than those of NICUs whose performance is near the 50th percentile. The uncertainty regarding NICU performance is much greater in the middle. Only NICUs with a minimum of 10 infants are shown.
FIGURE 2
research, we found a borderline survival benefit of L IV compared with L III NICUs. However, this difference was not significant after adjustment for multiple comparisons. Given differing biases of providers or parents for life-sustaining treatments, survival may not accurately reflect actual quality of care delivery. We think our results should be viewed as supporting continued national efforts to limit VLBW births in L II NICUs and for regionalized care delivery.25
Second, the current approach to defining level of care, as well as self-designation of this variable, may lead to misclassification and dilute the association with measures of quality.
FIGURE 3
Baby-MONITOR subcomponents by NICU AAP level of care. Statistical signifi cance is derived by analysis of variance.
TABLE 2 Baby-MONITOR Subcomponents by AAP Level
Outcome Measure Level N Mean SD Range P Type III P
Antenatal steroid 2 7 −1.12 1.54 –2.49 to 1.54 .036 .002
3 86 0.32 2.91 –10.9 to 5.76 .0008a
4 15 2.7 3.4 –2.39 to 7.46 Ref
Overall 108 0.85 3.19 –10.9 to 7.46
No hypothermia on admission 2 7 −2.86 3.23 –7.34 to 2.61 .124 .286
3 87 1.2 4.66 –13.02 to 9.49 .466
4 20 2.03 6.76 –8.2 to 11.02 Ref
Overall 114 1.32 5.37 –13.02 to 11.02
Any human milk at discharge 2 7 −0.46 2.42 –4.2 to 4.41 .430 .092
3 87 −0.44 4.06 –12.8 to 6.78 .030
4 20 1.6 5.26 –7.75 to 10.98 Ref
Overall 114 0.13 4.49 –12.79 to 10.98
Timely eye examination 2 7 −1.71 1.88 –4.63 to 1.14 .099 .248
3 87 0.71 2.44 –8.21 to 5.32 .853
4 20 0.81 2.88 –3.39 to 5.12 Ref
Overall 114 0.67 2.59 –8.21 to 5.32
Survival 2 7 1.1 1.38 –1.19 to 2.75 .659 .083
3 87 −0.11 1.78 –3.61 to 4.33 .045
4 20 0.64 1.73 –1.64 to 4.12 Ref
Overall 114 0.13 1.8 –3.61 to 4.33
No chronic lung disease 2 7 −0.84 1.81 –3.51 to 2.17 .583 .792
3 87 0.35 3.08 –5.96 to 8.11 .800
4 20 0.18 3.32 –6.86 to 4.76 Ref
Overall 114 0.27 3.13 –6.86 to 8.11
No health care–associated infection 2 7 −0.67 2.79 –5.67 to 2.22 .967 .040
3 87 0.65 2.58 –6.42 to 6.81 .014a
4 20 −0.73 2.65 –5.86 to 4.13 Ref
Overall 114 0.22 2.68 –6.42 to 6.81
No pneumothorax 2 7 1.16 0.68 –0.39 to 2.19 .012 <.0001a
3 87 0.48 1.56 –3.15 to 3.74 <.001a
4 20 −1.14 1.51 –3.15 to 2.8 Ref
Overall 114 0.05 1.7 –3.15 to 3.74
High growth velocity 2 7 0.93 2.67 –2.3 to 4.47 .215 .006
3 87 0.71 4.23 –10.92 to 10.28 .002a
4 20 −2.12 4.0 –9.1 to 6.28 Ref
Overall 114 −0.08 4.32 –10.92 to 10.28
However, using California-specific NICU designations assigned by the state also did not result in significant associations with Baby-MONITOR scores (see Supplemental Information).
Third, L II NICUs did achieve lower scores on many process measures, indicating opportunity for quality improvement, yet they also achieved higher scores for many outcome measures. These findings might be the result of selection bias not adequately mitigated by risk adjustment. For example, growth velocity is difficult to predict using patient characteristics from the immediate peripartum time period. Future ability to extract additional data from the electronic record may help refine risk models. In addition, pseudo-randomization methods, such as an instrumental variable approach, may address some of the unobserved selection bias. This requires additional study, but previous applications of these methods to NICU outcomes have demonstrated that the benefits of care at higher-volume and/or higher-level NICUs are larger than with traditional risk-adjustment methods such as those that we used.26
Fourth, transfer bias may have depressed scores for higher-level NICUs. Outcomes for L II NICUs are measured not according to birth at such a facility but according to intent to keep such infants at a L II for treatment. However, we were careful to mitigate transfer bias by including inborn status in risk adjustment models and by assigning negative outcomes of care for infants transferred after day of age 3 to the sending NICU (outcome is missing for receiving NICU, yet positive outcome is assigned to both NICUs). We did assign negative outcomes of infants transferred before or on day of age 3 to the receiving NICU. In addition, assigning all outcomes of transferred infants back to the birth hospital also did not have significant influence on our results. Finally, there is a known inverse relation between the volume
of high-risk deliveries and in-hospital fetal death rates that may be
associated with the ability to perform rapid cesarean deliveries.3 This can
cause a bias because fetal deaths are not included in our data and many of the cases in which the fetal death is “averted” in the high-volume hospitals will have elevated risks not captured by our data.
This study provides a good example for the usefulness of composite indicators. The composite provides a global picture of differences in quality of care and of the association with important predictors of quality. Conversely, drawing inferences on overall care based on a single measure, such as mortality, is hazardous because individual measures contain biases, making them nonrepresentative. In addition, we have previously shown that NICUs that perform well in 1 area of care may not perform well in others.
Equally important is the process of drilling down into individual subcomponents of the composite because averaging across the measures may hide important differences. This study exemplifies this by revealing important and modifiable differences between NICUs.27,28
This study must be viewed within the context of its design. Observational studies allow for the establishment of associations and the generation of hypotheses but not causal inference. In addition, as mentioned above, incomplete risk adjustment and transfer bias and confounding from unobserved variables (eg, patient-to-nurse ratios) might have affected our findings. Nevertheless, these methods have been previously published, and inclusion of institutional confounding variables may not be appropriate for quality of care comparisons. This study included nearly all of the NICUs in California, the country’s most populous state with diverse geography. Given our objective to study the effect of care organization on quality, our findings may have
broad relevance to other regions in the United States and abroad. Finally, we used only a 1-time designation of NICUs in 2012 of their level of care and applied this designation to the entire study period. Because the AAP designation changed in 2012, we do not have earlier designations based on this classification scheme. However, examining changes in classification over previous years, we found them to be highly stable. Because changes in level of care usually occur toward a higher level, this limitation would bias our results toward the null.
CONCLUSIONS
In this population-based study, we found wide variation in overall quality of care provided to VLBW infants by using the Baby-MONITOR, but no significant associations with NICU level of care. We did, however, find important associations with its subcomponents, with L IV NICUs receiving higher-quality scores for measures of care process, and L II NICUs receiving higher scores for several care outcomes. These findings highlight opportunities for further improvements that can be addressed through targeted interventions.
ACKNOWLEDGMENTS
We thank the CPQCC member NICUs for contributing data to this study. We also thank Aloka Patel and Rush University Medical Center for granting Dr Profit a nonexclusive license to use Rush’s exponential infant growth model for noncommercial research purposes.
ABBREVIATIONS
AAP: American Academy of Pediatrics
REFERENCES
1. Gould JB, Marks AR, Chavez G. Expansion of community-based perinatal care in California. J Perinatol. 2002;22(8):630–640
2. Saigal S, Doyle LW. An overview of mortality and sequelae of preterm birth from infancy to adulthood.
Lancet. 2008;371(9608):261–269
3. Phibbs CS, Baker LC, Caughey AB, Danielsen B, Schmitt SK, Phibbs RH. Level and volume of neonatal intensive care and mortality in very-low-birth-weight infants. N Engl J Med. 2007;356(21):2165–2175
4. Phibbs CS, Bronstein JM, Buxton E, Phibbs RH. The effects of patient volume and level of care at the hospital of birth on neonatal mortality. JAMA. 1996;276(13):1054–1059
5. Lasswell SM, Barfi eld WD, Rochat RW, Blackmon L. Perinatal regionalization for very low-birth-weight and very preterm infants: a meta-analysis.
JAMA. 2010;304(9):992–1000
6. Chung JH, Phibbs CS, Boscardin WJ, Kominski GF, Ortega AN, Needleman J. The effect of neonatal intensive care level and hospital volume on mortality of very low birth weight infants. Med Care. 2010;48(7):635–644
7. Cifuentes J, Bronstein J, Phibbs CS, Phibbs RH, Schmitt SK, Carlo WA. Mortality in low birth weight infants according to level of neonatal care at hospital of birth. Pediatrics. 2002;109(5):745–751
8. Eichenwald EC, Stark AR. Management and outcomes of very low birth weight.
N Engl J Med. 2008;358(16): 1700–1711
9. Profi t J, Zupancic JA, Gould JB, et al. Correlation of neonatal intensive care
unit performance across multiple measures of quality of care. JAMA Pediatr. 2013;167(1):47–54
10. Composite Measure Evaluation Framework and National Voluntary Consensus Standards for Mortality and Safety–Composite Measures: A Consensus Report. Washington, DC: National Quality Forum; 2009
11. Profi t J, Gould JB, Zupancic JA, et al. Formal selection of measures for a composite index of NICU quality of care: Baby-MONITOR. J Perinatol. 2011;31(11):702–710
12. Profi t J, Kowalkowski MA, Zupancic JA, et al. Baby-MONITOR: a composite indicator of NICU quality. Pediatrics. 2014;134(1):74–82
13. Gould JB. The role of regional collaboratives: the California Perinatal Quality Care Collaborative model. Clin Perinatol. 2010;37(1):71–86
14. Peerzada JM, Richardson DK, Burns JP. Delivery room decision-making at the threshold of viability. J Pediatr. 2004;145(4):492–498
15. Profi t J, Typpo KV, Hysong SJ, Woodard LD, Kallen MA, Petersen LA. Improving benchmarking by using an explicit framework for the development of composite indicators: an example using pediatric quality of care.
Implement Sci. 2010;5:13
16. Kowalkowski M, Gould JB, Bose C, Petersen LA, Profi t J. Do practicing clinicians agree with expert ratings of neonatal intensive care unit quality measures? J Perinatol. 2012;32(4):247–252
17. Patel AL, Engstrom JL, Meier PP, Kimura RE. Accuracy of methods for
calculating postnatal growth velocity for extremely low birth weight infants.
Pediatrics. 2005;116(6):1466–1473
18. American Academy of Pediatrics Committee on Fetus and Newborn. Levels of neonatal care. Pediatrics. 2012;130(3):587–597
19. California Department of Healthcare Services. Special Care Centers 2013. Available at: http:// www. dhcs. ca. gov/ services/ ccs/ scc/ Pages/ default. aspx. Accessed November 20, 2015
20. Regional Perinatal Programs of California: California Department of Public Health; 2014. Available at: http:// www. cdph. ca. gov/ programs/ rppc/ Pages/ default. aspx
21. Draper D, Gittoes M. Statistical analysis of performance indicators in UK higher education. J R Stat Soc [Ser A]. 2004;167(3):449–474
22. Efron BT, Tibshirani RJ. An Introduction to the Bootstrap. New York, NY: Chapman & HallHall/CRC Monographs on Statistics & Applied Probability; 1994
23. Profi t J, Gould JB, Draper D, et al. Variations in defi nitions of mortality have little infl uence on neonatal intensive care unit performance ratings. J Pediatr. 2013;162(1): 50–5.e2
24. Profi t J, Goldstein BA, Tamaresis J, Kan P, Lee HC. Regional variation in antenatal corticosteroid use: a network-level quality improvement study. Pediatrics. 2015;135(2). Available at: www. pediatrics. org/ cgi/ content/ full/ 135/ 2/ e397
25. Freeman VA. Very Low Birth Weight Babies Delivered at Facilities for High-Risk Neonates: A Review of Title
PEDIATRICS (ISSN Numbers: Print, 0031-4005; Online, 1098-4275). Copyright © 2016 by the American Academy of Pediatrics
FINANCIAL DISCLOSURE: The authors have indicated they have no fi nancial relationships relevant to this article to disclose.
FUNDING: Dr Profi t’s contribution was supported, in part, by the Eunice Kennedy Shriver National Institute of Child Health and Human Development (1 R01 HD083368-01) and by the Stanford Child Health Research Institute. Dr Lee’s contribution was supported, in part, by the Eunice Kennedy Shriver National Institute of Child Health and Human Development (K23HD068400). Dr Goldstein’s effort was supported by a career development award from the National Institute of Diabetes and Digestive and Kidney Diseases (K25 DK097279). Funded by the National Institutes of Health (NIH).
V National Performance Measure 17. Washington, DC: Maternal and Child Health Bureau, Health Resources and Services Administration; 2010. Available at: http:// mchb. hrsa. gov/ grants/ natlperformmeasur e17rpt. pdf
26. Guo Z, Cheng J, Lorch SA, Small DS. Using an instrumental variable to
test for unmeasured confounding.
Stat Med. 2014;33(20): 3528–3546
27. Lee HC, Kurtin PS, Wight NE, et al A quality improvement project to increase breast milk use in very low birth weight infants. Pediatrics. 2012;130(6). Available at: www.
pediatrics. org/ cgi/ content/ full/ 130/ 6/ e1679
28. Lee HC, Lyndon A, Blumenfeld YJ, Dudley RA, Gould JB. Antenatal steroid administration for premature neonates in California.
DOI: 10.1542/peds.2014-4210 originally published online February 9, 2016;
2016;137;
Pediatrics
Draper, Ciaran S. Phibbs and Henry C. Lee
Jochen Profit, Jeffrey B. Gould, Mihoko Bennett, Benjamin A. Goldstein, David
The Association of Level of Care With NICU Quality
Services
Updated Information &
http://pediatrics.aappublications.org/content/137/3/e20144210 including high resolution figures, can be found at:
References
http://pediatrics.aappublications.org/content/137/3/e20144210#BIBL This article cites 22 articles, 5 of which you can access for free at:
Subspecialty Collections
http://www.aappublications.org/cgi/collection/neonatology_sub Neonatology
sub
http://www.aappublications.org/cgi/collection/fetus:newborn_infant_ Fetus/Newborn Infant
sub
http://www.aappublications.org/cgi/collection/quality_improvement_ Quality Improvement
_management_sub
http://www.aappublications.org/cgi/collection/administration:practice Administration/Practice Management
following collection(s):
This article, along with others on similar topics, appears in the
Permissions & Licensing
http://www.aappublications.org/site/misc/Permissions.xhtml in its entirety can be found online at:
Information about reproducing this article in parts (figures, tables) or
Reprints
DOI: 10.1542/peds.2014-4210 originally published online February 9, 2016;
2016;137;
Pediatrics
Draper, Ciaran S. Phibbs and Henry C. Lee
Jochen Profit, Jeffrey B. Gould, Mihoko Bennett, Benjamin A. Goldstein, David
The Association of Level of Care With NICU Quality
http://pediatrics.aappublications.org/content/137/3/e20144210
located on the World Wide Web at:
The online version of this article, along with updated information and services, is
http://pediatrics.aappublications.org/content/suppl/2016/02/08/peds.2014-4210.DCSupplemental Data Supplement at:
by the American Academy of Pediatrics. All rights reserved. Print ISSN: 1073-0397.