EMG DIAGNOSIS VIA TIME DOMAIN
FEATURES AND BINARY SUPPORT
VECTOR MACHINE CLASSIFICATION
GURMANIK KAUR† Research Scholar, EIE Department, SLIET (Deemed-to-be-University), Longowal
Distt. Sangrur, Punjab, INDIA, 148106 Email-id: [email protected]
DR. AJAT SHATRU ARORA Professor, EIE Department, SLIET (Deemed-to-be-University), Longowal
Distt. Sangrur, Punjab, INDIA, 148106 Email-id: [email protected]
DR. VIJENDER KUMAR JAIN Professor & Head, EIE Department, SLIET (Deemed-to-be-University), Longowal
Distt. Sangrur, Punjab, INDIA, 148106 Email-id: [email protected]
DR. GURTEJ SINGH SIDHU
RMO & EMO
Silver Oaks Hospital, Phase IX, Sector-63, SAS Nagar (Mohali), Punjab, INDIA, 160062
Email-id: [email protected]
Abstract :
There are more than 100 neuromuscular disorders that affect the brain, spinal cord, nerves and muscles. Many of these diseases are hereditary and life expectancy of many sufferers is considerably reduced. Early detection and diagnosis of these diseases by clinical examination and laboratory tests is essential for their management as well as their prevention through prenatal diagnosis and genetic counselling. Such information is also useful in research which may lead to the understanding of the nature and eventual treatment of these diseases. Laboratory investigations include neurophysiological tests, nerve and muscle biopsies, biochemical analysis and more recently deoxyribo nucleic acid (DNA) analysis for the localization and identification of genes. Electromyographic examination studies the electrical activity of the muscle and forms a valuable neurophysiological test for the assessment of neuromuscular disorders.
The shapes and firing rates of the motor unit action potentials (MUAPs) in an electromyogram (EMG) signal provide an important source of information for the diagnosis of neuromuscular disorders. In order to extract this information from the EMG signals recorded at low to moderate force levels, it is required to identify and classify the MUAPs composing the EMG signal. The identification of possible MUAPs is done by segmentation of EMG signal using threshold technique. The identified MUAPs are clustered using a statistical pattern recognition technique. After extraction of time domain features, MUAPs are classified using binary support vector machine (SVM) classifier. A total of 12 EMG signals obtained from 3 normal (NOR), 5 myopathic (MYO) and 4 motor neuron diseased (MND) subjects were analyzed. The classification accuracy of multi-class SVM with time domain features is 75.06 %. In conclusion, the methodology described in this work make possible the development of a fully automatic EMG signal analysis which is accurate, simple, fast and reliable enough to be used in routine clinical environment.
1. Introduction
The motor unit is the smallest functional unit of the muscle. At slight voluntary muscle contraction the MUAP is recorded to reflect the electrical activity of a single anatomical motor unit. The MUAP findings are used to detect and describe different neuromuscular diseases [1]. As the contraction intensity increases, more motor units are recruited. Different MUAPs will overlap; causing an interference pattern in which the neurologists cannot detect individual MUAP shapes reliably.
Traditionally, neurophysiologists assess MUAPs from their shape using an oscilloscope and listening to their audio characteristics. On this way, an experienced neurophysiologist can detect abnormalities with reasonable accuracy. Subjective MUAP assessment, although satisfactory for the detection of unequivocal abnormalities, may not be sufficient to delineate less obvious deviations or mixed patterns of abnormalities [2].These ambiguous cases call for quantitative MUAP analysis.
With the development of quantitative EMG techniques, some automated decision making systems of neuromuscular disorder diagnosis emerged. Coatrieux and associates applied cluster analysis techniques for the automatic diagnosis of pathology based on MUAP records [3]-[5]. Andreassen and co-workers developed the MUNIN (Muscle and Nerve Inference Network) which employs a causal probabilistic network for the interpretation of EMG findings [6]-[8]. Fuglsang-Frederiksen and his group developed a rule-based EMG expert system named KANDID [9], [10] and Jamieson developed an EMG processing system based on augmented transition networks [11], [12]. In most of these systems, the generation of the input pattern assumes a probabilistic model, with the matching score representing the likelihood that the input pattern was generated from the underlying class [13]. In addition, assumptions are typically made concerning the probability density function of the input data. Pattichis et al gave a series research yield of classifying MUAPs for differentiation of motor neuron diseases and myopathies from normal [14]. The classifier they used were mainly neural networks, e.g. back propagation, the radial basis function and the self organizing feature map network. However, the aforementioned techniques used to train the neural network classifiers are based on the idea of minimizing the train error, which is named empirical risk. As a result, limited amounts of training data and over high training accuracy often lead to over training instead of good classification performance.
SVMs introduced by Vapnik [15] is founded in the framework of the statistical learning theory, which is appropriate for approaching classification and regression problems. SVMs represent a new approach to pattern classification that has attracted a great deal of interest in the machine learning community. They operate on the induction principle of structural risk minimization, which minimizes an upper bound on the generalization error. SVMs have shown to be successful in solving many pattern recognition problems [16] and perform much better than non-linear classifiers such as artificial neural networks in many situations [17].
In this preliminary study, we investigated the binary SVM classifier for classification of MUAPs recorded from the biceps brochii muscle. The experimental results proved that the SVM can effectively identify motor neuron diseased and myopathic subjects from normal.
This paper is organized as follows: Section 2 presented the material and methodology used for classification of MUAPs. The experimental results are illustrated in section 3 and section 4 covered the conclusion.
2. Material and Methodology
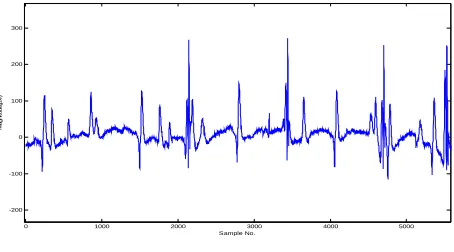
2.1. Data acquisition and pre-processing
0 1000 2000 3000 4000 5000 -200
-100 0 100 200 300
Sample No.
M
ag
ni
tud
e(
µ
V
)
Fig. 1. Raw EMG signal.
2.2. MUAP identification
The EMG signal is segmented into intervals of possible MUAPs. The segmentation algorithm used is data driven. First, a threshold depending on the maximum value
max
i
x
i and the mean absolute value
L
i i
x
L
1
1
of the whole EMG signal is calculated, wherex
i the discrete input values andL
is the number of samples in the EMG signal. Peaks over the calculated threshold are considered as candidate MUAP’s. Then a window of 120 sampling points (i.e., 6 ms at 20 kHz) is centered at the identified peak. If a greater peak is found in the window, the window is centered at the greater peak; otherwise the 120 points are saved as MUAP waveform [18].The segmented EMG signal centered at the maximum peak is shown in Fig. 2.
0 20 40 60 80 100 120
-200 -100 0 100 200 300 400
Sample No.
M
ag
ni
tude(
µ
V
)
Fig. 2. Segmented EMG signal in segments of 6ms and centered at the maximum peak.
2.3. MUAP clustering
In this step, the MUAP clusters are automatically detected and for each cluster the average or template shape is determined. We have used statistical pattern recognition technique for clustering of similar MUAPs. In this technique the euclidian distance is used to identify and group similar MUAP waveforms. The group average is continuously calculated and is used for the classification of MUAPs using a constant threshold [19]. The steps are:
Step1: Start with the first waveform x as input (the first member of the class).
Step2: Calculate the vector length of x (
l
x) and the distance between it and the other segmented waveforms y. Step3: Find the waveform y with the minimum distancedmin. The waveform y having minimum distance with the x has the greatest similarity with x and remove it from the input data.Step4: If
d
min/
l
x
0
.
3
then group, calculate group average and go to step 1 with group average as input. else if number of group members > 2, then form a new class.else waveform is superimposed, go to step 1 with y as input.
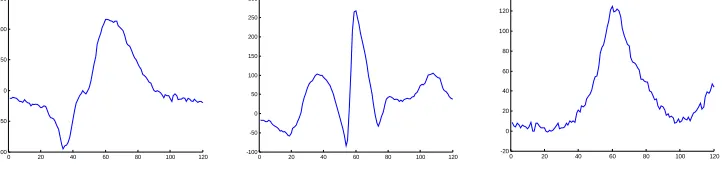
critical because a smaller value may split a MUAP class with high waveform variability in two or more subclasses, whereas a greater threshold value may merge resembling MUAP classes. The averaged class waveforms are again the unique MUAP waveforms composing the EMG signal. Fig. 3 illustrates clustered EMG signal.
0 20 40 60 80 100 120 -100
-50 0 50 100 150
0 20 40 60 80 100 120 -100
-50 0 50 100 150 200 250 300
0 20 40 60 80 100 120 -20
0 20 40 60 80 100 120 140
Fig. 3. Clustered EMG signal of a NOR subject.
2.4.Computation of MUAP features
The next stage is the computation of MUAP features. To perform this computation an MUAP is expanded to 25ms on the original signal where the position of identified peak was marked during segmentation. The rationale is that the MUAP duration is in most of the cases longer than 6ms and the signal expansion is therefore, necessary for a correct measurement of parameters [20]. The following time domain parameters are computed from the MUAP waveforms:
Spike duration: measured from the first to the last positive peak.
Amplitude: Amplitude difference between minimum positive and maximum negative peak. Area: Rectified MUAPs integrated over the calculated duration
Phases: Number of baseline crossings where amplitude exceeds ±25µV, plus one.
Turns: Number of positive and negative peaks where the difference from the preceding and following turn exceeds 25µV.
2.5.MUAP classification
In order to classify the clustered MUAPs into NOR, MYO and MND classes, a binary SVM classifier is employed [21], [22]. A classification task based on SVM usually involves training and testing data, which consist of a number of data instances. Each instance in the training set contains one ‘‘target value’’ (class labels) and several ‘‘attributes’’.
In this work we have used binary SVM classifier first, to classify the normal and diseased subjects. If the signal is diseased, then another binary classifier is used to classify MYO and MND signals.
3. Results
EMG data collected from 12 subjects were analyzed using the methodology described in Section II. Data were recorded from 3 NOR, 5 MYO and 4 MND subjects. Only subjects with no history or signs of neuromuscular disorders were considered as normal. MATLAB was used for implementing the algorithms. The means and standard deviations of the aforementioned time domain features of each subject are computed as the input feature vector of support vector machine. The classification accuracy of binary SVM classifier is 75.06%.
4. Conclusion
An integrated binary classifier based on SVM is adopted in clinical electromyography for differentiating neuromuscular disorders. The objective of SVM is to find optimal hyperplane for separating MUAP clusters. Experimental results show that the binary SVM classifier can be effectively trained for MUAPs diagnosis. Still the diagnostic results could be further investigated in future works with larger data set and other feature sets.
References
[1] Stalberg, E.; Nandedkar, S. D.; Sanders, D. B.; et al. (1996): Quantitative Motor unit potential analysis, Clin. Neurophysiol, 13(5), pp. 401-422.
[2] Richfield, E. K.; Cohen, B. A.; Albers, J. W. (1981): Review of quantitative and automated needle electromyographic analyses, IEEE
Trans. Biomed. Engg., pp. 506-514.
[3] Coatrieux, J. L.; Toulouse, P.; Rouvrais, B.; Le Bars, R. (1983): Automatic classification of electromyographic signals, EEG Clin.
[4] Rouvrais, B.; Toulouse, P.; Coatrieux, J. L.; Le Bars, R. (1983): A possible method of automatic electromyographic analysis and diagnosis on line, Electmyogr. Clin. Neurophysiol, 23, pp. 457-470.
[5] Toulouse, P.; Coatrieux, J. L.; Le Marec, B. (1985): An attempt to differentiate female relatives of Duchenne type dystrophy from
healthy subjects using an automatic EMG analysis, J. Neurolog. Sci., 67, pp. 45-55.
[6] Andersen, S. K.; Andreassen, S.; Woldbye, M. (1986): Knowledge representation for diagnosis and test planning in the domain of
EMG, Proc. 7th Eur. Conf. on Artificial Intell., Brighton, U.K., pp. 357-368.
[7] Andreassen, S.; Andersen, S. K.; Jensen, F. V.; Woldbye, M.; Rosenfalck, A.; Falck B.; Kjaerluff, U.; Sorensen, A. R. (1987):
MUNIN- An expert system for EMG, Electroenceph. Clin. Neurophvsiol., 66.
[8] Andreassen, S.; Jensen, F.; Andersen, S. K.; Falck, B.; Kjaerulff, U,; Woldbye M.; Sorensen, A. R.; Rosenfalck, A.; Frank, J. (1989):
MUNIN- An expert EMG assistant, In Computer Aided Electromygraphy and Expert Systems, J. E. Desmedt, Ed. New York,
Elsevier Science Publisher B.V., pp. 255-277.
[9] FugIsang-Frederiksen, A.; Jeppesen, S. M. (1989): A rule-based EMG expert system for diagnosing neuromuscular disorders, In
Computer Aided Electromyography and Expert Systems, J. E. Desmedt, Ed. New York, Elsevier Science Publishers B.V., pp. 289-296.
[10] Fuglsang-Frederiksen, A.; Ronager, J,; Vingtoft, S. (1990): A plan-test diagnose expert system for EMG: KANDID, J. Neurolog. Sci.,
98 pp. 150.
[11] Jamieson, P. W. (1990): Computerized interpretation of electromyographic data, Electroencephalogr. Clin. Neurophysiol., 75, pp. 392. [12] Jamieson, P. W. (1991): A model for diagnosing and explaining multiple disorders, Comput. Biomed. Res., 24, pp. 307-320.
[13] Lippmann, R. P. (1987): An introduction to computing with neural nets, IEEE ASSP Mag.
[14] Contantinos Pattichis S.; Andread Elia C. (1999): Autoregressive and ceptral analyses of motor unit action potentials, Med. Engg.
Physic., 21, pp. 405-419.
[15] Vapnik, V. P. (1995): The nature of statistical learning theory,Springer,Verlag, New York.
[16] Gurmanik, K.; Dr. Ajat Shatru, A.; Dr. Vijender Kumar, J. (2009) Multi-Class Support Vector Machine Classifier in EMG Diagnosis,
WSEAS Transactions on Signal Processing, 5(12), pp. 379-389.
[17] Yu-Dong, C.; Xiao-Jun, L.; Xue-Biao, X.; et. Al. (2002): Prediction of protein structural classes by support vector machines, Comput. Chemi, 26, pp. 293-296.
[18] Gurmanik, K.; Dr. Ajat Shatru, A.; Dr. Vijender Kumar J. (2009): Comparison of the techniques used for Segmentation of EMG
Signals, Proc. 11th
WSEAS Inter. Conf. on Mathematical and Computational Methods in Science and Engineering, Baltimore, USA, pp. 124-129.
[19] Gurmanik, K.; Vijender Kumar, J.; Ajat Shatru, A. (2010): Automatic Discovery of the MUAP Clusters in EMG Signals, Proc.
National Conference on Recent Advances in Computational Techniques in Electrical Engineering, SLIET, Longowal, Sangrur, Punjab, INDIA.
[20] Katsis, C. D.; Fotiadis, D. I.; Likas, A.; Sarmas, I. (2003): Automatic discovery of the number of MUAP clusters and superimposed
MUAP decomposition in electromyograms, Proc. 4th
Annual IEEE Conf. on Information Technology Applications in Biomedicine, UK, pp. 177-180.
[21] Boser, B.; Guyon, I.; Vapnik,V. (1992): A training algorithm for optimal margin classifiers, Proc. 5th Annual Workshop on
Computational Learning Theory, ACM Press.