CODEN (USA)-IJPRUR,e-ISSN: 2348-6465
Original Article
Method Development and Validation of Efavirenz by
RP-HPLC Method
Mitta Chaitanya*, Kalepu Swathi , P Narayan raju, Koduru Swathi
Department of Pharmaceutical Analysis, Bojjam Narsimhulu Pharmacy College for Women, Hyderabad- 500088, India
A R T I C L E I N F O A B S T R A C T
_______________________________________________________________________________
1. INTRODUCTION
A large number of chemically bonded stationary
phases based on silica are available commercially.
Silica based stationary phases are still most popular in
reversed phase chromatography however other
absorbents based on polymer (styrene-di-vinyl benzene
copolymer) are slowly gaining ground.The retention
decreases in the following order: aliphatics > induced
International Journal of Pharma Research and Health Sciences
Available online atwww.pharmahealthsciences.net
Received: 13 Apr 2015
Accepted: 28 Apr 2015 A selective and sensitive stability-indicating high-performance liquidchromatographic method was developed and validated for the determination of Efavirenz. 10 mg of Efavirenz was dissolved in mobile phase. 25 mg of Efavirenz standard was transferred into 25ml volumetric flask, dissolved in mobile phase & make up the volume with mobile phase. Accurately weighed around 25mg of Efavirenz working standard, taken into a 25ml volumetric flask, then dissolved in mobile phase and diluted to volume with the mobile phase to obtain a solution having a known concentration of about 1000 mcg/ml. To determine the accuracy of the proposed method, recovery studies were carried out by adding different amounts (80%, 100%, and 120%) of pure drug of EFAVIRANZ were taken and added to the pre-analyzed formulation of concentration 10g/ml. From that percentage recovery values were calculated.The precision of each method was ascertained separately from the peak areas & retention times obtained by actual determination of five replicates of a fixed amount of drug. Efavirenz (API). Influence of small changes in chromatographic conditions such as change in flow rate (0.1ml/min), Temperature (20C), Wavelength of detection (2nm) & acetonitrile content in mobile phase (2%) studied to determine the robustness of the method are also in favour of (Table-4, % RSD < 2%) the developed RP-HPLC method for the analysis of Efavirenz. Further dilution was done by transferring 0.1 ml of the above solution into a 10ml volumetric flask and make up the volume with mobile phase.
Keywords:Efavirenz e., RP-HPLC, Acetonitrile (30:70). & Retention time.
Corresponding author *
M Chaitanya et al. Volume 3 (3), 2015, Page-763-768
dipoles (i.e. CCl4) > permanent dipoles (e.g.CHCl3) >
weak Lewis bases (ethers, aldehydes, ketones) > strong
Lewis bases (amines) > weak Lewis acids (alcohols,
phenols) > strong Lewis acids (carboxylic acids). 1-3
Also the retention increases as the number of carbon
atoms increases. As a general rule the retention
increases with increasing contact area between sample
molecule and stationary phase i.e. with increasing
number of water molecules, which are released during
the adsorption of a compound. Branched chain
compounds are eluted more rapidly than their
corresponding normal isomers. In reversed phase
systems the strong attractive forces between water
molecules arising from the 3-dimentional inter
molecular hydrogen bonded network, from a structure
of water that must be distorted or disrupted when a
solute is dissolved. Only higher polar or ionic solutes
can interact with the water structure. Non- polar solutes
are squeezed out of the mobile phase and are relatively
insoluble in it but with the hydrocarbon moieties of the
stationary phase.4, 5Chemically bonded octadecylsilane
(ODS) an alkaline with 18 carbon atoms is the most
popular stationary phase used in pharmaceutical
industry. Since most pharmaceutical compounds are
polar and water soluble, the majority of HPLC methods
used for quality assurance, decomposition studies,
quantitative analysis of both bulk drugs and their
formulations use ODS HPLC columns. The solvent
strength in reversed phase chromatography is reversed
from that of adsorption chromatography (silica gel) as
stated earlier. Water interacts strongly with silanol
groups, so that, adsorption of sample molecules
become highly restricted and they are rapidly eluted as
a result. Exactly opposite applies in reversed phase
system; water cannot wet the non-polar (hydrophobic)
alkyl groups such as C18 of ODS phase and therefore
does not interact with the bonded moiety. Hence water
is the weakest solvent of all and gives slowest elution
rate. The elution time (retention time) in reversed
phase chromatography increases with increasing
amount of water in the mobile phase. In normal phase
chromatography, the stationary phase is a polar
adsorbent and the mobile phase is generally a mixture
of non-aqueous solvents. The silica structure is
saturated with silanol groups at the end. These OH
groups are statistically disturbed over the whole of the
surface. The silanol groups represent the active sites
(very polar) in the stationary phase. This forms a weak
type of bond with any molecule in the vicinity when
any of the following interactions are present.6, 7
Efavirenz is an HIV-1 specific, non-nucleoside, reverse
transcriptase inhibitor (NNRTI).
Fig 1: Structure of Efavirenz
2. EXPERIMENTAL WORK
2.1 Materials and Methods
Selection of wavelength: 10 mg of Efavirenz was
dissolved in mobile phase. The solution was scanned
from 200-400 nm the spectrum was obtained. The
overlay spectrum was used for selection of wavelength
for Efavirenz. The isobestic point was taken as
detection wavelength.8
2.2 Chromatographic trials for simultaneous estimation of Efavirenz by RP- HPLC.
Chromatographic conditions
Column : Agilent (4.6×150mm) 5µ
Mobile phase ratio : water: ACN (40:60% v/v)
Detection wavelength : 274 nm
Flow rate : 0.7 ml/min
Injection volume : 10µl
Column temperature : Ambient
Run time : 10min
Retention time : 2.425min
Fig 2: Chromatogram showing injection
The separation was good, peak shape was good, so we
conclude that there is no required for decrese the
retention times of peak, so it is taken as final method.
Preparation of mobile phase.
Mix a mixture of 40 ml water (40%) and 60 ml of
Acetonitrile (60%) and degassed in ultrasonic water
bath for 5 minutes. Filter through 0.22 µ filter under
vacuum filtration.
Preparation of the individual Efavirenz standard
preparation
10 mg of Efavirenz working standard was accurately
weighed and transferred into a 10 ml clean dry
volumetric flask and add about 2 ml of diluent and
sonicate to dissolve it completely and make volume up
to the mark with the same solvent (Stock
solution).Further pipette out 1.0 ml from the above
stock solution into a 10 ml volumetric flask and was
diluted up to the mark with diluent.
Preparation of the Efavirenz standard and sample
solution
2.3 Sample solution preparation
10 mg of Efavirenz tablet powder was accurately
weighed and transferred into a 10 ml clean dry
volumetric flask, add about 2ml of diluent and
sonicate to dissolve it completely and making volume
up to the mark with the same solvent(Stock solution).
Further pipette 10ml of the above stock solution into a
100ml volumetric flask and was diluted up to the mark
with diluent.
2.4 Standard solution preparation
10 mg Efavirenz working standard was accurately
weighed and transferred into a 10ml clean dry
volumetric flask and add about 2ml of diluent and
sonicate to dissolve it completely and make volume up
to the mark with the same solvent (Stock
solution).Further pipette out 1ml of the above stock
solution into a 10ml volumetric flask and was diluted
up to the mark with diluent.9, 10
Repeatability
2.5 Preparation of stock solution
10 mg of Efavirenz working standard was accurately
weighed and transferred into a 10ml clean dry
volumetric flask add about 2ml of diluent and sonicate
to dissolve it completely and make volume up to the
mark with the same solvent. Further pipette out 1ml of
the above stock solution into a 10ml volumetric flask
and was diluted up to the mark with diluent.11, 12
Procedure: The standard solution was injected for five
times and measured the area for all five injections in
HPLC. The %RSD for the area of five replicate
injections was found to be within the specified limits.
Table 1: Data of System Suitability Parameter
S.No. Parameter Limit Result 1 Resolution Rs2 4.15
2 Asymmetry T2 Efavirenz=0.59
3 Theoretical plate N2000 Efavirenz=3698
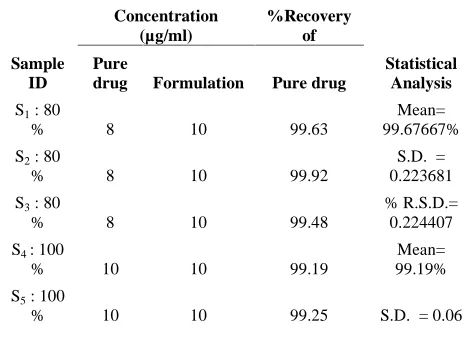
Table.2: Accuracy Readings
Sample ID
Concentration (µg/ml)
%Recovery of
Statistical Analysis Pure
drug Formulation Pure drug
S1: 80
% 8 10 99.63
Mean= 99.67667% S2: 80
% 8 10 99.92
S.D. = 0.223681 S3: 80
% 8 10 99.48
% R.S.D.= 0.224407 S4: 100
% 10 10 99.19
Mean= 99.19% S5: 100
M Chaitanya et al. Volume 3 (3), 2015, Page-763-768
S6: 100
% 10 10 99.13
% R.S.D.= 0.06049 S7: 120
% 12 10 99.25
Mean= 99.49% S8: 120
% 12 10 99.54
S.D. = 0.219317 S9: 120
% 12 10 99.68
% R.S.D. = 0.220441
3. RESULTS AND DISCUSSION
System suitability testing is an integral part of many
analytical procedures. The tests are based on the
concept that the equipment, electronics, analytical
operations and samples to be analyzed constitute an
integral system that can be evaluated as such.
Following system suitability test parameters were
established. The data are shown in Table 39.
The performance test of the method has been
conducted on market sample. As per the label claim,
each tablet contains 600mg of Effavirenz. To estimate
this powder of the tablet equivalent to 25mg of
Effavirenz has been dissolved in 25ml of the mobile
phase. Further dilution was done by taking 1ml of this
solution in 10ml volumetric flask, dissolve and making
up the volume upto the mark with mobile phase by
which 100ppm solution was prepared. Again same
process is repeated to make 10ppm from 100ppm
solution. To extract the drug in the solution, it has been
sonicated for 5 minutes followed by cyclo-mixing for 5
minutes. Resulting solution was filtered by using
Millipore syringe filter (0.45 micron). Resulting clear
solution was injected in HPLC in duplicate as per the
above mentioned HPLC method. Chromatogram
obtained for the injection is shown below with Rt of
2.90 mins.
1.53
2.68
0 1 2 3 4 5 6 7
Retention Time (min) 0
5 10 15
Intensity
(mV
)
Fig 2: Chromatogram for specificity sample
Recovery study: To determine the accuracy of the
proposed method, recovery studies were carried out by
adding different amounts (80%, 100%, and 120%) of
pure drug of EFAVIRANZ were taken and added to
the pre-analyzed formulation of concentration
10g/ml. From that percentage recovery values were
calculated.
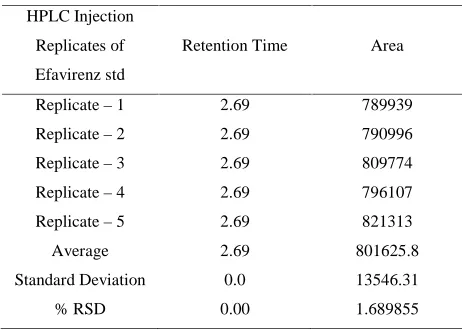
Repeatability- The precision of each method was
ascertained separately from the peak areas & retention
times obtained by actual determination of five
replicates of a fixed amount of drug. Efavirenz (API).
The percent relative standard deviation were calculated
for Efavirenz are presented.
Table 3: Result of retention time
HPLC Injection Replicates of Efavirenz std
Retention Time Area
Replicate–1 2.69 789939 Replicate–2 2.69 790996 Replicate–3 2.69 809774 Replicate–4 2.69 796107 Replicate–5 2.69 821313 Average 2.69 801625.8 Standard Deviation 0.0 13546.31 % RSD 0.00 1.689855
Linearity & Range:
The calibration curve showed good linearity in the
range of 0-35 µg/ml, for Efavirenz (API) with
correlation coefficient (r2) of 0.996 (Fig. 4). A typical
calibration curve has the regression equation of y =
76594x–24947 for Efavirenz.
Fig. 3: Calibration curve of Efavirenz (API).
Table 4: Result of AUC
Conc. AUC (n -=6)
0 0
5 343726
15 1064970
25 1811846
35 2721573
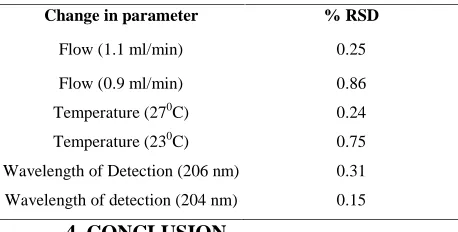
Method Robustness: Influence of small changes in
chromatographic conditions such as change in flow
rate ( 0.1ml/min), Temperature (20C), Wavelength
of detection (2nm) & acetonitrile content in mobile
phase (2%) studied to determine the robustness of the
method are also in favour of (Table-4, % RSD < 2%)
the developed RP-HPLC method for the analysis of
Efavirenz( API).
Table 5: Result of Method Robustness Test
Change in parameter % RSD
Flow (1.1 ml/min) 0.25
Flow (0.9 ml/min) 0.86 Temperature (270C) 0.24 Temperature (230C) 0.75 Wavelength of Detection (206 nm) 0.31 Wavelength of detection (204 nm) 0.15
4. CONCLUSION
To develop a precise, linear, specific & suitable
stability indicating RP-HPLC method for analysis of
Efavirenz, different chromatographic conditions were
applied & the results observed are presented in
previous chapters.Isocratic elution is simple, requires
only one pump & flat baseline separation for easy and
reproducible results. So, it was preferred for the current
study over gradient elution.In case of RP-HPLC
various columns are available, but here Develosil C18,
5µm, 150 x 4.6 mm i.d. column was preferred because
using this column peak shape, resolution and
absorbance were good.Mobile phase & diluent for
preparation of various samples were finalized after
studying the solubility of API in different solvents of
our disposal (methanol, acetonitrile, dichloromethane,
water, 0.1N NaOH, 0.1NHCl). The drug was found to
be highly soluble in acetonitrile, soluble in methanol.
Drug was insoluble in water. Using these solvents with
appropriate composition newer methods can be
developed and validated. Detection wavelength was
selected after scanning the standard solution of drug
over 200 to 400nm. From the U.V spectrum of
Efavirenz it is evident that most of the HPLC work can
be accomplished in the wavelength range of 240-320
nm conveniently. Further, a flow rate of 1 ml/min & an
injection volume of 20 µl were found to be the best
analysis. The result shows the developed method is yet
another suitable method for assay and which can help
in the analysis of Efavirenz in different formulations.
5. REFERENCES
1. Michael E. S., Ira S. K., Analytical Method
Development and Validation, Marcel Dekker, Inc.,
New York, 1997; 25-29.
2. Connors K.A, A Text Book of Pharmaceutical
Analysis, Wiley-Inter science, Singapore, 1999;
175.
3.
Http://www.pharmainfo.net/review/Introduction-analytical-method-development –
pharmaceutical-formulations #content
4. Willard-H.H., Lynne L.M. Jr., John A., Dean F.A.,
Instrumental Methods of Analysis, 7th Edn., CBS
Publishers and Distributors, New Delhi ;1-12,
580-610, 614-652.
5. Davidson A.G, Basis of Spectrophotometry, 4th
Ed., Part-2, CBS Publishers, New Delhi, 2002;
264-74.
6. Fronk A.S.,Handbook of Instrumental Techniques
for Analytical Chemistry, 1st Edn., Pearson
Education, 2004 ; 7.
7. Skoog D.A., Holler F.J., Nieman D.A.,Principle of
Instrumental Analysis, 6th ed Reprint, Thomson
Brooks/Cole publication, 2004 ; 300-351.(UV)
8. Sharma Y.R., Elementary Organic Spectroscopy,
Principle & Chemical Applications, S. Chand &
Company Ltd., New Delhi, 2005; 8.
9. Kalsi P.S., Spectroscopy of Organic Compounds,
5th ed, New Age International Publishers New
M Chaitanya et al. Volume 3 (3), 2015, Page-763-768
10. Braun R.D.,Introduction to Instrument Analysis,
Pharma Book Syndicate, Hyderabad, 2005; 261.
Pharmaceutical Chemistry”, (1997), 4th edition,
Part 2, CBS Publishers and Distributors ; 275-337.
11. Dyer J.R., Application of Absorption Spectroscopy
of Organic Compounds. Prentice Hall of India Pvt.
Ltd, New Delhi 2005.
12. Snyder L.R., Kirkland J.J. and Glajch L.J.,
Practical HPLC Method Development, 2nd Edn.,
John Wiley and Sons, Inc., 1997; p.p. 2-18.