* Corresponding author. Tel.:+86 15194794669; email: [email protected] Manuscript submitted June 5, 2017; accepted August 1, 2017.
doi: 10.17706/jcp.13.6 588-595.
Abstract: The initial clustering centers of traditional bisecting K-means algorithm are randomly selected and the k value of traditional bisecting K-means algorithm could not determine beforehand. This paper proposes a improve bisecting K-means algorithm based on automatically determining K value and the optimization of the cluster center. Firstly, the initial cluster centers are selected by using the point density and the distance function; Secondly, automatically determining K value is proposed by using Intra cluster similarity and inter cluster difference. the experiment results on UCI database show that the algorithm can effectively avoid the influence of noise points and outliers, and improve the accuracy and stability of clustering results.
Key words: Bisecting k-means, K, cluster center, accuracy rate.
1.
Introduction
Cluster analysis is a set of data objects into different clusters, so that the same cluster (or class), the similarity between objects, and different clusters (or class) of the differences between the objects. Clustering analysis has been widely used in many fields, such as marketing, land use, urban planning, earthquake research and so on [1].
The K-means algorithm is a typical objective function clustering method based on the prototype, the optimization of the objective function is a distance between data points to the prototype, and the algorithm for the center point defined before clustering prototype, given the number of clusters
K
, the Euclideandistance as the similarity measurement method, using the squared error function as the clustering criterion function. Through iterative updates, the goal of each iteration is to make the target function smaller, when the objective function has a minimum value when the end of the algorithm, get the final clustering result. The disadvantage of this algorithm is that the number of clusters
K
could not determine beforehand, therandom selection of initial cluster centers
c
iand the sensitivity to noise and outlier data [2].Bisecting k-means algorithm is optimized and extended k-means algorithm, first of all the data points as a whole data set, making a data partition; then in the two data sets after division, select one for second data partition, cycle down. The algorithm is superior to the K-means algorithm in the selection of initial center points. But Bisecting k-means algorithm also needs a predetermined
K
value, and Bisecting k-meansalgorithms usually use two randomly selected initial points, if mistakenly outliers or noises as the initial cluster center, after repeated iteration will cause large deviation of final clustering results [3].
2.
Traditional Bisecting K-means Algorithm
Bisecting K-means Algorithm Based on K-valued
Self-determining and Clustering Center Optimization
Jian Di, Xinyue Gou*
The basic idea of bisecting K-means algorithm is: determining the number of cluster
K
, selecting two centersx
0andx
1, using the standard k-means algorithm to x data set is divided into two clusters, and thencalculating the SEE of two clusters, choosing the largest SEE clusters to split, cycle down, until the number of the cluster is equal to
K
[4]. The algorithm steps of the bisecting k-means algorithm are shown as follows:Input
K
and data setX
.Initialize the data set, and make the number of clusters,
n
1
.Randomly select the two points
x
0,
x
1as the initial cluster center of the first split. The standardk-means (k=2) algorithm is used to get two clusters,
n
n
1
.Calculate the SEE of the two clusters, take out the largest SEE go to step 2 to continue.
Repeat the iteration step 2 and 3 until the number of clusters n is equal to the K value. The flow chart of the algorithm is shown in Fig. 1.
Start
Input: K and data set.
Initialize the data set, and make the number of clusters, n=1
Randomly select the two points as the initial cluster center of the first split.The standard k-means (k=2) algorithm is used to get two clusters.
n<k
Calculate the SEE of the cluster of two, take out the largest SEE .
end N
Y
Fig. 1. Bisecting k-means algorithm flow chart.
The shortcomings of the traditional bisecting k-means algorithm: Firstly, the
K
value could not determinebeforehand; if
K
value is not selected properly, it will cause a large deviation between the results and thepointx1,
x
0,
x
1as the initial clustering center of first division [7]. This algorithm can effectively avoid theinfluence of noise points and outliers on clustering results. In addition, this paper proposes an algorithm to automatically determine the
K
value, which is based on Intra cluster similarity and inter cluster difference[8], [9]. This algorithm can effectively avoid the influence of
K
value on the clustering results.3.1.
Determination of Cluster Centers
Assuming that the data points
q
andj
, B(q,j)expressed by the impact ofj
on the function ofq
,andB(q,j)is a function determined by the distance between
q
andj
.The distance functiond(q,j)isrepresented by the Euclidean distance formula:
2 2 2 2 2 11 . . .
,j xq xj xq xj xqk xjk
q
d
(1)
Influence function B(q,j) is represented by Gauss function
Gause(
q
,
j
)
:2 2 2 ) , (
)
,
(
Gauseq
j
e
d qj
(2)
The density function of the data point
q
is the sum of the influence functions of all the data points. If thedata setXcontainsKdata points, the density function of the data point
q
is represented as follows [10]:
(3)
Then the density function of the data point
q
is represented as follows:
(4)
From the above formula,
d
(
q
,
j
)
represents betweenq
andj
distance, the distance is small, then thepoint around the more compact, it means that the density is greater, the greater density of points the more likely is the cluster center.
In general, we use intra cluster similarity and inter cluster difference to evaluate the clustering results[11]. In this paper, we use intra cluster similarity and inter cluster difference to propose a method to auto-determine the K value.
Intra cluster similarity is used to evaluate the clustering degree, which can be represented by the average value of the distance between cluster data points and cluster centers. Then, the similarity within clusters is expressed as follows:
(5) Among them, mrepresents the number of data points within the cluster,
c
irepresents the cluster center.Inter cluster difference is used to evaluate the degree of separation between different classes, which can be represented by the minimum distance between the centers. Then, Inter cluster difference is expressed as follows:
q
qk j j B X B
1
k j j q d XB q e
q 1 2 ) , ( 2 2 ) ( m c x
I x ci
i
(6)
Among them,
c
i,
c
j represents the center point of two different clusters.In this paper, we use intra cluster similarity and inter cluster difference to propose a new method to determine the K value, then indicate as follows:
O I I O
(7) In the formula, the value of
in the range between [-1, 1],
closer to 1, it means thatI
can be ignored, itshows that the better the clustering effect;
closer to -1, it means thatO
can be ignored, indicating that theworse the clustering effect. In order to get better clustering results, should cluster within intra cluster as possible as, and separate within inter cluster as possible as. the size of
should be between [0.5,1], if the
is too small, will cause belonged to a cluster of data points are divided into two clusters, reduce the clustering effect.3.3.
Steps and Processes to Improved Bisecting K-means Algorithm
start
initializing the data set,N=1
Calculating the density of each point in the data set(using the Gauss point density formula) and the average density,in the range of greater than the average value of the point density, first select the highest point densityx0, and then select the farthest distance of the point, thenx0,x1as the split of the two initial clustering centers.
Using the standard k-means (k=2) algorithm to cluster to obtain the new cluster of two,.N=N+1
Calculating the center point of the newly obtained cluster (using the density formUla, select the midpoint of each new cluster, which is the central point of the cluster), and add the new center point into the C.
Calculating the distance between the center points of the, and use the formula (2-5) to calculate the average distance of each data point to the center of the cluster.
αє[0.5,1]
output the number of clusters and clustering results.
end
Comparing the density of all the center points in the cluster set, and take out the center of the cluster where the density is the smallest
Y
N
Fig. 2. Improved bisecting point k-means algorithm process.
The specific steps of the improved bisecting k-means algorithm are as follows:
4.
Experiment and Result Analysis
4.1.
Experimental Environment
In order to verify the effectiveness and accuracy of the improved bisecting K-means algorithm. This paper selects the frequent use of UCI database in the Iris dataset, Diabetes dataset and Wine dataset as test data, and the clustering results are compared with the traditional K-means clustering algorithm and bisecting K-means algorithm [12]. UCI database is a standard test database for machine learning and data mining. For the experimental computer CPU is Intel (R) i5-3210M (TM) [email protected], memory is 4GB,experimental software environment: operating system 64 Windows7, experimental platform matlab7.11.0 Core. The relevant attributes of the 3 test data sets are shown below in Table 1 [13].
Table 1. Experimental Data Sets
Dataset name Sample number Attribute dimension Number of categories
Iris 150 4 3
Wine 178 13 3
Diabetes 768 8 2
4.2.
Experimental Results Analysis
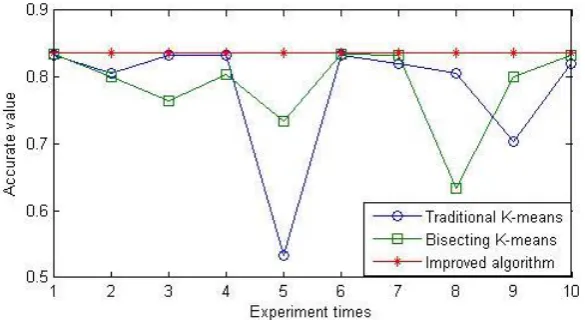
Fig. 3. Comparison of the accuracy of the three algorithms on the Iris dataset.
Calculate the density of each point in the data set
X
(use the Gauss point density formula) and the average density, in the range of greater than the average value of the point density, first select the highest point densityx
0, and then select the farthest distance of the pointx
1, thenx
0,
x
1as the split of the two initialclustering centers.
Use the standard k-means (k=2) algorithm to cluster to obtain the new cluster of two,
N
N
1
.Calculate the center point of the newly obtained cluster (use the density formula, select the
maxpoint ineach new cluster, which is the central point of the cluster), and add the new center point into the C.
Calculate the distance between the two center points
d
(
x
i,
x
j)
, and refer to (5) to calculate the average distance of each data point to the center of the cluster.Calculate
refer to (7), if the
[
0
.
5
,
1
]
jump to step 8, if the
[
1
,
0
.
5
)
jump to step 7.Compare the density of all the center points in the cluster set
C
, and take out the cluster that the densityof center point is smallest, then go back to Step2 to continue.
The end of the algorithm, and output the number of clusters and clustering results.
Fig. 4. Comparison of the accuracy of the three algorithms on the diabetes dataset.
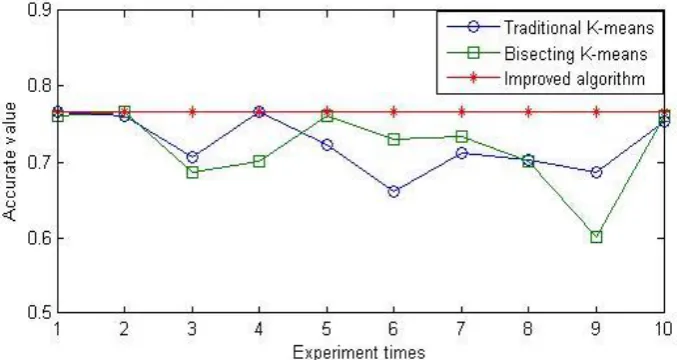
Fig. 5. Comparison of the accuracy of the three algorithms on the wine dataset.
This paper compares three algorithms using different data sets for the 10 experiment. The results of the three algorithms are shown in Fig. 3, Fig. 4 and Fig. 5.
The above three results show that: for the Iris data set, using the traditional K-means algorithm, the highest accuracy rate can reach 83.33%, the lowest is only 53.33%, the average value is 78.23%; using bisecting K-means algorithm the highest accuracy rate can reach 83.44%, the lowest was 63.33%, the average value is 78.69%;Improved algorithm accuracy rate reached 83.66%.For the Diabetes data set, using the traditional K-means algorithm, the highest accuracy rate reached 65.67%, the lowest was 53.04%, the average value is 61.99%;using bisecting k-means algorithm the highest accuracy rate reached 65.68%, the lowest was 54.21%, the average value is 62.25%; Improved algorithm accuracy rate reached 65.66%.For the Wine data set, using the traditional K-means algorithm, the highest accuracy rate can reach 76.63%, the lowest 66.06%, the average value is 72.39%;using bisecting K-means algorithm the highest accuracy rate can reach 76.63%, the lowest was 60.06%, the average value is 71.99%;Improved algorithm accuracy rate reached 76.66%.Therefore, the traditional K-means and bisecting K-means clustering result is not stable, the selection of initial clustering center and K value on the accuracy of the algorithm have great influence, but the improved algorithm is stable and accurate.
This paper proposes a improve bisecting K-means algorithm based on automatically determining K value and the optimization of the cluster center, the algorithm uses the point density and distance function combination selection of cluster centers, effectively avoid the effect of outliers and noise on the clustering results; and uses Intra cluster similarity and inter cluster difference automatic determination of K value, can effectively avoid the influence of improper selection of clustering results of K value. The experimental results show that the proposed algorithm is much better than the traditional K-means algorithm and the bisecting K-means algorithm in terms of clustering accuracy and stability. In this paper, although the clustering center will waste a little time when choosing the clustering accuracy and stability, the convergence speed of this algorithm is faster, so the improved bisecting K-means algorithm is efficient and feasible. Next we will further study the problem of clustering center selection, to ensure the accuracy rate at the same time, improve the speed of selection, and then improve the overall speed of the algorithm.
References
[1] Jia, R., & Song, J. (2016). k-means optimal clustering number determination method based on clustering center optimization. Mcroelectronics and Computer, 5.
[2] Ji, X., Han, Z., & Li, K., et al .(2016). Application of the improved K means clustering algorithm based on density in the division of distribution network. Journal of Shandong University (Engineering Science
Edition), 4, 41-46.
[3] Liu, G., Huang, T., & Chen, H. (2015). Improved bisecting K-means clustering algorithm. Computer
Applications and Software, 2.
[4] Cui, L. (2015). Application of Data Mining in CRM Based on Customer Signature. Donghua University. [5] Joshi, K. D., & Nalwade, P. S. (2013). Modified K-means for better initial centers. International Journal of
Computer Science and Mobile Computing, 2(7), 219-223.
[6] Mag, W., Xu, Z. H., & Zhang, W., et al. (2014). An enriched K means clustering method for grouping fractures with meliorated initial center. Arabian Journal of Geosciences, 1-13.
[7] Xing, C., & Guo, H. (2015). K-means algorithm based on average density optimizing initial cluster centre.
Computer Engineering and Applications, 50(20), 135-138.
[8] Zhang, J., Zhuo, L., & Zhu, Y. (2015). The improvement and application of a K-means clustering algorithm.
Application of Electronic Technology, 1.
[9] Wang, Y., Tang, J., & Rao, F. (2014). High efficient K-means algorithm for determining optimal number of clusters. Journal of Computer Application, 34(5), 1331-1335.
[10]Luo, J., & Suo, Z. (2014). A density based k-means clustering algorithm. Microrlrctronics & Computer,
31(10), 28-31.
[11]Gu, J., Zhou, J., & Chen, X. (2009). An enhancement of k-means clustering algorithm. International
Conference on Business Interlligence and Financial Engineering, 237-240.
[12]Luo, Q. (2015). Robust clustering center optimization for K-means algorithm. Computer Engineering and
Design, 36(9), 2395-2400.
[13]UCI datasets. Retrieved from http://archive.ics.uci.edu/ml/datasets.html