Designing DNA Microarrays with Ant Colony Optimization
Nikola Ivkovic
1*, Marin Golub
2, Domagoj Jakobovic
21 Faculty of Organization and Informatics, University of Zagreb, Pavlinska 2, HR 42000 Varaždin, Croatia. 2 Faculty of Electrical Engineering and Computing, University of Zagreb, Unska 3, HR 10000 Zagreb, Croatia.
* Corresponding author. Tel.: +385 42 390872; email: [email protected] Manuscript submitted September 24, 2015; accepted December 10, 2015. doi: 10.17706/jcp.11.6.528-536
Abstract: DNA microarrays are manufactured by synthesizing probes on a solid surface with the help of light and a sequence of lithographic masks. Unintentional illumination can create defects on the microarray due to small dimensions and light properties, but a suitable arrangement of probes can reduce the probability of defects. The problem of designing DNA microarrays is computationally hard and there is no publicly available algorithm that can solve this problem exactly, in polynomial time. This study investigates the suitability of the ant colony optimization (ACO) metaheuristic for finding optimal or at least good microarray designs. This research is based on a MAX-MIN ant system variant that is enhanced with 2-opt local optimization and max-κ-best pheromone reinforcement strategy. Experiments were conducted on problem instances based on border length and conflict index models. The proposed algorithm found solutions that are better than the best solutions previously published for 10 out of 14 problem instances.
Key words: Biochip design, swarm intelligence, max-κ-best, MAX-MIN ant system.
1.
Introduction
A DNA microarray is a set of probes placed on solid material that can be used for genetic testing. The probes are fragments of DNA made from nucleobases: cytosine, guanine, adenine, and thymine. DNA microarrays, also known as biochips, have applications in genetics, molecular biology, medicine, and pharmacology for detecting genes, diagnosing diseases, inventing drugs, toxicological analyses etc. [1].
In the process of designing DNA microarrays arises a hard combinatorial problem of arranging probes in a way that minimizes the chance of defects and reduces the complexity of masks used in production.
For many optimization problems, efficient exact algorithms are not available. The question whether NP-hard problems can be solved in polynomial time remains unresolved in spite of serious research efforts. Over the past few decades, researchers have developed versatile metaheuristic methods that can often find good solutions for such problems, although they cannot guarantee finding optimal solutions.
In this paper, the possibility of using the ant colony optimization (ACO) metaheuristic for the microarray layout problem is investigated. Ant colony optimization (ACO) is a general metaheuristic inspired by the behavior of biological ants. It is a constructive type of a stochastic optimization algorithm whose construction procedure is guided by pheromone trails, and possibly by heuristic information that is specific to a particular type of the optimization problem. The pheromone trails are altered by ants to reflect the experience that the ants have gathered in previous attempts to find optimal solutions of the problem.
constraint satisfaction, and continuous optimization [2], [3].
The first published ACO algorithm, ant system (AS), proved to be a promising concept, but it could not compete with state-of-the-art algorithms. In attempts to improve algorithmic performance, different variants of ACO algorithms were published in the literature. Elitist ant system (EAS) allowed the best solution found from the beginning of the algorithm to additionally reinforce pheromone trails in order to improve convergence toward more promising areas in the search space[4]. Ant colony system (ACS) uses a rather greedy pseudorandom proportional rule in the solution construction procedure; there are local and global pheromone evaporations, and only one (“the best”) solution reinforces the pheromone trails [5]. Rank-based ant system (ASrank) enhances AS by using more elitism in the pheromone reinforcement procedure than EAS. Only a subset of the best solutions found in the current iteration and the best so far solution are used for the pheromone reinforcement procedure [6]. Approximate nondeterministic tree search (ANTS) introduces a unique rule for solution construction and does not perform explicit pheromone evaporation [7]. MAX-MIN ant system uses explicit pheromone bounds and pheromone reinitialization in the case the algorithmic stagnation is detected [8]. Best-worst ant system (BWAS) is similar to MMAS, but in addition, it incorporates mutation of pheromone trails (a concept from evolutionary algorithms) and negative feedback of the worst solution [9]. Three bound ant system (TBAS) uses occasional pheromone contractions instead of regular pheromone evaporations [10]. Among many versions of ACO, MAX-MIN ant system is the most popular owing to good results for many optimization problems; followed by ant colony system. TBAS is a new ACO algorithm experimentally evaluated only on a few types of optimization problems, but it showed very promising results (better than MMAS).
For the purpose of this research, MMAS with 2-opt local optimization and extended pheromone reinforcement strategies were used. Conducted experiments showed that MMAS is well-suited for the microarray layout problem, and for most problem instances the new best solutions were obtained.
2.
Microarray Design Problem
One way of producing a DNA microarray is to synthesize probes on a solid surface made of glass or plastic. At the beginning the microarray has empty spots, on which probes are built by adding nucleobase after nucleobase until all probes are completed. Although one probe in not actually one DNA molecule, but rather many copies of the same single-stranded DNA molecule on a particular spot, it is logically simpler to think about the probe as one single-stranded DNA molecule. The probes can be produced by using photolithography similar to the process of producing integrated circuits in microelectronics. Photolithographic masks are used to select spots on which particular nucleobases will be inserted. Using one mask (this is one step of production) only one type of nucleobases: cytosine (C), guanine (G), adenine (A) or thymine (T) can be inserted on unmasked spots. In all other spots on the microarray, which are masked, nucleobases are not inserted. These steps are repeated by using right masks in the right order until all probes are completed.
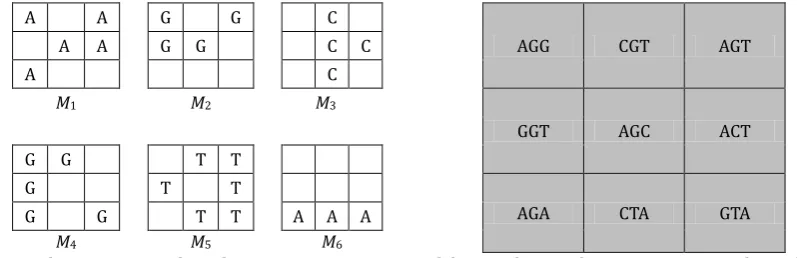
The total border length for microarray layout is defined with (1) as a sum of border lengths B1,…, BT, of all masks M1,…, MT. For one mask Mt border length can be calculating by using (2), where border(x, y) is equal to 1 if x and y are adjacent side by side or up and down, but not diagonally, and is equal to 0 otherwise. In the case of the microarray layout from Fig. 1, the border lengths for particular masks are: B1 = 9, B2 = 7, B3 = 7, B4 = 6, B5 = 8, B6 = 3, giving the total border length B = 34.
A A G G C
AGG CGT AGT A A G G C C
A C
M1 M2 M3
GGT AGC ACT G G T T
G T T
AGA CTA GTA G G T T A A A
M4 M5 M6
Fig. 1. The sequence of masks M1, M2, M3, …, M6 used for producing the microarray on the right.
Conflict index is a more general model which takes into account additional considerations about defects in microarray production. It is defined for spot u over all masks M1 to MT by (3), where masked(u, t) is equal to 1 if spot u is masked by Mt, and equal to 0 otherwise. Euclidian distance between spots x and y is denoted as d(x, y). Weighting function ω(x, t) assigns higher values to spots closer to the center of the microarray and lower values to sport closer to the edges [11]. The total conflict index C is a sum of conflict indexes for all spots of the microarray defined by (4).
The goal of the optimization problem is to find microarray layout that minimize total border length or total conflict index, depending on the chosen model. The both models can be coded in quadratic assignment problem.
T t tB
B
1 (1) ,border( , )
t t
t
x X y Y
B
x y
(2)
21 ( )
1 masked( , )
( )
masked( , )
( , )
( , )
T
t v N u
v t
C u
u t
z t
d u v
(3)
u
u
C
C
(
)
(4)3.
Ant Colony Optimization for Microarray Design Problem
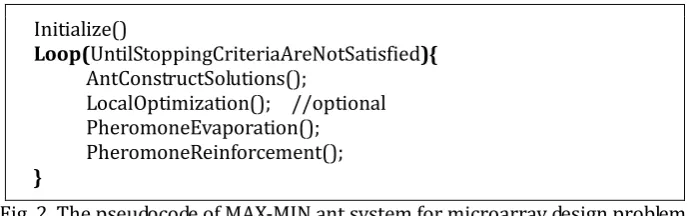
The ant colony optimization is an iterative constructive metaheuristic. In every iteration of the algorithm, m ants independently construct m different solutions. The solution is constructed by adding solution components to a partial solution until the complete solution is constructed. The choice of selecting particular component is affected by pheromone and heuristic values. After the end of each iteration, the pheromone values are updated based on the quality of constructed solutions.
presented in Fig. 2. Precise implementation of particular procedures also depends on type of the problem and design decisions made by a researcher.
Initialize()
Loop(UntilStoppingCriteriaAreNotSatisfied){ AntConstructSolutions();
LocalOptimization(); //optional PheromoneEvaporation(); PheromoneReinforcement(); }
Fig. 2. The pseudocode of MAX-MIN ant system for microarray design problem.
In procedure Initialize() algorithmic parameters are set, memory structures are prepared, pheromone and heuristic values are initialized. Both pheromone and heuristic values are usually organized in matrices, with each element linked to one particular solution component. For MMAS, which uses two pheromone bounds in the pheromone update procedure, the upper pheromone bound is set according to (5), where ρ is evaporation rate parameter and f(s*) is the fitness of the optimal solution. In practice the optimal solution is not known in advance, but estimation of the optimal solution obtained by a simple method can be used instead.
The lower pheromone bound is set to τmin = ϑ⋅τmax. An appropriate value for parameter ϑ ∈ 〈0, 1〉 can be
calculated by choosing probability pSH and using approximate expression given by (6). Alternativle, more precise formulas maight be used [12], [13]. In expression (6), |s| is the number of components in complete solution s, and navg is the average number of components that are considered in one step of solution construction procedure. The initial pheromone trail value is set equal to upper bound τmax. When local optimization is applied ϑ is usually set to 0.5 ⋅ |s|.
1max
(
*)
f
s
(5)
11
1
sSH avg
s
SH
n
p
p
(6)After the initialization is complited, inside the loop, the ant constract solutions, update pheromone trails and optionaly some demone actions like local optimization is performed, until stoping criteria is met (e.g. predefined number of iterations or maximum alowed time).
In AntConstructSolutions() procedure, m ants construct solutions independently. A solution is constructed by adding a component by a component into partial solution sP until the final solution s is constructed. At the beginning of construction, the partial solution sP is empty. The CP set contains all solution components that can be considered for adding to a partial solution sP. In the case of assigning probes to spots on a microarray, a solution component is one assignment of a particular probe to a particular spot. For microarray with n spots and n probes, there are n2 possible components.
In one step of AntConstructSolutions() procedure, one component is selected using random proportional rule defined by (7). The probability of adding the component cl into partial solution sP depends on the pheromone trail value τc(l) associated with that component, heuristic information for that component ηc(l), parameters α and β, and values associated with all other components that are currently in the set CP.
P Cc c c
l c i c P l
s
c
p
When choosing solution component, i.e. probe-spot assignment, first a free spot (or alternatively an unassigned probe) is chosen randomly, and then the assignment is based on random-proportional rule (7).
Performing local optimization is generally optional. By changing the part of solutions, e.g. by removing and adding some solution components, LocalOptimization() procedure is used to improve solutions constructed in AntConstructSolutions() procedure.
In PheromoneEvaporation() procedure all pheromone values are evaporated by multiplying with (1 − ρ) according to expression (8). In the case that some pheromone value τc becomes lesser than τmin, its value is set equal to τmin.
c
(
1
)
c,
c
C
(8)In PheromoneReinforcement() procedure it is necessary to choose a solution, according to some strategy, whose components will be rewarded with additional pheromone values. In the case of κ-best strategy the best solution found in last κ iterations is chosen. When max-κ-best strategy is used, then the best solution may be used at most κ iterations [13], [14]. Regardless of selected strategy, for each component c of chosen solution sbest the value of corresponding pheromone trail is increased according to expression (9). In the case that some pheromone value τc becomes larger than τmax, its value is set equal to τmax.
best
best cc
f
s
c
s
,
1
(9)4.
Experimental Settings and Results
Test instances of microarray layout problem, based on both border length and conflict index models, are publicly available on web page http://www.rahmannlab.de/research/microarray-design along with the best solutions that are known. The shorter names for the problem instances are used in this papers, but the original longer name can be uniquely identified by problem type and problem size. All instances are square-shaped so every solution has eight equivalent representations. There are four possible rotations and also for each rotation it is possible to make a mirror reflection of the solution.
Our implementation of MMAS with 2-opt local optimization and extended reinforcement strategy is done in C++ language. Experiments were conducted on Isabella cluster (isabella.srce.hr), running Linux on machines with various hardware. Local optimization was applied on all solutions constructed in AntConstructSolutions() procedure in the current iteration. For each solution, 2-exchange moves with first improvement were enforced until the solution become 2-optimal. In order to speed up local optimization, data structures with “don’t look bits” were used. Also, look up table with precomputed values of expression (7) were used to speedup solution constructions in AntConstructSolutions() procedure. Algorithmic parameters were set according to recommendations from literature and our own experience [13], [15]. Parameters were set to α = 1, β = 0, and number of ants m = 20. Few different values were tried for parameters ρ and κ (for max-κ-best strategy) in order to tune the algorithm for better performance.
For smaller problem instances (size n ≤ 81) parameter ρ was tested with values 0.01, 0.05, 0.2 and parameter κ with values 8, 32, ∞. For larger instances ρ = 0.01 and max-8-best were omitted.
The maximum number of iterations was set to 10000, except for instances mlpbl121, mlpci121, and mlpbl144 for which it was set to 20000. For each parameter setting experiment was repeated 40 times.
paper).
100
%
nbs
nbs
med
med
rel (10)The backgrounds of cells in Table 1 are colored according to their values for particular problem instance. The best results are colored with yellow, the worst with red and all the other with shades between yellow and red. For example, in the case of mlpbl64 the best result (medrel = 0.80%) obtained by max-∞–best and ρ = 0.01 is colored yellow and the worst result (medrel = 2.32%) obtained by max-8–best and ρ = 0.01 is colored red.
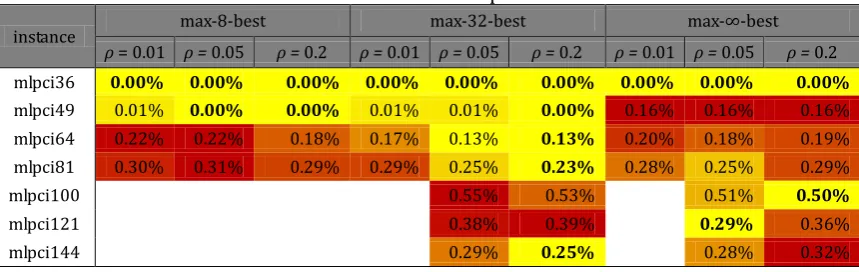
By the color distribution on Fig. 1, it can be observed that the smallest tested parameter values ρ and κ resulted with poorer algorithmic performance, but the best parameter settings depended on problem instance.
In the case conflict index instances, the best performance was observed with max-32-best and ρ = 0.2 for the most instances. For mlpci36 the median of solutions is equal to the new best solution published (nbs = 168611971).
Table 1. Median Solutions of MMAS with 2-opt for Border Length Instances
instance max-8-best max-32-best max-∞-best
ρ = 0.01 ρ = 0.05 ρ = 0.2 ρ = 0.01 ρ = 0.05 ρ = 0.2 ρ = 0.01 ρ = 0.05 ρ = 0.2 mlpbl36 1.21% 0.49% 0.12% 0.49% 0.49% 0.24% 0.61% 0.73% 0.61% mlpbl49 2.29% 2.20% 1.14% 2.11% 0.70% 0.79% 1.23% 1.23% 1.14% mlpbl64 2.32% 2.25% 1.79% 2.19% 1.53% 1.13% 0.80% 0.86% 0.83% mlpbl81 2.51% 2.41% 2.15% 2.46% 1.89% 1.57% 1.00% 1.00% 1.00%
mlpbl100 2.25% 1.87% 1.27% 1.23%
mlpbl121 3.13% 2.82% 2.27% 2.23%
mlpbl144 3.24% 2.96% 2.56% 2.40%
Table 2. Median Solutions of MMAS with 2-opt for Conflict Index Instances
instance max-8-best max-32-best max-∞-best
ρ = 0.01 ρ = 0.05 ρ = 0.2 ρ = 0.01 ρ = 0.05 ρ = 0.2 ρ = 0.01 ρ = 0.05 ρ = 0.2 mlpci36 0.00% 0.00% 0.00% 0.00% 0.00% 0.00% 0.00% 0.00% 0.00% mlpci49 0.01% 0.00% 0.00% 0.01% 0.01% 0.00% 0.16% 0.16% 0.16% mlpci64 0.22% 0.22% 0.18% 0.17% 0.13% 0.13% 0.20% 0.18% 0.19% mlpci81 0.30% 0.31% 0.29% 0.29% 0.25% 0.23% 0.28% 0.25% 0.29%
mlpci100 0.55% 0.53% 0.51% 0.50%
mlpci121 0.38% 0.39% 0.29% 0.36%
mlpci144 0.29% 0.25% 0.28% 0.32%
For instance mlpbl36, MMAS with 2-opt obtained solution equal to the best solution previously published. MMAS with 2-opt local optimization obtained solutions that are better than the best solutions that were published for three instances. In cases of the three largest instances, MMAS with 2-opt obtained better solutions than GRASP-PR, but worse than GATS.
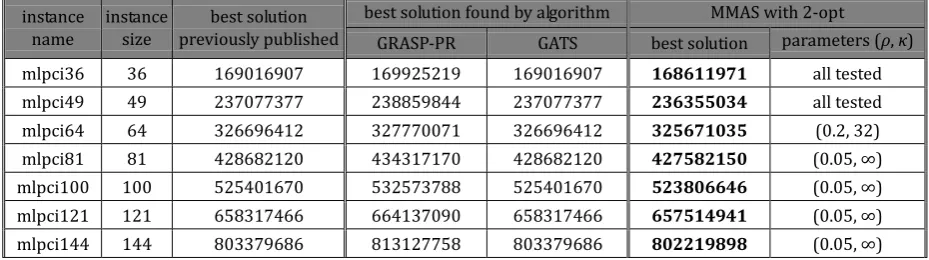
In the case of conflict index based instances of microarray layout problem, MMAS with 2-opt local optimization obtained the new best solutions for all available test instances.
Table 3. The Best Solutions Obtained for Instances Based on Border Length instance
name
instance size
best solution previously published
best solution found by algorithm MMAS with 2-opt RTL-1 RTL-2 GRASP-PR GATS best solution parameters (ρ, κ)
mlpbl36 36 3296 - 3304 3352 3296 3296
(0.01, 32), (0.01, ∞), (0.05, 8), (0.05, 32), (0.2, 8), (0.2, 32) mlpbl49 49 4564 4580 - 4660 4564 4548 (0.05, 32) mlpbl64 64 6048 6080 - 6200 6048 6032 (0.05, ∞) mlpbl81 81 7644 - - 7900 7644 7636 (0.01, ∞) mlpbl100 100 9432 - - 9684 9432 9440 (0.2, ∞) mlpbl121 121 11640 - - 12032 11640 11812 (0.2, ∞) mlpbl144 144 13832 - - 14196 13832 14060 (0.2, ∞)
Table 4. The Best Solutions Obtained for Instances Based on Conflict Index instance
name
instance size
best solution previously published
best solution found by algorithm MMAS with 2-opt
GRASP-PR GATS best solution parameters (ρ, κ) mlpci36 36 169016907 169925219 169016907 168611971 all tested mlpci49 49 237077377 238859844 237077377 236355034 all tested mlpci64 64 326696412 327770071 326696412 325671035 (0.2, 32) mlpci81 81 428682120 434317170 428682120 427582150 (0.05, ∞) mlpci100 100 525401670 532573788 525401670 523806646 (0.05, ∞) mlpci121 121 658317466 664137090 658317466 657514941 (0.05, ∞) mlpci144 144 803379686 813127758 803379686 802219898 (0.05, ∞)
5.
Conclusion
In this research, the MAX-MIN ant system was adopted for finding optimal designs of DNA microarrays. The basic ACO metaheuristic was enhanced with 2-opt local optimization to improve algorithmic performance. Limited parameter exploration revealed that the best performance for the instances based on border length is often achieved with rather greedy parameters, i.e. max-κ-best strategy and evaporation rate set to 0.2. In the case of the conflict index based instances, the best results are achieved with slightly less greedy parameter settings. For many problem instances, the proposed algorithm successfully obtained solutions that are better than the best solutions that were previously published.
References
[1] de Rinaldis, E., & Lahm, A. (2007). DNA Microarrays: Current Applications. Taylor & Francis.
[2] Dorigo, M., & t tzle, T. (2010). Ant colony optimization: Overview and recent advances. In M. Gendreau, & J.-Y. Potvin (Eds.), Handbook of Metaheuristics (pp. 227-263). Springer.
[4] Dorigo, M., Maniezzo, V., & Colorni, A. (1996). Ant system: Optimization by a colony of cooperating agents. IEEE Transactions on Systems, Man, and Cybernetics, Part B, 26, 29-41.
[5] Dorigo, M., & Gambardella, L. M. (1997). Ant colony system: A cooperative learning approach to the traveling salesman problem. IEEE Trans. Evolutionary Computation, 1, 53-66.
[6] Bullnheimer, B., Hartl, R. F., & Strauss, C. (1999). A new rank based version of the ant system: A computational Study. Central European Journal for Operations Research and Economics, 7, 25-38. [7] Maniezzo, V. (1999). Exact and approximate nondeterministic tree-search procedures for the quadratic
assignment problem. INFORMS J. on Computing, 11, 358-369.
[8] t tzle, T., & Hoos, H. H. (2000). MAX-MIN ant system. Future Generation Comp. Syst., 16, 889-914. [9] Cordón, O., Fernández de Viana, I., & Herrera, F. (2002). Analysis of the best-worst ant system and its
variants on the QAP. Proceedings of Third International Workshop. Brussel, Belgium.
[10]Ivkovic, N., & Golub, M. (2014). A new ant colony optimization algorithm: Three bound ant system. Proceedings of 9th International Conference on Swarm Intelligence. Brussels, Belgium.
[11]de Carvalho, S. A. Jr. (2007). Algorithms for Improving the Design and Production of Oligonucleotide Microarrays. PhD Dissertation, University of Bielefeld.
[12]Ivkovic, N., Golub, M., & Malekovic, M. (2011). A pheromone trails model for MAX-MIN ant system. Proceedings of 10th Biennal International Conference on Artificial Evolution. Angers, France.
[13]Ivkovic, N. (2014). Modeling, Analysis and Improvement of Ant Colony Optimization Algorithms. PhD Dissertation. University of Zagreb.
[14]Ivkovic, N., Malekovic, M., & Golub, M. (2011). Extended trail reinforcement strategies for ant colony optimization. Proceedings of Second International Conference on Swarm, Evolutionary, and Memetic Computing: Vol. 7076, Visakhapatnam, Andhra Pradesh, India.
[15]Dorigo, M., & Stützle, T. (2004). Ant Colony Optimization. MIT Press.
[16]de Carvalho, S. A. Jr., & Rahmann, S. (2006). Improving the layout of oligonucleotide microarrays: Pivot partitioning. Proceedings of 6th International Workshop on Algorithms in Bioinformatics, Zurich, Switzerland.
[17]de Carvalho, S. A. Jr., & Rahmann, S. (2006). Microarray layout as a quadratic assignment problem. I Proceedings of German Conference on Bioinformatics GCB 2006. Tübingen, Germany.
[18]de Carvalho, S. A. Jr., & Rahmann, S. (2006). Microarray layout and the quadratic assignment problem. Proceedings of 14th Annual International Conference on Intelligent Systems for Molecular Biology (ISMB). Fortaleza, Brazil.
[19]Hannenhalli, S., Hubbell, E., Lipshutz, R., & Pevzner, P. A. (2002). Combinatorial algorithms for design of DNA arrays. Advances in Biochemical Engineering/Biotechnology: Chip Technology, 77, 1-19.
Nikola Ivkovic received the MS degree in computer engineering and the Ph.D. degree in computer science from the Faculty of Electrical Engineering and Computing, University of Zagreb. He is a member of the research and teaching staff at the Department of Information Technologies and Computing of the Faculty of Organization and Informatics, University of Zagreb. His research interests include computational intelligence and optimization, parallel programming, formal methods, operating systems, and computer networks.
Electrical Engineering and Computing, University of Zagreb. His interests include parallel algorithms, operating systems, evolutionary algorithms and computer system security.