Mathematical Modeling and Analysis of a SPVT
Active Solar Still
Etkaf Hasan Khan Dr. Islam Nawaz
Research Scholar Professor
Department of Mechanical Engineering Department of Mechanical Engineering
Jamia Millia Islamia, India Jamia Millia Islamia, India
Dr. G. N. Tiwari Professor and Former Head Centre for Energy Studies, IIT Delhi, India
Abstract
In this paper mathematical modeling of a SPVT active solar still is done. The still chosen is a single basin single slope active solar still with hybrid solar panel for heating the water of still and producing power to run the DC motor to maintain the water flow. The Analysis is done taking in consideration the geographical location of a village. The village is Namauli situated in Gautam Budh Nagar, (U.P.), INDIA, (28 ̊ 32 ̍ N, 77 ̊ 23 ̍ E). The solar insolation and day time temperature are taken from the standard values provided on Government of India and other authentic websites. A Mathematical modeling of the chosen still is done using MATLAB with the help of the energy equations of Hybrid active solar still given by various researchers and scientists earlier. From there various parameters have been calculated along with the yield of the distill water on daily basis. The depth of the water and pump running time for the still has been varied and various results have been calculated.
Keywords: Active Still, Flat Plate collector, Mathematical Modeling, Solar still, Water
________________________________________________________________________________________________________
I. INTRODUCTION
Water is the essential among all the elements required for the survival of human beings. The Water available on earth is being polluted due to industries, agricultural chemicals and rapid rise in population in the past years. Less than 1/100th part of earth’s fresh water is available for human consumption. There is a forecasting theory that says that among the all humans alive in various lands of the earth the 2/3rdof them will face a scarcity of water by 2025.Distillation is a very effective process of cleaning impure and non-consumable water and Distillation with the help of solar energy is the best way among all the ways available to get pure water economically. It utilizes the very basic technology &least consumption of energy. This process can also be easily adapted in remote areas with much use of economy. The solar stills can be installed in any rural area easily without much efforts and huge money requirement. The fresh water output from a still can be utilized anywhere from the household activities to hospitals and battery water replacement to agricultural use along with various other applications.
A Swedish Engineer, Charles Wilson is the first man recorded who made the first solar still. Since then many scientists around the world has incorporated their useful efforts in the conventional as well as advanced still. There have been a lot of improvement has been done in the still design and its efficiency. Talbert et al. have given the best review of solar still systems. Classification of the solar stills can be done as:
Passive Still:
These types have a working in which, the water of the basin is heated by direct solar energy. Researchers have published lots of work in this field. It has been reported that passive stills are slow working devices and they produce a daily total output of 2.25 kg/m2day in summer. Detailed studies have showed that “among all positions of the angle of condensing cover, i.e. 15 degree, 30 degree and 45 degree; the maximum yearly fresh water output and efficiency are achieved at 15 degree angle” .
Active Still:
II. PROPOSED SETUP FOR COMPARISON
In This Article mathematical modeling of a single slope active solar still has been done in MATLAB and the results are compared with theoretical and experimental outputs. The setup has to be installed in the geographical location of Village of North India.
Active Single Slope Solar Still
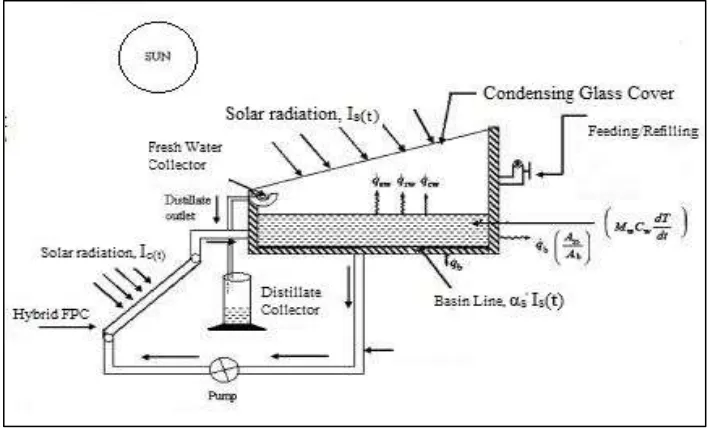
Active still gets additional heating by the flat plat collector. This additional energy increased the rate of evaporation of impure water of basin. The Active still setup consists of an extra photo voltaic integrated flat plat collector which heats the water of the still and produce electricity to run a DC motor to circulate the heated water from basin through the flat pate collector. The proposed setup is shown in the figure 1.
Fig. 1: active still with a flat-plate collector
The active still is attached with two flat plate collectors to the basin of the solar still by using insulated pipes. Each collector has an area of 2 m2. It is connected in series to the basin to heat the water in the still. A PV module of dimension 0.55m× 1.20 m of power rating 75 W is coupled to a collector at the bottom, where the low-temperature water is entering. The PV module runs a motor of DC supply.
Table – 1
Dimensions of the active still
Specification Dimensions
Area of basin 1 × 1 m2
Area of glass cover 1.16 × 1 m2
Glass cover thickness 0.004 m
Glass cover inclination 30 ̊
Top to ground height of basin 2.25 m
Basin bottom height from ground 1.65 m
Area of PV module 0.55 × 1.20 m2 (36 cells)
Diameter of the copper tubes 0.0127 m
Angle of FPC (horizontal) 45 ̊
Thickness of collector glass (toughen) 4 mm
Size of PV module 1.25 × 0.55 m2
Effective area of first collector under glass 1.34 m2 Effective area of first collector under PV module 0.66 m2 Effective area of second collector under glass 2.0 m2
A motor operated on DC power of rating 60 Wattage and 18 Volts is connected to maintain the flow of water via collector. The pump will run in between sunshine durations so that to prevent reverse heat flow during no sunshine.
Symbols used
NOMENCLATURE
Ab Area of solar still basin (m2)
Ass Side walls area of basin in contact with water (m2)
Ag,c area of collector glass (m2)
Ag,s area of solar still glass (m2)
dt small interval of time (s)
hcw convective heat transfer coefficient (W m-2 K-1) hew evaporative heat transfer coefficient (W m-1K-1) hrw Coefficient of radiation heat transfer (W m-2 K-1)
Im(t) Total intensity of sun falling on the glass covers of PV module (W m-2 ) Ic(t) Total intensity of sun falling on the glass covers of collector panel (W m-2 ) Is(t) total solar intensity on the glass cover of solar still (W m-2 )
m’ew hourly output (kg m -2 h-1)
Mew daily Output (kg m -2 day -1)
ηeth equivalent thermal efficiency of PV module
ηoth overall thermal efficiency
q’b heat transfer rate from basin liner ambient (W m -2)
q’u heat transfer rate from FPC to water (W)
q’w heat transfer rate from basin liner to water (W m -2) q’ cg rate of convective heat loss from glass cover to ambient (W m -2)
q’rg rate of radiative heat loss from glass cover to ambient (W m -2)
Ťa average ambient temperature ( ̊C)
Va wind velocity (m s -1)
Greek symbols
άb fraction of solar energy absorbed by basin liner άg fraction of solar energy absorbed by glass cover
άw fractional solar flux absorbed by water
εeff effective emissivity
Subscripts
b basin
c collector
s still
III. MODELING AND CALCULATION
Here we have calculated all the major parameters related to the Active still. The Computation has been done for different water depths of 0.05 m, 0.10m and 0.15 m for solar Radiation values of some days of September 2017 &April 2018 at the selected location. The following parameters were calculated considering the change in the Insolation values and ambient temperature on day to day basis for all water depth. The Computation has been done in MATLAB software using the various energy balance equations given by researchers.
Temperature of water for various depths (Tw);
Temperature of the inner glass (Tgi);
Temperature of the outer glass (Tgo);
Temperature of surroundings (Ta);
Pure water output (ṁew);
The surface and inside temperatures can be recorded with thermocouples thermometers having digital indicators attached to it. The Outside and ambient temperature can be measured with mercury thermometers. The output can be measured using measuring cylinders. The following values have been taken from the Data provided by standard website.
Solar still cover (Is(t)) and the collector (Ic(t)) radiation value;
Surrounding air velocity (Va):
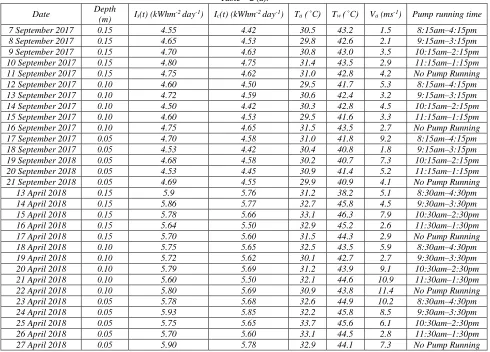
The Values have been calculated for some randomly selected dates of the month of April and September, the value of solar intensity for the months has been taken from the Indian Govt. website of Energy Alternatives India. Combined results are being shown below in the Table II. The Values for the active still were carried out as per the following pump running schedule in a day: 1) Case1: pump is working for 8 h;
2) Case 2: pump is working for 6 h; 3) Case 3: pump is working for 4 h; 4) Case 4: pump is working for 2 h; 5) Case 5: No Pump working;
Rate of Evaporation of Water
solar still from the water surface to the inner surface of condensing cover. It consists of radiation (q˙rw); convection (q˙cw) and
evaporation (q˙ew). Internal heat transfer is basically responsible for the production of pure water leaving the impurities in the basin.
Convective heat transfer occurs at the same time with evaporative heat transfer and these two are independent of radiative heat transfer.
The energy balance equation for water mass per unit basin area (Ab = 1 m2) in the hybrid-active solar still is given as
𝛼′𝑤𝐼
𝑠(𝑡) + 𝑞̇𝑤+ 𝑞̇𝑢= (𝑀𝐶)𝑤
𝑑𝑇𝑤
𝑑𝑡 + [𝑞̇𝑟,𝑤+ 𝑞̇𝑐,𝑤+ 𝑞̇𝑒,𝑤] ……… (1)
For passive solar still, 𝑞̇𝑢= 0
𝛼′𝑤𝐼𝑠(𝑡) + 𝑞̇𝑤= (𝑀𝐶)𝑤𝑑𝑇𝑤
𝑑𝑡 + [𝑞̇𝑟,𝑤+ 𝑞̇𝑐,𝑤+ 𝑞̇𝑒,𝑤] ………. (2)
Equation of energy balance for the cover of the glass As,
α′
gIs(t)Ag,s+ [q̇r,w+ q̇c,w+ q̇e,w] = [q̇r,g+ q̇c,g]Ag,s ……… (3) The equation of energy balance for basin liner is given as
𝛼′𝑏𝐼𝑠(𝑡) = 𝑞̇
𝑤+ 𝑞̇𝑏+ 𝑞̇𝑏 𝐴𝑠𝑠
𝐴𝑏 ……….(4)
The heat transfer rate by different ways inside the still is given by:
𝑞̇𝑟𝑤= ℎ𝑟𝑤(𝑇𝑤− 𝑇𝑔𝑖) ……… (4)
𝑞̇𝑐𝑤= ℎ𝑐𝑤(𝑇𝑤− 𝑇𝑔𝑖) ……… (5)
𝑞̇𝑒𝑤= ℎ𝑒𝑤(𝑇𝑤− 𝑇𝑔𝑖) ……… (6) and,
ℎ𝐼𝑤= ℎ𝑟𝑤+ ℎ𝑐𝑤+ ℎ𝑒𝑤 ……….. (7) Where, hIw is the overall coefficient for internal heat transfer, and
hrw= εeffσ((Tw+ 273)2 + (Tgi+ 273)2 ) × (Tw+ Tgi+ 546) ……….. (8)
Where
[εeff= 1
εw
+ 1
εg − 1]
−1
Table 2. (a) Combined data calculated by MATLAB for 2017 September& 2018 April for hybrid active still (b) Combined results of the still calculated by thesame data
Table – 2 (a).
Date Depth
(m) Is(t) (kWhm
-2 day-1) I
c(t) (kWhm-2 day-1) Ta ( ̊ C) Tw ( ̊ C) Va (ms-1) Pump running time
7 September 2017 0.15 4.55 4.42 30.5 43.2 1.5 8:15am–4:15pm
8 September 2017 0.15 4.65 4.53 29.8 42.6 2.1 9:15am–3:15pm
9 September 2017 0.15 4.70 4.63 30.8 43.0 3.5 10:15am–2:15pm
10 September 2017 0.15 4.80 4.75 31.4 43.5 2.9 11:15am–1:15pm
11 September 2017 0.15 4.75 4.62 31.0 42.8 4.2 No Pump Running
12 September 2017 0.10 4.60 4.50 29.5 41.7 5.3 8:15am–4:15pm
13 September 2017 0.10 4.72 4.59 30.6 42.4 3.2 9:15am–3:15pm
14 September 2017 0.10 4.50 4.42 30.3 42.8 4.5 10:15am–2:15pm
15 September 2017 0.10 4.60 4.53 29.5 41.6 3.3 11:15am–1:15pm
16 September 2017 0.10 4.75 4.65 31.5 43.5 2.7 No Pump Running
17 September 2017 0.05 4.70 4.58 31.0 41.8 9.2 8:15am–4:15pm
18 September 2017 0.05 4.53 4.42 30.4 40.8 1.8 9:15am–3:15pm
19 September 2018 0.05 4.68 4.58 30.2 40.7 7.3 10:15am–2:15pm
20 September 2018 0.05 4.53 4.45 30.9 41.4 5.2 11:15am–1:15pm
21 September 2018 0.05 4.69 4.55 29.9 40.9 4.1 No Pump Running
13 April 2018 0.15 5.9 5.76 31.2 38.2 5.1 8:30am–4:30pm
14 April 2018 0.15 5.86 5.77 32.7 45.8 4.5 9:30am–3:30pm
15 April 2018 0.15 5.78 5.66 33.1 46.3 7.9 10:30am–2:30pm
16 April 2018 0.15 5.64 5.50 32.9 45.2 2.6 11:30am–1:30pm
17 April 2018 0.15 5.70 5.60 31.5 44.3 2.9 No Pump Running
18 April 2018 0.10 5.75 5.65 32.5 43.5 5.9 8:30am–4:30pm
19 April 2018 0.10 5.72 5.62 30.1 42.7 2.7 9:30am–3:30pm
20 April 2018 0.10 5.79 5.69 31.2 43.9 9.1 10:30am–2:30pm
21 April 2018 0.10 5.60 5.50 32.1 44.6 10.9 11:30am–1:30pm
22 April 2018 0.10 5.80 5.69 30.9 43.8 11.4 No Pump Running
23 April 2018 0.05 5.78 5.68 32.6 44.9 10.2 8:30am–4:30pm
24 April 2018 0.05 5.93 5.85 32.2 45.8 8.5 9:30am–3:30pm
25 April 2018 0.05 5.75 5.65 33.7 45.6 6.1 10:30am–2:30pm
26 April 2018 0.05 5.70 5.60 33.1 44.5 2.8 11:30am–1:30pm
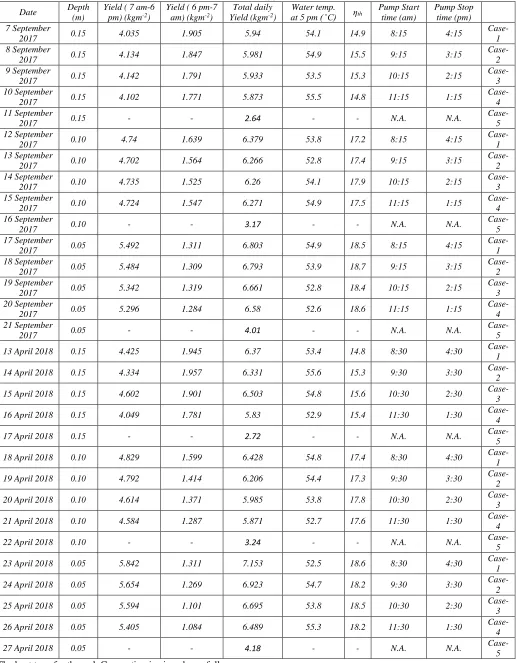
Table - 2(b).
Date Depth
(m)
Yield ( 7 am-6 pm) (kgm-2)
Yield ( 6 pm-7 am) (kgm-2)
Total daily Yield (kgm-2)
Water temp. at 5 pm ( ̊ C) ηth
Pump Start time (am)
Pump Stop time (pm) 7 September
2017 0.15 4.035 1.905 5.94 54.1 14.9 8:15 4:15
Case-1 8 September
2017 0.15 4.134 1.847 5.981 54.9 15.5 9:15 3:15
Case-2 9 September
2017 0.15 4.142 1.791 5.933 53.5 15.3 10:15 2:15
Case-3 10 September
2017 0.15 4.102 1.771 5.873 55.5 14.8 11:15 1:15
Case-4 11 September
2017 0.15 - - 2.64 - - N.A. N.A.
Case-5 12 September
2017 0.10 4.74 1.639 6.379 53.8 17.2 8:15 4:15
Case-1 13 September
2017 0.10 4.702 1.564 6.266 52.8 17.4 9:15 3:15
Case-2 14 September
2017 0.10 4.735 1.525 6.26 54.1 17.9 10:15 2:15
Case-3 15 September
2017 0.10 4.724 1.547 6.271 54.9 17.5 11:15 1:15
Case-4 16 September
2017 0.10 - - 3.17 - - N.A. N.A.
Case-5 17 September
2017 0.05 5.492 1.311 6.803 54.9 18.5 8:15 4:15
Case-1 18 September
2017 0.05 5.484 1.309 6.793 53.9 18.7 9:15 3:15
Case-2 19 September
2017 0.05 5.342 1.319 6.661 52.8 18.4 10:15 2:15
Case-3 20 September
2017 0.05 5.296 1.284 6.58 52.6 18.6 11:15 1:15
Case-4 21 September
2017 0.05 - - 4.01 - - N.A. N.A.
Case-5
13 April 2018 0.15 4.425 1.945 6.37 53.4 14.8 8:30 4:30
Case-1
14 April 2018 0.15 4.334 1.957 6.331 55.6 15.3 9:30 3:30
Case-2
15 April 2018 0.15 4.602 1.901 6.503 54.8 15.6 10:30 2:30
Case-3
16 April 2018 0.15 4.049 1.781 5.83 52.9 15.4 11:30 1:30
Case-4
17 April 2018 0.15 - - 2.72 - - N.A. N.A.
Case-5
18 April 2018 0.10 4.829 1.599 6.428 54.8 17.4 8:30 4:30
Case-1
19 April 2018 0.10 4.792 1.414 6.206 54.4 17.3 9:30 3:30
Case-2
20 April 2018 0.10 4.614 1.371 5.985 53.8 17.8 10:30 2:30
Case-3
21 April 2018 0.10 4.584 1.287 5.871 52.7 17.6 11:30 1:30
Case-4
22 April 2018 0.10 - - 3.24 - - N.A. N.A.
Case-5
23 April 2018 0.05 5.842 1.311 7.153 52.5 18.6 8:30 4:30
Case-1
24 April 2018 0.05 5.654 1.269 6.923 54.7 18.2 9:30 3:30
Case-2
25 April 2018 0.05 5.594 1.101 6.695 53.8 18.5 10:30 2:30
Case-3
26 April 2018 0.05 5.405 1.084 6.489 55.3 18.2 11:30 1:30
Case-4
27 April 2018 0.05 - - 4.18 - - N.A. N.A.
hcw= 0.844 [Tw− Tgi+
(Pw− Pgi)(Tw+ 273.15)
268900 − Pw
] 1/3
The coefficients of evaporation and convection heat transfer are related by [F]:
(hew) = 162.73 × 10⁻⁴hcw
(Pw− Pgi) (Tw− Tgi) The pure water generation rate = q’ew / L.
Therefore pure water output from 1 m2of basin area is equal to
ṁew= q′ew
L × 3600 =
hew(Tw− Tgi)
L × 3600
Above equation shows that higher temperature variation between water and inner glass surface will give higher output.
Pump Working Time Variation Effect:
Below three figures figure 4 a, b and c show the variation in output throughout the day for the assumed three cases of the pump working time of 10 h, 6 h and 2h respectively. It has been observed that for less pump running time the output during sunshine hours was reduced but the output during the off sunshine hour was increased. This effect was due to the increase in the water temperature because of the less reverse thermal losses which was occurring due to the pump running in less sunshine duration.
(a)
(c)
Fig. 4: Variation of output of fresh water on hour basis for different depths of impure water in the basin: (a) 0.05 meter; (b) 0.10 meter; and (c) 0.15 meter in hybrid active still for different working duration of the pump in April 2018.
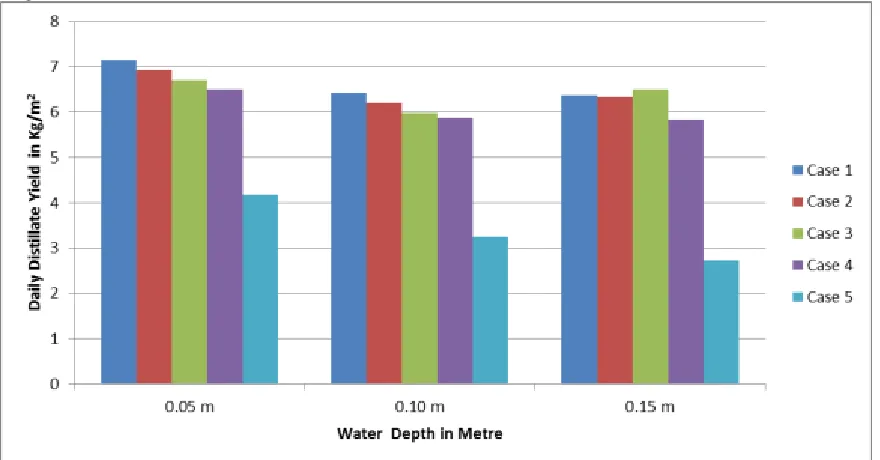
Figure 5 shows the variation on the daily output of fresh water at different water heights of impure water in the basin for various pump working durations.
Fig. 5: Effect of pump working duration on daily output of fresh water in the hybrid still for various depths, in the April 2018
IV. CONCLUSION
Following points can be concluded on the basis of the results obtained by the MATLAB calculations for Solar Hybrid still. The daily output of the fresh water from the still is around 2.5 higher than the yield when the pump was not working. As the depth of water decreases the net yield of fresh water increases.
The pump working duration if decreased for 4 to 5 hours during the sunshine hours then it hardly affects the daily yield of fresh water.
REFERENCES
[1] Kumar Shiv, and Tiwari Arvind, “INTERNATIONAL JOURNAL OF ENERGY RESEARCH” Int. J. Energy Res. 2008; 32:847–858 2 January 2008 in Wiley Inter Science DOI: 10.1002/er.1388
[2] Talbert SG, Eibling JA, Lof GOG “Manual on solar distillation saline water”, R&D Progress Report No. 546, US Department of the Interior, 1970. [3] Malik MAS, Tiwari GN, Kumar A, Sodha MS. “Solar Distillation” Pregamon Press: Oxford, U.K., 1982.
[4] Tiwari AK, Tiwari GN. “Annual performance analysis and thermal modeling of passive solar still or different inclina-tions of condensing cover”, International Journal of Energy Research 2007; 31:1358–1382.
[5] Tiwari GN, Dimri V, Singh U, Chel A, Sarkar B. “Comparative thermal performance evaluation of an active solar distillation”, International Journal of Energy Research 2007; DOI: 10.1002/er.1314.
[6] Delyannis E. “Historic back ground of desalination and renewable energies”, Solar Energy 2003; 75:357–366.
[7] Tiwari GN, Tiwari AK. “Solar Distillation Practice in Water Desalination Systems”, Anamaya Pub. Ltd.: New Delhi, India, 2007.
[8] Al-Hinai H, Al-Nassri MS, Jubran BA. “Effect of climatic, design and operational parameters on the yield of a simple solar still”, Energy Conversion and Management 2002; 43:1639–1650.
[9] Boukar M, Harmim A. “Effect of climatic conditions on the performance of a simple basin solar still: a comparative study”, Desalination 2001; 137:15–22. [10] Zaki GM, Dali T-EI, Shafiey H-EI. “Improved performance of solar stills, Solar Energy and the Arab World”, Proceedings of 1st Arab International Solar
Energy Conference, Kuwait, 1983; 331–335.