© 2016, IRJET | Impact Factor value: 4.45 | ISO 9001:2008 Certified Journal
| Page 1591
Design and Performance Evaluation of Basin Type Solar Distillation Unit
Chendake A. D
*., Patil S. B. Jadhav A. V, Kalake S. S.
Pad. Dr. D. Y. Patil CAET, Talsande, Kolhapur. 416112.
Abstract: Drinking water is still a big problem in most arid and remote areas. There is almost no water left on earth that is safe to drink without purification after 20-25 years from today. This is a seemingly bold statement, but it is unfortunately true. Only 1% of Earth's water is in a fresh, liquid state, and nearly all of this is polluted by both diseases and toxic chemicals. For this reason, purification of water supplies is extremely important.. The research work was undertaken to design and performance evaluation of basin type solar distillation unit at Department of Renewable Energy Sources, CAET, Talsande, Kolhapur. In this study, a basin type single slope active solar still was designed and fabricated, and a performance evaluation was carried out for different water depths 0.01 m and 0.015 m. The distillate output was 750 ml. The maximum thermal efficiency was 38.75 per cent.
Keywords: Solar distillation, thermal efficiency, distillate output
INTRODUCTION
© 2016, IRJET | Impact Factor value: 4.45 | ISO 9001:2008 Certified Journal
| Page 1592
MATERIAL AND METHODS Experimental Location:-
The experiment was conducted in Pad. Dr. D. Y. Patil collage of Agricultural Engineering and Technology, Talsande. In summer temperature is about 22-40ºC and in winter ranges from 12-30ºC. Daily average temperature is 23-30ºC.
Basin Type solar distillation
It consist of shallow, bracken basin of impure water covered with a sloping transparent roof solar radiation that passes through the transparent roof heats the water in blackened basin. Thus evaporating water which gets condensed on the cooler under side of the glass and gets collected as distillate attached to the glass.
Design of solar distillation unit:-
Fig.1: View of Solar Distillation Unit
The base of the solar still is made of G.I. box of dimension ( 2.4’ x 1.2’ x 6cm ). This box is embedded into another box of wood shown in figure 1. Here length L= 39cm, Breath B= 75cm, Height H= 18 cm. and at opposite side = 06 cm, Angle Θ =170. This also contains same box of thermocol inside it between the G.I box and wooden box.
© 2016, IRJET | Impact Factor value: 4.45 | ISO 9001:2008 Certified Journal
| Page 1593
Components of solar still:- Still Basin: -
It is the part of the system in which the water to be distilled is kept. It is therefore essential that it must absorb solar energy. Hence it is necessary that the material have high absorbivity or very less reflectivity and very less transmitivity. These are the criteria’s for selecting the basin materials. We have used blackened galvanised iron sheet having size 2.4’ x 1.2’ x 6 cm Box of G I.
Side
It generally provides rigidness to the still. But technically it provides thermal resistance to the heat transfer that takes place from the system to the surrounding. So it must be made from the material that is having low value of thermal conductivity and should be rigid enough to sustain its own weight and the weight of the top cover. The thickness of the side wall was 8 mm and thickness of insulation used i.e. thermocol was 15 mm.
Top
The passage from where irradiation occurs on the surface of the basin is top cover. We have used glass material for top cover having thickness of 3 mm.
Channel:-
The condensate that is formed slides over the inclined top cover and falls in the passage, this passage
which fetches out the pure water is called channel. The materials used was G.I. channel having size of 2.7’ X 0.6” cm.
Impure water inlet
Insulation (thermocol)
Side Wall
Stand
G.I. Channel
© 2016, IRJET | Impact Factor value: 4.45 | ISO 9001:2008 Certified Journal
| Page 1594
Fig. 2: Components of Basin type solar distillation unit
Chemical analysis:
Chemical analysis of impure and pure (distilled) water which were used for the study was carried out for
pH, electrical conductivity (EC), TDS (Mg2+, Ca2+,ions etc.)
Distillation Efficiency:
E =
Where,
Q = Daily output, lit/day G = Global radiation, MJ/m2
A = Area of basin, m2
Cost economics of Solar Still:
For the success of any new technology, it was essential to know whether the technology was economically viable or not. Therefore, an attempt was made for estimation of economic study of the Basin Type of Solar Distillation Unit.
Payback Period:
The payback period is the length of time from the beginning of the project until the net value of the incremental production stream reaches the total amount of the capital investment. It shows the length of time between cumulative net cash outflow recovered in the form of yearly net cash inflows.
Payback Period =
RESULTS AND DISCUSSION
Performance Evaluation:
© 2016, IRJET | Impact Factor value: 4.45 | ISO 9001:2008 Certified Journal
| Page 1595
Table 1: Measurement of temperature profile at 1cm depth
Sr. No.
Time Temperature
˚c
Relative Humidity %
Wind Velocity
Km/hr
Solar Radiation
(W/m2)
Inner Ambient Inner Ambient
1 9:00 23.9 18.6 40 40 15.7 25 2 10:00 38. 23 30 20 15.6 35 3 11:00 55.5 25.4 20 20 13.3 385 4 12:00 63.3 27.3 20 20 13.6 515 5 1:00 68 28.1 20 20 12.0 466 6 2:00 65.1 29.4 20 20 13.2 107 7 3:00 59.3 29.7 20 20 13.0 33 8 4:00 50.5 29.8 20 20 13.6 23 9 5:00 40.1 29.4 20 20 14.8 7
Observations:
1) Amount of impure water poured initially = 2.9litre
2) Amount of pure water obtained at the end of the exp. = 0.75litre
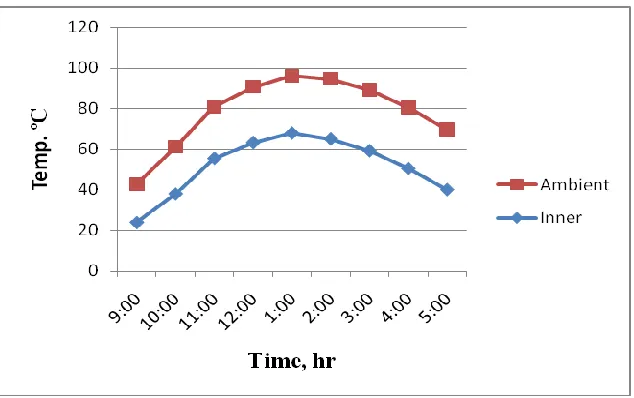
It was observed from Fig. 3 shows that as inside temperature increases, ambient temperature decreases and vice versa. It was also observed that the maximum temperature obtained at 1:00 p.m.
[image:5.612.149.466.489.688.2]© 2016, IRJET | Impact Factor value: 4.45 | ISO 9001:2008 Certified Journal
| Page 1596
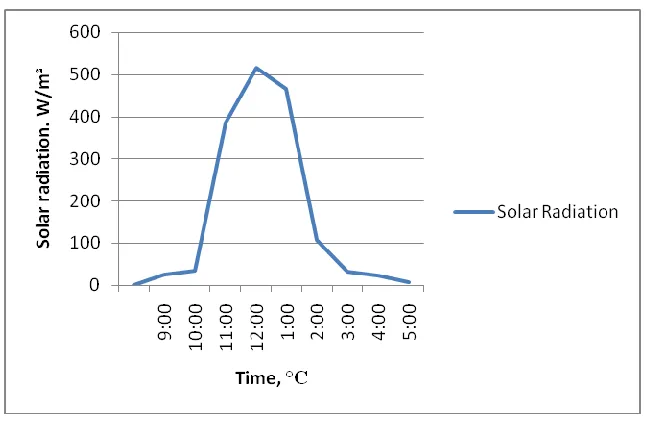
Fig. 4: Variation in Solar Radiation VS Time
Fig.4 Shows that maximum solar radiation obtained at 12.00 p.m and minimum solar radiation i.e. 7 W/m2
[image:6.612.28.535.417.666.2]obtained at 5 p.m.
Table 2 : Measurement of temperature profile at 1.5 cm depth
Sr. No. Time Temperature
˚c
Relative Humidity %
Wind Velocity
Km/hr
Solar Radiation
(W/m2)
Inner Ambient Inner Ambient
1 9:00 19.5 21.6 39 40 0 39
2 10:00 22.3 24.8 20 20 3.2 142 3 11:00 55 25.9 20 20 4.8 367 4 12:00 57.1 27.3 20 20 8 485 5 1:00 53.8 28.8 20 20 9.7 432 6 2:00 58 29.6 20 20 1.6 229
7 3:00 54.1 30 20 20 8 51
8 4:00 45.3 29.7 20 20 8 23
© 2016, IRJET | Impact Factor value: 4.45 | ISO 9001:2008 Certified Journal
| Page 1597
Observations:
1) Amount of impure water poured initially = 4.350 litre
[image:7.612.151.467.154.380.2]2) Amount of pure water obtained at the end of the exp. = 0.860 litre
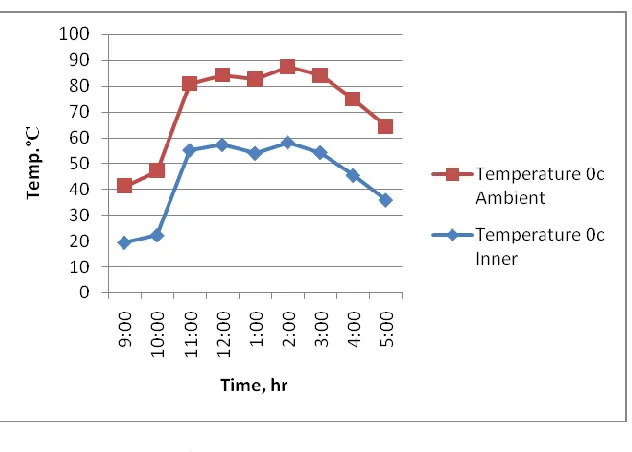
Fig. 5: Variation in Temp. VS Time
[image:7.612.145.466.439.659.2]It was observed from Fig.5 shows that as inside temperature increases, ambient temperature decreases and vice versa. It was also observed that the maximum temperature obtained at 12:00 p.m.
Fig. 6: Variation in Solar Radiation VS Time
© 2016, IRJET | Impact Factor value: 4.45 | ISO 9001:2008 Certified Journal
| Page 1598
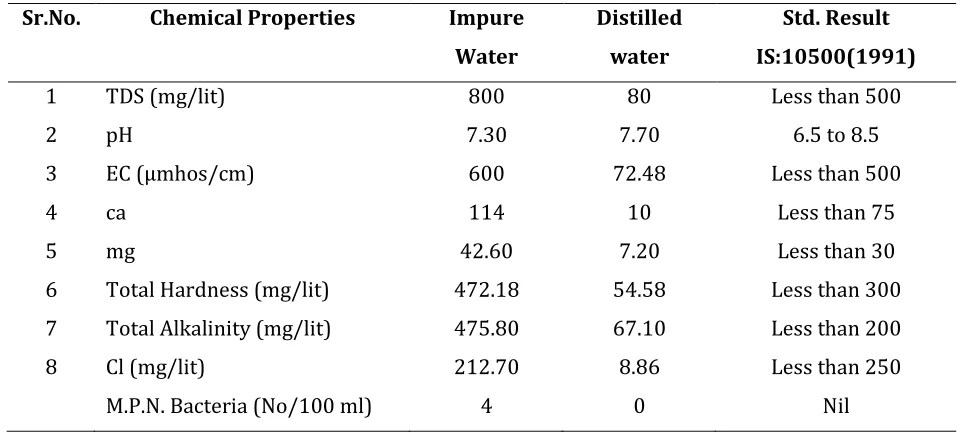
Table 3: Chemical analysis of impure and pure water samples
Sr.No. Chemical Properties Impure
Water
Distilled water
Std. Result IS:10500(1991)
1 TDS (mg/lit) 800 80 Less than 500
2 pH 7.30 7.70 6.5 to 8.5
3 EC (µmhos/cm) 600 72.48 Less than 500
4 ca 114 10 Less than 75
5 mg 42.60 7.20 Less than 30
6 Total Hardness (mg/lit) 472.18 54.58 Less than 300 7 Total Alkalinity (mg/lit) 475.80 67.10 Less than 200 8 Cl (mg/lit) 212.70 8.86 Less than 250
M.P.N. Bacteria (No/100 ml) 4 0 Nil
Chemical analysis of impure and pure (distilled) water which were used for study was carried out for pH, EC, TDS (Mg2+, Ca2+, etc.) depicted in Table 4.3. As can be observed from the table, chemical analysis of pure (distilled) and impure water had a reduction in the pH, EC and various ions like Mg2+, Ca2+,Cl-, Carbonate, Bicarbonate etc. in the pure water.
Distillation efficiency
Efficiency of Basin type solar distillation unit was observed as 38.75%.
E =
E =
E = 38.75%
Economic Analysis:
The economic study of Basin type solar distillation unit was calculated on the basis of simple techno economic analysis It was observed from the calculation the cost of the system is recovered within 3 months only, that is the payback period of the unit was only 0.3years.
Payback Period =
© 2016, IRJET | Impact Factor value: 4.45 | ISO 9001:2008 Certified Journal
| Page 1599
=Payback Period = 3 months
CONCLUSIONS
Maximum temperature obtained at 1:00 p.m when depth of water was 1cm at that time maximum solar radiation was 515 W/m2 at 12.00 p.m. The average yield of distilled water from Basin Type Solar Distillation unit
was 750 ml/day. The efficiency of the Basin Type Solar Distillation unit was observed to be 38.75%. The payback period for Basin Type solar distillation unit were observed to be 3 months.
REFERENCES
[1] Prof. Alpesh Mehta., ArjunVyas., NitinBodarDharmeshLathiy .(2011). Design of Solar Distillation System.
International Journal of Advanced Science and Technology Vol. 29, April 2011.
[2] Aqeel Y. Hashim. (2011). A new design of a single slop double- basin solar still(SSDBS).Journal of Basrah Researches ((Sciences)) Volume37.Number 2 .
[3] M.S.El-Sebaey, Sh. Shams El-Din, M. Habib and A. El-Hanafy (2013). An Experimental Study on a New Design of Double Slope Solar Still with External Flatted and Internal Parabolic Reflectors .IOSR Journal of Mechanical and Civil Engineering Volume9, Issue 6 (Nov. - Dec. 2013), PP 40-54.
[4] Paul LaViolette. (2005). Construction and testing of a high efficiency solar water still. Energy innovations small grant (eisg) program eisg final report.
[5] S. Shanmugan (2014) Experimental analysis of a single slope single basin solar still with hot water provision.
International Journal of Applied and Natural Sciences (IJANS) ISSN(P): 2319-4014; ISSN(E): 2319-4022 Vol. 3, Issue 1, Jan 2014, 19-24.