R E S E A R C H
Open Access
Methodological basics and evolution of the
Belgian health interview survey 1997
–
2008
Stefaan Demarest
*, Johan Van der Heyden, Rana Charafeddine, Sabine Drieskens, Lydia Gisle and Jean Tafforeau
Abstract
Background:The Belgian Health Interview Survey (BHIS) is organised every 4 to 5 years and collects health information from around 10,000 individuals in a face-to-face setting. This manuscript describes the methodological choices made in the sampling design, the outcomes of the previous surveys in terms of participation rates and achieved targets and the factors to be accounted for in data-analysis.
Methods:The BHIS targets all persons residing in Belgium with no restrictions on age or nationality. Trimestral copies of the National Population Registry are used as the sampling frame. To select the respondents, a multistage sampling design is applied involving a geographical stratification, a selection of clusters, a selection of households within each cluster and a selection of respondents within each household. Using matched substitution of
non-participating households assures the realisation of the predefined net-sample.
Results:For each BHIS the required number of participants is achieved, including the years when an oversampling of provinces and of the elderly occurred. The sampling design guarantees that the survey is implemented in large cities as well as in small municipalities. A growing problem is related to the sampling frame: it is increasingly subject of deterioration, especially in the Brussels-Capital Region.
Conclusions:The methodological approach developed for the first BHIS proves to be accurate and was kept nearly unchanged throughout the following surveys. Fieldwork substitution contributes to a considerable extent to the success of the fieldwork but yields in higher percentages of non-participation. The sampling design requires special attention when analysing the data: the unequal selection probability, e.g. due to the non-proportional stratification at the regional level, necessitates the use of weights. The BHIS is progressively embedded in the European Health Survey, a process that doesn’t jeopardise the comparability of the Belgian results throughout time.
Keywords:Health interview survey, Survey-methodology, Fieldwork substitution
Background
The Belgian Health Interview Survey (BHIS) is currently established as the leading health survey in the country with every 4 to 5 years around 10,000 surveyed individuals in some 6,000 households. The survey is carried out by the Operational Direction Public Health and Surveillance of the Scientific Institute of Public Health (WIV-ISP) which provides scientific support for a proactive health policy at the Belgian, European and international levels. The BHIS commenced in 1997 and was re-organised in 2001, 2004 and 2008. The fieldwork of the latest survey started in January 2013. The BHIS is commissioned by all ministers
responsible for public health at the federal, regional and community levels.
The purpose of the BHIS is to monitor the health status of the general population as well as health determinants in-cluding health behaviours, medical care consumption and social and demographic characteristics [1,2]. The repeated cross-sectional design of the BHIS enables the assessment of health trends and provides evidence for the evaluation of health policy. Throughout the survey years, the content of the survey is increasingly embedded in the approach of the European Health Interview Survey (EHIS). Actually, in the BHIS 2008 several modules of EHIS were already implemented [3].
Data collection is undertaken using face-to-face inter-views at the participant’s home. This approach is chosen as * Correspondence:[email protected]
Scientific Institute of Public Health, Operational Direction Public Health and Surveillance, Unit Surveys, Lifestyle and Chronic Conditions, Brussels, Belgium
it has shown important advantages in comparison with e.g. a mail survey approach (higher response rates) or inter-views by telephone (better representativity) [4]. From 1997 to 2008, data were collected using Paper and Pencil Inter-viewing (PAPI). The interviews are supplemented with a self-administered questionnaire (for the participants aged 15+) covering more sensitive topics like mental health, use of illicit drugs and sexual behaviour.
The analysis and interpretation of the BHIS data re-quire a profound knowledge of the sampling and selec-tion procedures used in the survey and an awareness of the changes that took place throughout the successive surveys. These procedures should guarantee that the re-sults of the BHIS are sufficiently precise and unbiased while taking into account the practical feasibility of the survey given the available resources.
This manuscript describes the methodological choices in the sampling design and in the strategy to select households in the BHIS, the methodological changes since the first survey in 1997, and the outcomes of the previous surveys in terms of participation rates and achieved targets. The manuscript also reflects on how these methodological issues should be considered in the data-analysis.
Methods
Target population
The target population of the BHIS consists of all persons with residence in Belgium, including the institutionalised elderly, with no restrictions on age or nationality. The National Population Registry (NPR) is used as the sam-pling frame. This registry contains information on gen-der, age, address, citizenship, marital status, etc. of each individual. It is continuously updated based on the infor-mation provided by the municipality officials. Indeed, each birth, death and change of address in Belgium has to be declared to the municipality officials. Although the NPR is the most complete and updated population regis-try in Belgium, using it as a sampling frame implies that those not officially registered (homeless people, unoffi-cial refugees and all those living with them) are excluded from participation in the BHIS. No absolute figures exist on the not officially registered persons in Belgium.
Recent estimations suggest that around 100,000 people are not registered, especially in big cities like Brussels, Antwerp and Gent. A special case concerns the institu-tionalized people; in the NPR it is mentioned whether someone is institutionalised or not, without defining the kind of institution. Such institution could be a home for the elderly, a convent, a psychiatric institution, a
prison…For operational reasons, prisoners and persons
living in large convents or in a psychiatric institution are excluded from the survey since this would require a very specific contact procedure (including a permission of
organisations’ hierarchy) and adapted interview skills. e People institutionalised in a home for the elderly are in-cluded in the survey, given the specific attention of the Commissioners for the health of the elderly population. Therefore all institutionalised people are included in the sampling frame, but their eligibility to participate in the survey is assessed post hoc during the data-collection phase, that is; when the interviewer tries to contact them. In case it turns out that the sampled person lives in a prison, large convent of psychiatric institution, he/she is considered as non-eligible [5].
Sampling scheme
The BHIS is a cross-sectional household interview survey. Respondents in the BHIS are selected according to a multi-stage sampling design, involving a geographical stratifica-tion, a selection of clusters within each stratum (primary sampling units), a selection of households within each clus-ter (secondary sampling units) and a selection of individ-uals within each household (tertiary sampling units). A summary of the sampling scheme applied in the BHIS is presented in Table 1. Belgium consists of three regions: the Flemish Region (around 6.1 million inhabitants), the Walloon Region (3.4 million) and the Brussels-Capital Re-gion (1 million). To obtain accurate estimates for the three regions and, consequently, for the whole country a regional stratification scheme was applied [6], with a sample size of 3,500 interviews in both the Flemish and the Walloon Re-gion and 3,000 in the Brussels-Capital ReRe-gion. As a conse-quence, the total basic sample size of the BHIS is set to 10,000 individuals. Within both the Flemish and the Walloon Region, a second stratification is applied at the level of the provinces. The Flemish Region comprises the provinces of Antwerp, Limburg, Flemish Brabant, East Flanders and West Flanders. The Walloon Region is composed of Hainaut, Walloon Brabant, Namur, Liège and Luxembourg. The province of Liège covers a small German Community (around 70,000 inhabitants) which is considered as a separate stratum. The Brussels-Capital Re-gion is not subdivided into provinces. The number of inter-views to be realised in every province is proportional to the population size of each province within the region. In the German Community, however, the number of interviews is fixed to 300, as decided upon by the commissioners of the survey. Consequently, the number of interviews to be realised in the other parts of the province of Liège is de-creased with this number. As a result, the total number of strata to be considered is 12: the Brussels-Capital Region, the German Community, Liège without the German Com-munity and the 9 other provinces.
decided to apply a clustered selection procedure where groups of 50 individuals to be interviewed throughout the year of data-collection are selected from a limited number of municipalities in every stratum. In addition to the practical consideration of the cost reduction, the decision to work with groups of 50 individuals is also based on methodological considerations: this number is judged as the best trade-off that allows to ensure feasi-bility and a low interviewer-bias.
The selection of the groups and the municipalities is based on a method that combines probability proportional to size (PPS) sampling and systematic sampling. First the number of interviews to be realised in every province is di-vided by 50 to define the number of groups. The next step involves the ranking of all municipalities according to their population size in every province. A stepwise selection of municipalities is applied using the total population in every province divided by the number of groups as a step size. By doing so, big cities as well as small municipalities can be selected for the survey. In some large cities several groups can be selected.
Given the dynamic nature of the NPR, the data-collection phase is split in four quarters and the quarterly samples do not involve replacement. As a consequence, the number of people to be sampled each quarter per group was (on average) 12.5 individuals. Within each group, households were selected via a systematic sampling
procedure: the population registers of the selected munici-palities were ordered in terms of statistical sectors (wards), size of the households (1, 2, 3, 4, 4+ members) and the age of the reference person of the household (it is the adminis-trative contact point of a household). The number of households to be selected is determined by dividing 12.5 by the mean household-size in every selected municipality. The total number of households of a selected municipal-ity, divided by the number of households to be selected for the survey in this municipality, provides the selection step.
The last step in the selection process is to identify the members of the households that will be invited to par-ticipate. To avoid intra-household correlation and to limit the burden for the households, maximum four household members are selected to participate in the survey. In households with more than 4 members, the reference person and his/her partner are always selected together with two or three other members of the house-hold who have their birthday coming up first after the interview.
An important goal of the BHIS is the assessment of time trends. Therefore no important methodological changes have been introduced since the first survey.
However, two refinements in the survey methodology were applied after 1997: the possibility of oversampling of specific population groups and the geographical division Table 1 Overview of the sampling scheme of the Belgian health interview survey
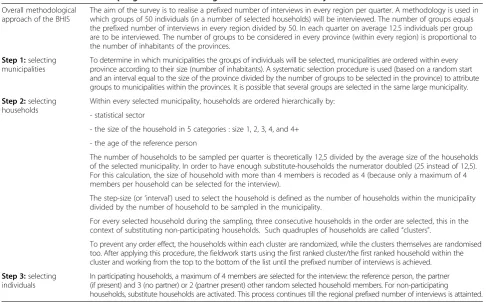
Overall methodological approach of the BHIS
The aim of the survey is to realise a prefixed number of interviews in every region per quarter. A methodology is used in which groups of 50 individuals (in a number of selected households) will be interviewed. The number of groups equals the prefixed number of interviews in every region divided by 50. In each quarter on average 12.5 individuals per group are to be interviewed. The number of groups to be considered in every province (within every region) is proportional to the number of inhabitants of the provinces.
Step 1:selecting municipalities
To determine in which municipalities the groups of individuals will be selected, municipalities are ordered within every province according to their size (number of inhabitants). A systematic selection procedure is used (based on a random start and an interval equal to the size of the province divided by the number of groups to be selected in the province) to attribute groups to municipalities within the provinces. It is possible that several groups are selected in the same large municipality.
Step 2:selecting households
Within every selected municipality, households are ordered hierarchically by:
- statistical sector
- the size of the household in 5 categories : size 1, 2, 3, 4, and 4+
- the age of the reference person
The number of households to be sampled per quarter is theoretically 12,5 divided by the average size of the households of the selected municipality. In order to have enough substitute-households the numerator doubled (25 instead of 12,5). For this calculation, the size of household with more than 4 members is recoded as 4 (because only a maximum of 4 members per household can be selected for the interview).
The step-size (or‘interval’) used to select the household is defined as the number of households within the municipality divided by the number of household to be sampled in the municipality.
For every selected household during the sampling, three consecutive households in the order are selected, this in the context of substituting non-participating households. Such quadruples of households are called“clusters”.
To prevent any order effect, the households within each cluster are randomized, while the clusters themselves are randomised too. After applying this procedure, the fieldwork starts using the first ranked cluster/the first ranked household within the cluster and working from the top to the bottom of the list until the prefixed number of interviews is achieved.
Step 3:selecting individuals
In participating households, a maximum of 4 members are selected for the interview: the reference person, the partner (if present) and 3 (no partner) or 2 (partner present) other random selected household members. For non-participating
of municipalities with more than one selected group. These changes have no impact on the main methodo-logical approach of the survey. Based on the request of the commissioners, a provincial oversampling was initiated in 2001 to offer provincial health authorities the opportunity to obtain more precise results for their province. The oversampling is subject to payment and the implementa-tion is straightforward. All provinces are informed on the number of sample units they are entitled to according to their population size in the framework of the basic sample. Provinces are then asked if they are interested to inflate their sample size with additional (groups of 50) individ-uals. These extra numbers are taken into consideration when selecting the groups and municipalities.
Since 2004, and this specifically based on the demand of the Ministry of Social Affairs, the option is also of-fered to perform an oversampling of specific population groups, particularly the elderly. The operationalisation of this oversampling is more challenging because the sam-pling approach needs to yield a predefined number of extra elderly while respecting the general principles of the sampling design. This has been resolved through the stratification of the sampling frame in the selected muni-cipalities according to the age of the reference person, and a calculation of the number of households to be sampled in each age stratum, taking into account the es-timated age distribution of the household members in the stratum.
In BHIS 1997 and 2001, groups selected from one large municipality, could belong to different statistical sectors. Interviewers were required to contact house-holds throughout the whole territory of the municipality which resulted in supplementary costs. Therefore from 2004 onwards, large municipalities (with several groups) are divided in as many geographical areas as there are groups, ensuring that the population size in each area is more or less equal. In each geographical area, opera-tionalized as a number of adjacent statistical sectors, 50 persons are interviewed. This avoids that an interviewer in charge of one group has to carry out interviews scattered all over the municipality.
Given that the BHIS is not a compulsory survey, it is confronted with non-participation of households, which could be non-contactable households or refusals to par-ticipate. To ensure that the predetermined number of interviews is realised in due time, one option would be to increase the sample size based on an assessment of the non-response rate in the country. Yet, when the first edition of the BHIS was carried out in 1997, there was an uncertainty as to the response rate in this survey. Therefore, a decision was reached to apply matched sub-stitution, where for every selected household 3 consecu-tive households in the ranked list of households used during systematic sampling were selected as
substitute-households. The selected household, together with its substitutes is called a cluster. Given the criteria used to rank the households in every municipality, the initial se-lected household and its substitutes are alike in terms of statistical sector, size of the household and age-group of the reference person. This approach was implemented in the first BHIS and all the subsequent surveys.
The number of clusters is exactly the same as the number of households initially selected for participation. If the first household in the cluster turns out to be a non-participating household, the next household in the cluster will be contacted, in case the second household is a non-participating household, the third household is contacted and so on, until the cluster is exhausted. To ensure that the predetermined number of interviews for every group could be achieved, it was decided to double the number of clusters in every group. This was done by dividing the step size calculated for the systematic sam-pling of the households by two. In case a cluster is exhausted (all households of the cluster turned out to be non-participants), a substitute cluster is activated and the first household of a new cluster is contacted. Con-trary to the households belonging to the first cluster, the households belonging to the substitute clusters are not matched to the initial clusters. In other words, the initial and substitute clusters do not show common character-istics concerning the age of the reference person, the size of the household or the statistical sector.
Results and discussion
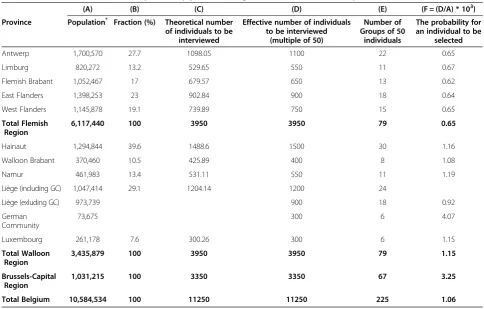
Using the BHIS 2008 as an example, an overview of the distribution of the sample size by province is presented in Table 2. In 2008 a boost of the elderly population of in total 1,250 persons was added to the basic sample, yet this did not alter the basic sampling approach; it just in-creased the number of groups to be selected. In both the Flemish and the Walloon regions 3,950 interviews, and in the Brussels-Capital Region 3,350 interviews had to be realised. As a consequence, the selection probability differs by region; the relative probability to be selected in the Flemish Region is 0,65, in the Walloon Region it is 1.06 and in the (smallest) Brussels Region it is 3.25. Also differences in provincial sizes resulted in unequal selection probabilities. The oversampling of the German Community, part of the province of Liège, resulted in a low selection probability for the rest of this province. The unequal selection probability affects the representa-tivity of the results, but this is corrected during the estimation process by using sampling weights equal to the inverse of the sampling probability, based on the (known) size of each province-age-household size stratum [7].
the oversampling requested by some partners. In the BHIS2001 four of the ten provinces (two in the Walloon region and two in the Flemish region) made use of this possibility. In the BHIS2004 only two provinces financed an oversampling and in the BHIS2008 there were no candidates for oversampling.
In addition, an oversampling of the elderly population was done in the BHIS2004 (for the population of 65 years and older) and in the BHIS 2008 (for the population of 75 years and older). The aim of this oversampling was to obtain more precise estimates for the older population in view of the aging of the population. Specific attention was paid to the age group of 85 years and older. Targets were defined by age group. Both the oversampling at provincial level and the oversampling of older people did not affect the representativeness of the results of the BHIS, as post stratification weights are used to calculate regional and national estimates.
In Figure 1 the geographical dispersion of the munici-palities for the BHIS 2008 is presented. All major Belgian cities, but also a number of small municipalities are represented in the sample. In the Brussels Region, all municipalities were selected due to the relative high number of interviews to be obtained in this region. The figure shows also in which municipalities several groups
were selected. In these municipalities the statistical sec-tors were regrouped in geographical areas consisting of a number of adjacent statistical sectors.
The target of the BHIS is defined in terms of a net-sample: the aim is to interview 10,000 individuals Table 2 The distribution of the sample size by province, Belgian health interview survey 2008
(A) (B) (C) (D) (E) (F = (D/A) * 103)
Province Population* Fraction (%) Theoretical number of individuals to be
interviewed
Effective number of individuals to be interviewed
(multiple of 50)
Number of Groups of 50
individuals
The probability for an individual to be
selected
Antwerp 1,700,570 27.7 1098.05 1100 22 0.65
Limburg 820,272 13.2 529.65 550 11 0.67
Flemish Brabant 1,052,467 17 679.57 650 13 0.62
East Flanders 1,398,253 23 902.84 900 18 0.64
West Flanders 1,145,878 19.1 739.89 750 15 0.65
Total Flemish Region
6,117,440 100 3950 3950 79 0.65
Hainaut 1,294,844 39.6 1488.6 1500 30 1.16
Walloon Brabant 370,460 10.5 425.89 400 8 1.08
Namur 461,983 13.4 531.11 550 11 1.19
Liège (including GC) 1,047,414 29.1 1204.14 1200 24
Liège (exluding GC) 973,739 900 18 0.92
German Community
73,675 300 6 4.07
Luxembourg 261,178 7.6 300.26 300 6 1.15
Total Walloon Region
3,435,879 100 3950 3950 79 1.15
Brussels-Capital Region
1,031,215 100 3350 3350 67 3.25
Total Belgium 10,584,534 100 11250 11250 225 1.06
(C) = (3950 * (B))/100 within the Flemish region; (C) = (3950* (B))/100 within the Walloon Region. Source: Statistics Belgium (population 01.01.2007).
Table 3 Overview of the sample size of the Belgian health interview surveys1997-2008
Year 1997 2001 2004 2008
Basic sample 10,000 10,000 10,000 10,000
Provincial oversampling
Antwerp 350
Hainaut 500
Limburg 200 450
Luxembourg 1,000 897
Oversampling elderly
65-85 years 550
74-85 years 400
85 years + 700 850
Total
Planned interviews 10,000 12,050 12,597 11,250
(eventually supplemented with boosts of specific sub-populations). Matched substitution is used as a mean to account for non-participation. In Table 4, an overview is presented of the evolution of the participation pattern at the household level throughout the different surveys. In the BHIS 2008, 14,438 households had to be activated to achieve 11,254 individual interviews. Based on the infor-mation provided by the interviewers, it was found that for 0.7% of these activated households, the address did not exist, and for 16.1% the household selected for par-ticipation did not live (anymore) on the address provided to the interviewers (or a change of address has oc-curred). In addition, 10% of the households could not be contacted, despite several documented efforts of the in-terviewers. More than 30% of the households refused to participate, while 40.2% did agree to participate. The figures for the BHIS2008 can be compared with the ones for the BHIS2004 since both included a boost of the elderly populations. While the percentages for non-contactable and refusing households remained stable over both years, the percentage of participating house-holds declined. The steep increase of the number of households that didn’t live (anymore) at the address in the BHIS2008 was mainly due to the delay in the data-collection in the Brussels-Capital Region due to a high drop out of interviewers in the region. This resulted in a deterioration of the sampling frame.
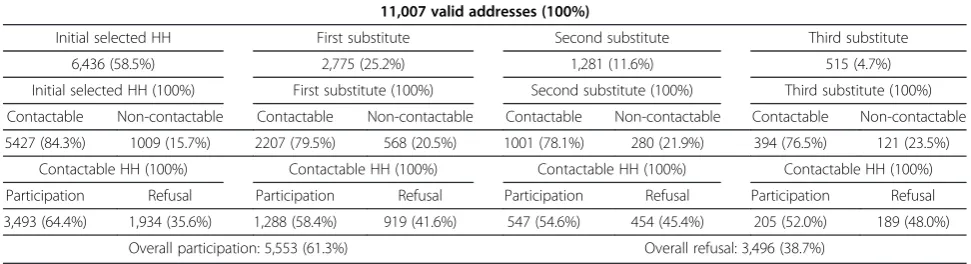
To assess the impact of the substitution procedure, fieldwork data of the BHIS 2001, for which an thorough analysis of the participation pattern was done, are presented in Table 4 [8]. All households with correct addresses are subdivided in 4 groups: initially selected households, first, second and third substitutes. Table 5 lists for each group the percentage of contactable ver-sus non-contactable households and, among the con-tactable households the percentage participating versus refusing households. The percentage of households la-belled as‘non-contactable’grows from 15.7% in initially selected households to 23.5% in the group of third sub-stitutes. Partially this can be due to decreasing efforts of the interviewers to contact already the fourth house-hold to obtain participation. The figures also show a decline in the participation rate; 64.4% of the initial household for which a contact could be obtained, agrees to participate against only half of the contacted third substitutes.
Statistical methods for estimating population parameters are based on the assumption that the observations were selected independently and that each observation has the same selection probability. The BHIS approach, in which a stratified clustered sampling procedure is applied, deviates from this assumption: the selected households are clus-tered geographically (limited number of selected muni-cipalities), and within a participating household only a
sub-sample is taken (maximal 4 household members are selected to participate in the survey). Additionally, regional stratification contributes even further to the unequal selection probabilities. Analysing BHIS data has to account for these design effects. Weighting fac-tors are calculated that reflects the differential selection probability, corrects for differential response rates and adjusts the (demographic) sample distribution by using known population distributions. Consequently, the weight for each sampled individual in the BHIS is the product of the reciprocal of the selection probability within a household) and of a post stratification factor for each province according to age, gender, household size and quarter of the year in which the interview was done.
Table 6 presents the BHIS2008 results for the indicator ‘subjective health’ with and without taking the design effects into account. Point estimates and standard errors are to a considerable extent influenced by the design effect: the global absolute difference between the esti-mate without taking the design effect into account and the one calculated after taking the weights, clustering and stratification into account is not less than 3.17%. At the same time, the standard error increases in relative terms with 42%. Therefore an analysis ignoring the design effect would yield biased point estimates that
cannot be considered representative for the survey population. Yet, the impact of both stratification and clustering has shown to be quite minimal. This is mainly due to the fact the number of clusters (=households) is big and the number of units (=individuals) within a clus-ter (=household) is limited (maximum 4).
Conclusions
Compared with most other European countries, Belgium has a relatively short history of organising health surveys. The organisation of four BHIS so far, shows that the meth-odological approach developed in the years preceding the first survey is quite successful. For every survey year, the net-sample at the regional level and consequently at the country level has been obtained. So far, there is no need to adapt fundamentally the methodology applied in the sur-vey. Some minor changes smoothed the data-collection, although some methodological issues remain points of discussion.
From the 2001 survey onwards, prior to the sampling procedure, municipalities for which several groups had to be selected were subdivided in several geographical homogeneous units according to the number of groups. By doing so, the travel time and travel costs for inter-viewers were set to a minimum. Unfortunately, this ap-proach is only applicable in case several groups are Table 4 Participation at household (HH) level, Belgian health interview survey 1997 - 2008
1997 2001 2004 2008
Abs. % Abs. % Abs. % Abs. %
Non-existing address *** *** 25 0.2 31 0.2 93 0.7
HH doesn’t live at address *** *** 232 2.1 983 7.5 2,328 16.1
Non-contable HH 3,601 31.2 1,978 17.6 1,445 11 1,462 10.1
Refusing HH 3,303 28.6 3,496 31.1 4,107 31.4 4,746 32.9
Participating HH 4,664 31.2 5,533 49 6,530 49.9 5,809 40.2
Invited HH 11,568 100 11,264 100 13,096 100 14,438 100
*** For the BHIS1997, it was not possible to distinguish on-participation due to a non-existing address nor to the fact that the household didn’t live at the indicated address. Such cases were included in the category’non-contactable households’.
Table 5 Overview of the participation status of household selected for participation, Belgian health interview survey 2001
11,007 valid addresses (100%)
Initial selected HH First substitute Second substitute Third substitute
6,436 (58.5%) 2,775 (25.2%) 1,281 (11.6%) 515 (4.7%)
Initial selected HH (100%) First substitute (100%) Second substitute (100%) Third substitute (100%)
Contactable Non-contactable Contactable Non-contactable Contactable Non-contactable Contactable Non-contactable
5427 (84.3%) 1009 (15.7%) 2207 (79.5%) 568 (20.5%) 1001 (78.1%) 280 (21.9%) 394 (76.5%) 121 (23.5%)
Contactable HH (100%) Contactable HH (100%) Contactable HH (100%) Contactable HH (100%)
Participation Refusal Participation Refusal Participation Refusal Participation Refusal
3,493 (64.4%) 1,934 (35.6%) 1,288 (58.4%) 919 (41.6%) 547 (54.6%) 454 (45.4%) 205 (52.0%) 189 (48.0%)
selected in the city. In sparsely populated, large munici-palities, interviewers remain confronted with consider-able travel distances.
A possible drawback of the complex sampling design, including stratification and clustering at different levels is that point and variance estimates will be biased if design effects are not taken into consideration during data analysis. Although multilevel analysis applied to (continuous and discrete) items of the BHIS1997 to as-sess the effect and the magnitude of the design showed very little intra-municipality correlation and moderate intra-household correlation [9], there is a need to correct for this correlation when presenting the results. The unequal selection probability, e.g. due to the non-proportional stratification at the regional level, and the oversampling of specific population groups, requires the use of sampling weights. Considering weights and design settings when analysing survey results is essential [10] but in practice not always applied.
The BHIS is focused on the realisation of the fixed number of interviews at the end of the fieldwork-phase. Using field substitution is believed to be the ‘engine’to achieve this. Substitution would also assure that hard-to-reach households (either in terms of ‘hard to contact’or ‘hard to participate’) would in the end be represented in the net-sample since hard-to-reach households are to be substituted with ‘similar’ households. Nevertheless field substitution remains a contested survey practice [11]. In the European Social Survey, for instance, substitution is simply not allowed as it does not meet the requirements of probability sampling [12,13]. However, Smith has ex-plored the use of substitution in surveys and concluded that optimal substitution (including close field supervi-sion, full-efforts to contact initial cases and
substi-tutes,…) resembles the use of random replicates and
can be considered a full-probability design [14]. Although it is assumed in the BHIS that substitution partially prevents a bias that could be introduced due to Table 6 Proportion of people in moderate to bad perceived health, by background characteristics
Analysis not taking into account the design effects
Analysis taking into account the design effect
Absolute difference between the two
estimates (in%)
Increase in standard error when taking into account the
design effect (in%) Estimate Standard error Estimate Standard error
Gender
Men 23.31 0.71 20.53 0.93 −2.78 30.99%
Women 29.07 0.71 25.73 0.94 −3.34 32.39%
Age group
15-24 8.82 0.94 6.52 1.06 −2.30 12.77%
25-34 13.05 1.01 11.02 1.14 −2.03 12.87%
35-44 16.77 1.05 15.95 1.45 −0.82 38.10%
45-54 26.25 1.27 26.68 1.79 0.43 40.94%
55-64 30.28 1.36 28.68 1.78 −1.60 30.88%
65-75 39.24 1.80 39.45 2.52 0.21 40.00%
75+ 48.99 1.39 48.19 2.22 −0.80 59.71%
Educational attainment
No diploma/ only primary
46.76 1.60 42.59 2.45 −4.17 53.13%
Lower secondary
37.68 1.38 35.09 2.07 −2.59 50.00%
Higher secondary
25.17 0.89 22.12 1.15 −3.05 29.21%
Higher 15.65 0.67 14.30 0.99 −1.35 47.76%
Region
Flemish Region
24.15 0.78 21.41 1.00 −2.74 28.21%
Brussels-Capital Region
26.69 1.00 25.74 1.17 −0.95 17.00%
Walloon Region
28.77 0.87 26.33 1.11 −2.44 27.59%
Total 26.42 0.50 23.25 0.71 −3.17 42.00%
a practice in which interviewers avoid ‘hostile’ areas (since substitution takes place within the original statis-tical sector) or hard to reach households (since criteria as household size and age of the reference person are used for substitution), analyses on the BHIS2004 results showed no empirical evidence for this assumption [15]. Yet, based on the experience of the BHIS it is felt that substitution positively affects the quality of the data col-lection in four other ways; (1) It optimises the efforts in-terviewers will ‘invest’ in trying to contact a household (since the substitutes will probably, given the common characteristics with the initial household, be as hard to reach). (2) It assures a better spread of the interviews throughout time. Given the approach to launch a batch of households to be contacted at the start of each trimester, not applying substitution would cause a peak of interviews during the first phase of every trimester. This peak does also exist in the current approach (given that +/−60% of all participating households are initially selected household) but is smoothed by the substitution process. (3) It facilitates the monitoring of the data col-lection phase and enables adjustments in the number of interviews to be realised. Although updated versions of the NPR are used to compose the sample, deterioration of their quality is inevitable. Substitution enables to ac-count for this, since it uses factual data (communicated by the interviewers) on the number of respondents. By monitoring the accrual rate per group, per trimester (number of effective interviews), the substitution ap-proach enables the decision to stop the activation of substitute-households once the targets are realised. (4) It is very closely target-oriented, since it does not use estimates for the participation-rate, but is based on the actual number of realised interviews.
Fieldwork substitution has also some setbacks: (1) Although the initial households and the substitutes have some common elements (size, age reference person, stat-istical sector), their health profile can be significantly dif-ferent. The assumption that the initial households and the substitutes are ‘alike’ can be hampered. (2) Substitution negatively affects the duration of the data collection phase. Since every time substitution is applied, the whole process of inviting households to participate, communicating the (new) addresses to the interviewers, the interviewers’
at-tempts to contact the households,… has to be repeated,
the delay between the activation of the initial household and finally the interview with a substitute-household tends to be substantial. (3) Finally substitution complicates the administrative procedures, since it presumes an individual follow up of every interviewer on a day to day basis in order to activate, or not, a substitute-household.
The finding that the methodological approach applied so far in the BHIS was successful in quantitative terms–
the scheduled number of interviews were realised – is
no assurance for achieving the goals of the current BHIS2013. For the BHIS2013 a shift was made from a PAPI to a CAPI-application for the face-to-face inter-views. This may reduce the response rate in specific population groups (e.g. women and older people) and also affect the responses [16]. If proven to be successful, the use of CAPI will result in a tailored content of (parts of ) the questionnaire according to the demands of the different commissioners. Another change in the BHIS2013 is that the data collection has been sub-contracted to Statistics Belgium that has integrated the survey in their other surveys (e.g. Labour Force Survey, Survey on Income and Living Conditions). Although the fundamental methodological choices that grounded the BHIS are left untouched (e.g. the application of matched substitution), some practicalities in the data-collection were adapted (e.g. the communication with the inter-viewers, the documentation of the contact-attempts).
BHIS provides unique data on the health of the inhabi-tants of the country. The current embedment in EHIS will enable to compare the Belgian results with these from all European countries which implies a major improvement compared with the post-harmonisation process that is needed to enable comparing of European data. Future challenges of the BHIS include the develop-ment of a Health Examination Survey (HES) as an ex-pansion to the BHIS approach and the linkage of BHIS data with administrative databases such as health con-sumption or mortality by cause data. A first attempt to link data of the BHIS2008 with data from the health in-surance database is now on-going.
Competing interests
The authors declared that they have no competing interest.
Authors’contributions
SD and JVdH drafted the paper. RC, SDr, LG and JT reviewed and commented the manuscript. All authors approved the final and submitted version. All authors read and approved the final manuscript.
Acknowledgements
The BHIS is a project conducted on request of all Ministers responsible for Public Health at the federal, regional and communal level united in the Commission of Commissioners of the BHIS.
Received: 18 June 2013 Accepted: 23 August 2013 Published: 18 September 2013
References
1. De Bruin A, Picavet HS, Nossikov A:Health Interview Surveys: towards international harmonization of methods and instruments.Copenhagen: World Health Organisation; 1996.
2. Van Oyen H, Tafforeau J, Hermans H, Quataert P, Schiettecatte E, Lebrun L, et al:The Belgian health interview survey.ArchPublicHealth1997,55:1–13. 3. Aromaa A, Koponen P, Tafforeau J, Vermeire C:Evaluation of health
interview surveys and health examination surveys in the European union.Eur J Publ Health2003,13:67–72.
5. Van Oyen H:The institutionalised populations in health survey.: Paper presented at the United Nations Meeting on Disability Measurement, New York; 2001. http://unstats.un.org/unsd/disability/pdfs/ac.81-7-6.pdf. 6. Quataert P, Van Oyen H, Tafforeau J, Schiettecatte E, Lebrun L,
Bellamammer L,et al:Health Interview Survey, 1997. Protocol for the selection of the households and the respondents.Brussel: S.P.H; 1998.
7. Tibaldi F, Bruckers L, Van Oyen H, Van der Heyden J, Molenberghs G:
Statistical software for calculating properly weighted estimates from health interview survey data.Soz Praventivmed2003,48:269–271. 8. Demarest S, Van der Heyden J, Charafeddine R, Tafforeau J, Van Oyen H,
Van Hal G:Socio-economic differences in participation of households in a Belgian national health survey.Eur J Public Health2012. doi:10.1093/ eurpub/cks158.
9. Renard D, Molenberghs G, Van Oyen H, Tafforeau J:Investigation of the clustering effect in the Belgian health interview survey 1997.Arch Public Health1998,56:345–361.
10. Berchtold A:Key elements in the statistical analysis of surveys.Int J Public Health2007,52:117–119.
11. David MC, Bensink M, Higashi H, Donald M, Alati R, Ware RS:Monte Carlo simulation of the cost-effectiveness of sample size maintenance programs revealed the need to consider substitution sampling.
J Clin Epidemiol2012,68:1200–1211.
12. Lynn P, Häder S, Gabler S, Laaksonen S:Methods for achieving equivalence of samples in cross-national surveys: the European social survey experience.Journal of Offical Statistics2007,23:107–124. 13. Pickery J, Carton A:Oversampling in relation to differential regional
response rates.Survey Research Methods2008,2:83–92.
14. Smith TW:Notes on the use of substitution in surveys.ISSP; 2007. unpublished NORC report, Chicago.
15. Van der Heyden J, Demarest S, Van Herck K, De Bacquer D, Tafforeau J, Van Oyen H:Association between variables used in the field substitution and post stratification adjustment in the Belgian health interview survey and non-response.International Journal of Public Health 20132013. doi:10.1007/ s00038-013-0460-7.
16. Eckholm O, Hesse U, Norlev J, Davidsen M:A comparison of CAPI and PAPI in a nationally representative Danish health survey.Europe: European Conference on Quality and Methodology in Official Statistics; 2004.
doi:10.1186/0778-7367-71-24
Cite this article as:Demarestet al.:Methodological basics and evolution
of the Belgian health interview survey 1997–2008.Archives of Public
Health201371:24.
Submit your next manuscript to BioMed Central and take full advantage of:
• Convenient online submission
• Thorough peer review
• No space constraints or color figure charges
• Immediate publication on acceptance
• Inclusion in PubMed, CAS, Scopus and Google Scholar
• Research which is freely available for redistribution