Real time QRS complex detection using
DFA and regular grammar
Salah Hamdi
*, Asma Ben Abdallah and Mohamed Hedi Bedoui
Background
The sequence of Q, R, and S peaks complex detection is one of the most frequently addressed tasks in ECG signal processing and analysis. A wide range of methods allow-ing high detection rates have been proposed and used [1–4]. Nevertheless, the problem remains open given the variety of ECG signals and the noise that might impact them. These methods include the Support Vector Machine (SVM) [5–12], the fuzzy neural networks [13–16] and the wavelets [1, 17–24]. Sahambi et al. [25, 26] utilized the first order derivative of the Gaussian function as a wavelet for the characterization of ECG beats. The author used the dyadic wavelet transform to detect and measure the different parts of a signal, especially the location of the beginning and the end of the QRS com-plex. Sahambi et al. showed the robustness of the algorithm in the presence of a high fre-quency noise added to the signal. In [1], a dyadic wavelet transform was used to extract
Abstract
Background: The sequence of Q, R, and S peaks (QRS) complex detection is a crucial procedure in electrocardiogram (ECG) processing and analysis. We propose a novel approach for QRS complex detection based on the deterministic finite automata with the addition of some constraints. This paper confirms that regular grammar is useful for extracting QRS complexes and interpreting normalized ECG signals. A QRS is assimi-lated to a pair of adjacent peaks which meet certain criteria of standard deviation and duration.
Results: The proposed method was applied on several kinds of ECG signals issued from the standard MIT-BIH arrhythmia database. A total of 48 signals were used. For an input signal, several parameters were determined, such as QRS durations, RR distances, and the peaks’ amplitudes. σRR and σQRS parameters were added to quantify the regularity of RR distances and QRS durations, respectively. The sensitivity rate of the suggested method was 99.74% and the specificity rate was 99.86%. Moreover, the sen-sitivity and the specificity rates variations according to the Signal-to-Noise Ratio were performed.
Conclusions: Regular grammar with the addition of some constraints and determin-istic automata proved functional for ECG signals diagnosis. Compared to statdetermin-istical methods, the use of grammar provides satisfactory and competitive results and indices that are comparable to or even better than those cited in the literature.
Keywords: ECG signal, QRS complex, RR distance, DFA, Regular grammar
Open Access
© The Author(s) 2017. This article is distributed under the terms of the Creative Commons Attribution 4.0 International License
(http://creativecommons.org/licenses/by/4.0/), which permits unrestricted use, distribution, and reproduction in any medium,
provided you give appropriate credit to the original author(s) and the source, provide a link to the Creative Commons license, and
indicate if changes were made. The Creative Commons Public Domain Dedication waiver (
http://creativecommons.org/publicdo-main/zero/1.0/) applies to the data made available in this article, unless otherwise stated.
RESEARCH
the characteristics of the ECG signal. The algorithm detected the QRS complex and the T wave, and then the P wave. Gramatikov et al. [27] focused on the morphology of the QRS complex and used the Morlet wavelet transform for the analysis of ECG recordings in patients with left or right coronary stenosis. The detection of the QRS complexes can be performed by a simple thresholding of the signal in terms of amplitude as the R peaks are generally larger than the other waves. The amplitude of the T wave is sometimes sim-ilar to that of the R peak, which can cause errors in the final result and the detection rate. Several QRS-complex-research algorithms based extensively on the proportion-ately high amount of QRS energy [28] were used. Most algorithms were based on the application of neural networks, hidden Markov model, syntactic methods, etc. [29–40]. More details on the QRS complex detection techniques, comparing their effectiveness and their calculation complexities, can be found in the presence of artifacts. Generally, the QRS detection algorithms are based on one of the temporal derivatives of methods, wavelets, filter banks and mathematical morphology [41–45]. These approaches are very effective and have a high accuracy rate that exceeds 99%. Kohler et al. [46] established a detailed study summarizing the different techniques for QRS detection. The discussed methods were sorted by categories and their performance was compared. Dotsinsky et al. [47] developed a heuristic algorithm applied on two channel recordings from AHA and MIT-BIH Arrhythmia Database.
the detection algorithm compared to conventional approaches. However, this algorithm has a sensitivity rate that does not exceed 96.3%.
The present work is based on learning automata to recognize rest phases, negative and positive peaks. The QRS complex was described by automation devices. Several param-eters were determined, such as the number of QRS complexes, the QRS durations, the RR distances and the amplitudes of peaks.
The remainder of the paper is organized as follows. “Methods” section explains the material and the proposed method. “Results and discussion” section presents and dis-cusses the obtained results, and a comparative study in terms of sensitivity rates was performed on several statistical methods. “Conclusion” section concludes the paper.
Methods Method overview
The suggested method recognizes the QRS complex in an ECG waveform based on grammar formalism. The grammatical formalism can efficiently represent the ECG and consequently facilitate the retrieval of signal features. The main advantage of this method allows a representation of several QRS in a concise way. It can better represent the QRS complex structures and therefore facilitate the recovery of several parameters. As regular grammar clearly represents hierarchical structures using a set of symbols and regular expressions, he ECG input seems to be a structured scene having a hierarchical order. Furthermore, the proposed method can describe a large set of QRS complexes using sets of simple primitives, grammatical rules, and deterministic finite automata.
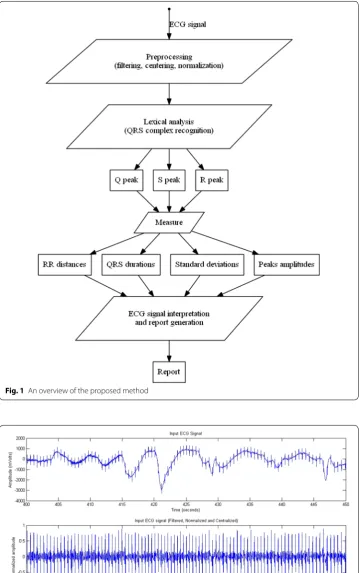
Figure 1 summarizes all the steps. The input signal amplitude is filtered, centralized and normalized. Then, the lexical analysis step recognizes tokens including positive and nega-tive peaks. A QRS complex is assimilated to a pair of adjacent peaks that satisfy certain criteria of standard deviation. It is described using deterministic automata and regular expressions. Finally, the analyzer computes the RR distances, the complex-QRS dura-tions, the standard deviation of RR distances, the standard deviation of QRS duradura-tions, and generates a report according to sampling frequency, time and amplitude values.
An ECG signal S[n] is actually too noisy and contains many artifacts, hence the need for preprocessing phases to reduce noise and facilitate lexical analysis afterwards. The band-pass filter reduces the influence of muscle noise, 60 Hz interference, base line wan-der, and T wave interference. The desirable pass-band to maximize the QRS energy is approximately 5–15 Hz [30].
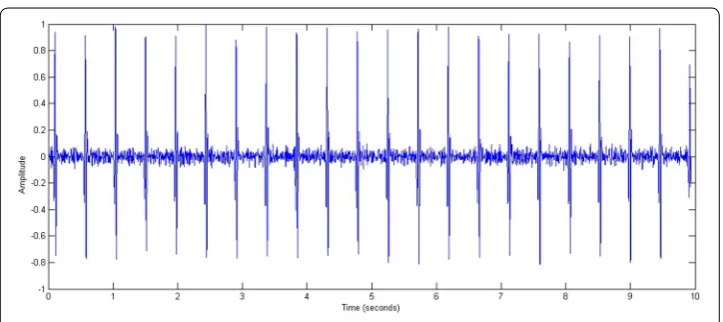
The following mathematical equations describe the various steps of the preprocessing phase: band-pass filtering, signal centering, and normalization of signal amplitude. An example is displayed later in Fig. 2 where a normalized and centered ECG signal repre-senting a tachycardia is filtered by a band-Pass filter.
Step 1: Band-pass filtering of the signal S[n] where H[n] is a band-pass filter and 5–15 Hz is the cutoff frequency.
Step 2: Signal centering:
(1)
S1[n]=S[n]∗H[n]
(2) S2[n]=S1[n]−
m
i=1S1[i]
Fig. 1 An overview of the proposed method
The m parameter is the signal length. Step 3: Amplitude signal normalization:
Figure 2 presents an example of a real ECG signal before and after the filtering process. The input signal was issued from one patient with tachycardia. Preprocessing did elimi-nate the artifacts and centralize the signal.
Grammatical analysis of the signal
The output signal amplitude is processed in the form of a value sequence belonging to the bounded interval [−1, 1]. The normalized amplitude is described as a sequence of almost nil, negative and positive values; i.e., the signal is assimilated to a language where the QRS complex represents a suite of lexemes.
The alphabet ∑ = {0,1,2,3,4,5,6,7,8,9, -,.} contains all symbols that can represent a nor-malized amplitude belonging to the bounded interval [−1, 1]. Then, the regular expres-sions make the lexical analysis of the signal. In fact, the deterministic automata and the regular expressions represent the rest phase, the positive peak and the negative peak, and make up the QRS complex with the addition of some constraints of standard deviation.
Mathematically, a positive or negative peak must show a higher standard deviation σ that is much greater than a threshold σ1.
Given the sampling frequency Fe, a peak, a wave or a rest phase are made of a sequence of k normalized simples {a1, a2,…, ak} having an average amplitude a¯ The calculation of the standard deviation σ and the duration Δ are as follows:
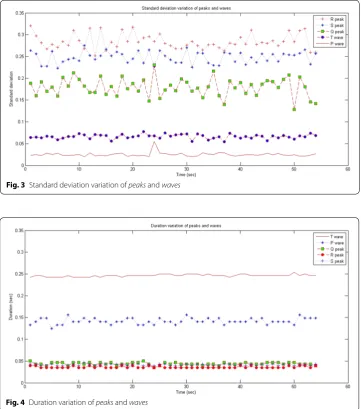
Figure 3 plots the standard deviations of several Q, R and S peaks as well as P and T waves. Figure 3 confirms that both R and S peaks show very important standard devia-tions that are higher than 0.2. The Q peak has standard deviadevia-tions that are higher than 0.1 while both P and T waves have very low values of standard deviations below 0.05.
According to Fig. 3, σ1 = 0.1. Starting from this value, we can distinguish between the peaks and the waves. Actually, a QRS complex is assimilated to a pair of adjacent peaks that satisfy the criteria of standard deviation.
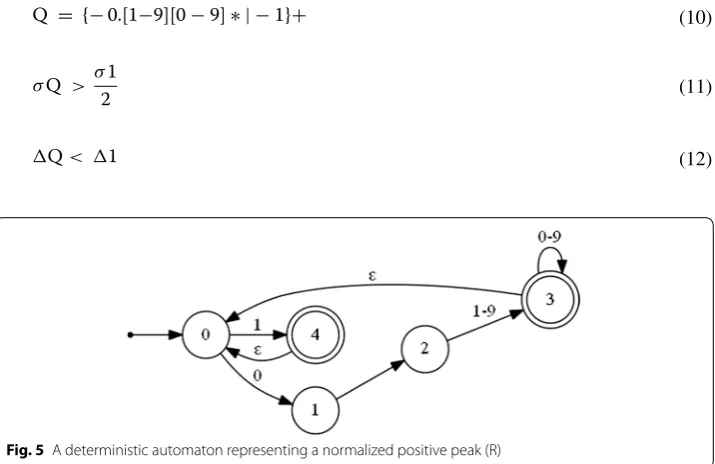
Figure 4 plots the durations of several Q, R and S peaks as well as P and T waves for several ECG signal recordings. This confirms that the durations of these peaks are small and shorter than 0.1 s while both P and T waves’ durations are longer than 0.1 s.
(3)
S3[n]= S2[n]−Mean(S2[n])
Max(S2[n]−Mean(S2[n]))
(4) σ=
k
i=1
(ai− ¯a)2 k
(5)
¯
a=
k
i=1 ai k
(6)
Based on Fig. 4, Δ1 = 0.1 s is defined as a threshold. Starting from this value, we can distinguish between the peaks and the waves. Thus, a QRS complex is assimilated to a pair of adjacent peaks that satisfy the criteria of standard deviation and duration.
A Deterministic Finite Automaton (DFA) on an alphabet Σ is a quadruple (Q, δ, q0, F) where:
• q0 is the start state.
• Q is a finite set of states.
• F is a part of Q called final states.
• δ is a transition function Q × Σ in Q.
The DFA consists of a finite set of states (often denoted Q), a finite set Σ of symbols (alphabet), a transition function that takes as argument a state and a symbol and returns a state (often denoted δ), a start state often denoted q0, and a set of final or accepting states (often denoted F). We have q0 ∈ Q and F ⊆ Q.
Fig. 3 Standard deviation variation of peaks and waves
Grammatically, the symbol ‘∊’ means an empty word having zero length, ‘*’ means ‘zero or more times’, ‘+’ means ‘one or more times’, and the symbol ‘?’ means ‘zero or one time’.
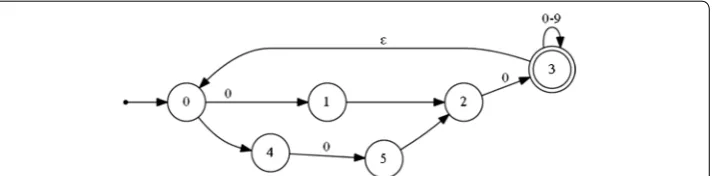
The following regular expression and the deterministic automaton (Fig. 5) describe a normalized positive peak:
The start sate q0 = {0}.
The finite set of states Q = {0,1,2,3,4}. The final set of states F = {3,4}. The transition functions are:
δ(0,0) = 1 δ(1,·) = 2 δ(2,1–9) = 3 δ(3,0–9) = 3
δ(3,ε) = 0 δ(0,1) = 4 δ (4, ε) = 0
The following regular expression and the deterministic automaton (Fig. 6) describe a normalized negative peak:
(7)
R = {0.[1−9][0−9]∗ |1}+
(8)
σR > σ1
(9) �R < �1
(10)
Q = {−0.[1−9][0−9]∗ | −1}+
(11)
σQ > σ1 2
(12) �Q< �1
Fig. 5 A deterministic automaton representing a normalized positive peak (R)
The start sate q0 = {0}.
The finite set of states Q = {0,1,2,3,4,5}. The final set of states F = {4,5}.
The transition functions are:
δ(0,−) = 1 δ(1,0) = 2 δ(2,·) = 3 δ(3,1–9) = 4
δ(4,0–9) = 4 δ(4,ε) = 0 δ(1,1) = 5 δ (5, ε) = 0
The following regular expression and the deterministic automaton (Fig. 7) describe a normalized and short rest phase separating the peaks:
The start sate q0 = {0}.
The finite set of states Q = {0, 1, 2, 3, 4, 5}. The final state F = {3}.
The transition functions are:
δ(0,0) = 1 δ(1,·) = 2 δ(2,0) = 3 δ(3,0–9) = 3
δ(3,ε) = 0 δ(0,−) = 4 δ(4,0) = 5 δ(5,·) = 2
The regular expression below and Fig. 8 describe a normalized QRS complex. Q is the first peak pointing down, which is not always visible on the plot. The R peak is the sec-ond one. It is of high amplitude and directed upward. The S peak is the last one, and it is directed downward.
(13) S = { −0.[1−9][0−9]∗ | −1}+
(14)
σS > σ1
(15) �S< �1
(16) rest= {{−}? 0.0[0−9]∗}+
(17) �rest< �1
2
(18)
QRS= {Q}?{rest}?{R}{rest}?{S}
Fig. 7 A deterministic automaton representing a normalized and short rest phase separating the peaks
(See figure on next page.)
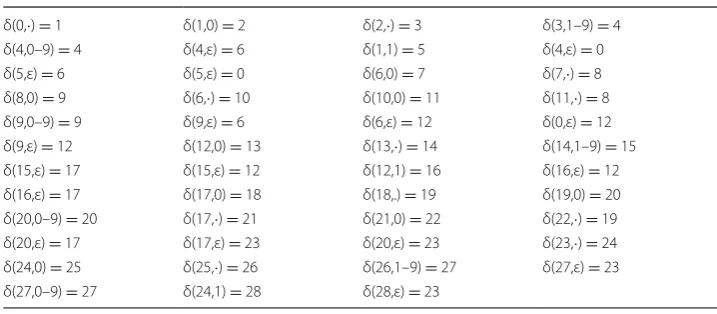
The start sate q0 = {0}.
The finite set of states Q = {0,1,2,3,..,27,28}. The final set of states F = {27,28}.
The transition functions are:
δ(0,·) = 1 δ(1,0) = 2 δ(2,·) = 3 δ(3,1–9) = 4
δ(4,0–9) = 4 δ(4,ε) = 6 δ(1,1) = 5 δ(4,ε) = 0
δ(5,ε) = 6 δ(5,ε) = 0 δ(6,0) = 7 δ(7,·) = 8
δ(8,0) = 9 δ(6,·) = 10 δ(10,0) = 11 δ(11,·) = 8
δ(9,0–9) = 9 δ(9,ε) = 6 δ(6,ε) = 12 δ(0,ε) = 12
δ(9,ε) = 12 δ(12,0) = 13 δ(13,·) = 14 δ(14,1–9) = 15
δ(15,ε) = 17 δ(15,ε) = 12 δ(12,1) = 16 δ(16,ε) = 12
δ(16,ε) = 17 δ(17,0) = 18 δ(18,.) = 19 δ(19,0) = 20
δ(20,0–9) = 20 δ(17,·) = 21 δ(21,0) = 22 δ(22,·) = 19 δ(20,ε) = 17 δ(17,ε) = 23 δ(20,ε) = 23 δ(23,·) = 24 δ(24,0) = 25 δ(25,·) = 26 δ(26,1–9) = 27 δ(27,ε) = 23 δ(27,0–9) = 27 δ(24,1) = 28 δ(28,ε) = 23
Grammatically, QRS is assimilated to a suite of negative and positive peaks which may be separated by a very short resting phase. It should be noted that the above regu-lar expression and the deterministic automaton presume that the Q peaks and the rest phases may be absent.
Results and discussion Results
In this section, the method described above was applied on several real ECG signals rep-resenting different patients and issued from the standard MIT-BIH arrhythmia database. For all the input signals, the QRS complexes were detected, the Q, R and S peaks were separated and the RR distances were measured. The RR distance refers to the duration between two successive R peaks. Furthermore, a comparative study with several meth-ods [30, 37, 38, 44, 56–64] was performed with regard to QRS complex detection.
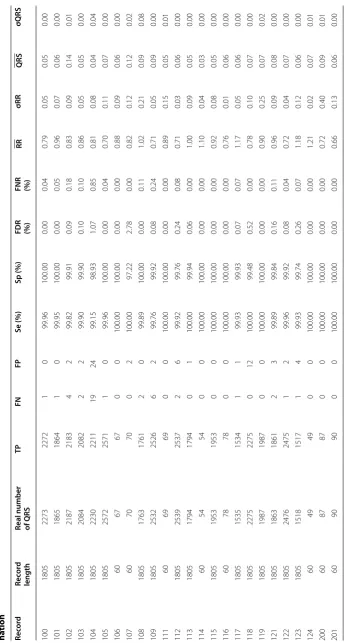
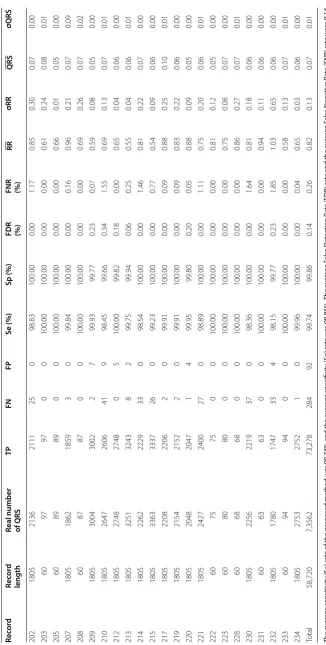
Table 1 shows an application on several real ECG signals to extract the QRS complex. The True Positive (TP), the False Positive (FP), the False Negative (FN), the Sensitivity (Se), the specificity (Sp), the False Detection Rate (FDR), and the False Negative Rate (FNR) values are determined where:
TP represents the correctly identified QRS. FP represents the incorrectly identified QRS. FN represents the incorrectly rejected QRS.
(19) Sensitivity(%)= TP
TP+FN ∗100
(20)
Specificity(%)= TP
TP+FP∗100
(21)
False detection rate(%)= FP
TP+FP∗100
(22)
False negative rate(%)= FN
Table 1 A pplic ation on se ver al r eal EC
G signals issued fr
om the standar d da tabase MIT -BIH, e xtr ac tion of QRS c omple x, sensitivit y and sp ecificit y r at es det ermi -na tion Re co rd Rec or d length
Real number of QRS
Table 1 c on tinued Re co rd Rec or d length
Real number of QRS
TP FN FP Se (%) Sp (%) FDR (%) FNR (%) RR σRR QRS σQRS 202 1805 2136 2111 25 0 98.83 100.00 0.00 1.17 0.85 0.30 0.07 0.00 203 60 97 97 0 0 100.00 100.00 0.00 0.00 0.61 0.24 0.08 0.01 205 60 89 89 0 0 100.00 100.00 0.00 0.00 0.66 0.01 0.05 0.00 207 1805 1862 1859 3 0 99.84 100.00 0.00 0.16 0.96 0.21 0.07 0.09 208 60 87 87 0 0 100.00 100.00 0.00 0.00 0.69 0.26 0.07 0.02 209 1805 3004 3002 2 7 99.93 99.77 0.23 0.07 0.59 0.08 0.05 0.00 210 1805 2647 2606 41 9 98.45 99.66 0.34 1.55 0.69 0.13 0.07 0.01 212 1805 2748 2748 0 5 100.00 99.82 0.18 0.00 0.65 0.04 0.06 0.00 213 1805 3251 3243 8 2 99.75 99.94 0.06 0.25 0.55 0.04 0.06 0.01 214 1805 2262 2229 33 0 98.54 100.00 0.00 1.46 0.81 0.22 0.07 0.00 215 1805 3363 3337 26 0 99.23 100.00 0.00 0.77 0.54 0.09 0.06 0.00 217 1805 2208 2206 2 0 99.91 100.00 0.00 0.09 0.88 0.25 0.10 0.01 219 1805 2154 2152 2 0 99.91 100.00 0.00 0.09 0.83 0.22 0.06 0.00 220 1805 2048 2047 1 4 99.95 99.80 0.20 0.05 0.88 0.09 0.05 0.00 221 1805 2427 2400 27 0 98.89 100.00 0.00 1.11 0.75 0.20 0.06 0.01 222 60 75 75 0 0 100.00 100.00 0.00 0.00 0.81 0.12 0.05 0.00 223 60 80 80 0 0 100.00 100.00 0.00 0.00 0.75 0.08 0.07 0.00 228 60 68 68 0 0 100.00 100.00 0.00 0.00 0.86 0.27 0.07 0.01 230 1805 2256 2219 37 0 98.36 100.00 0.00 1.64 0.81 0.18 0.06 0.00 231 60 63 63 0 0 100.00 100.00 0.00 0.00 0.94 0.11 0.06 0.00 232 1805 1780 1747 33 4 98.15 99.77 0.23 1.85 1.03 0.65 0.06 0.00 233 60 94 94 0 0 100.00 100.00 0.00 0.00 0.58 0.13 0.07 0.01 234 1805 2753 2752 1 0 99.96 100.00 0.00 0.04 0.65 0.03 0.06 0.00 Total 58,720 7,3562 73,278 284 92 99.74 99.86 0.14 0.26 0.82 0.13 0.07 0.01 The a ver age sensitivit y (S e) r at
e of the pr
oposed method w
as 99.74% and the a
ver age specificit y (Sp ) r at e w as 99.86%. The a ver age F alse D et ec tion R at
e (FDR) r
at
e and the a
ver age F alse Nega tiv e R at
e (FNR) r
at
e w
er
e 0.14
and 0.26% r
espec
tiv
For each recording, the standard deviation of the RR distances denoted σRR and the standard deviation of the QRS durations denoted σQRS were computed. It should be noted that the standard deviation parameters are a sign of relationship between the obtained values and the average value where the n parameter is the total number of RR distances:
σRR and σQRS parameters were added to quantify the regularity of RR distances and QRS durations, respectively. A short σRR meant that all the RR distances were stable. A short σQRS meant that all the QRS durations were also stable.
In order to validate the proposed method, we used several kinds of ECG signals issued from the MIT-BIH arrhythmia database. These signals had a 360 Hz sampling frequency, a 200 gain and a 1024 mV base. For each input signal, several parameters were deter-mined, such as the number of QRS, the RR distances, the QRS durations, the stand-ard deviation of RR distances, the standstand-ard deviation of QRS durations, and the peaks amplitudes (Table 1).
According to these results, a σRR lower than 0.1 meant that all the RR distances were regular. However, a σRR higher than 0.1 meant that the obtained values of the RR dis-tances were irregular. Similarly, a short σQRS lower than 0.1 meant that all the QRS durations were regular and a high σQRS more than 0.1 implied that the obtained values were irregular.
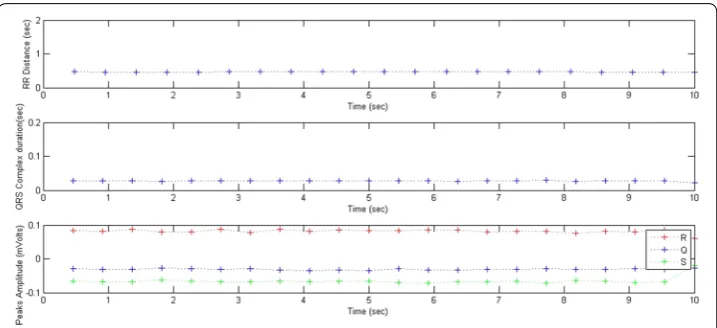
Figures 9 and 10 show the result obtained from a portion of an ECG representing an irregular beat rate. The various indicators of the signal (RR distance; QRS complex; Q, R and S amplitudes) are displayed. The average RR and QRS values are 0.84 and 0.03 s respectively. However, the RR distances are irregular. In fact, the standard deviation of the RR distances is σRR = 0.15. This high value proves that the RR distance is not stable.
The QRS complexes have regular durations of less than 0.1 s. Indeed, the standard deviation of the QRS durations is σQRS = 0.01. In this case, this low value indicates that the QRS duration is stable.
Figures 11 and 12 show the results obtained from an ECG portion representing a regu-lar beat rate. The average RR and QRS values are 0.46 and 0.02 s respectively. The RR
(23)
σRR=
n
i=1
(RRi−RR) n
(24)
RR= n
i=1 RRi
n
(25)
σQRS=
n+1
i=1
QRSi−QRS2 n+1
(26) QRS=
n+1
Fig. 9 A portion of a normalized ECG representing an irregular beat rate
Fig. 10 RR distances, QRS durations and peaks amplitudes variations; RR= 0.84 s, σRR = 0.15, QRS=0.03 s
, σQRS = 0.01
distances are regular and the standard deviation of the RR distances is σRR = 0.00. This low value shows that the RR distance is stable.
The QRS complexes have regular durations of less than 0.1 s, the standard deviation of the QRS durations being σQRS = 0.00. This low value indicates that the QRS duration is stable.
Noise sensitivity
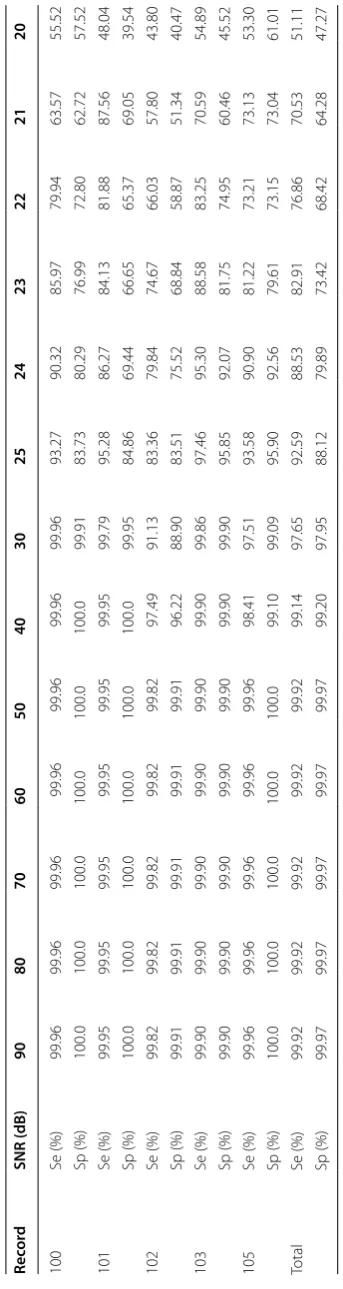
In this section, we examined the present method’s sensitivity to noise by adding a dif-ferent noise value to the ECG recordings. Table 2 shows the variation of sensitivity and specificity rates according to Signal-to-Noise Ratio (SNR).
For SNR values greater than 40 dB, the method provided high sensitivity values that exceeded 99%. For SNR values greater than 30 dB, the method yielded sensitivity val-ues which exceeded 97%. For the SNR valval-ues that were lower than 24 dB, the sensitivity value decreased to 90%.
Figure 13 shows the variation sensitivity rate depending on the SNR for different ECG recordings issued from the MIT-BIH database (100, 101, 102, 103 and 105 records). For the SNR values lower than 20 dB, the method provided sensitivity rates lower than 50%.
Generally, sensitivity becomes increasingly important where SNR values are greater than 30 dB. For SNR values exceeding 30 dB, the method gave sensitivity rates which exceeded 97%. When SNR exceeded 40 dB, the method provided high sensitivity values that reached 99%.
Comparison of performance
In order to compare the detection algorithm with other works in the literature, the qual-ity performance detection was compared with several algorithms tested and validated on the MIT-BIH data base. Those algorithms varied and each one was based on an appro-priate technique. Table 3 shows a comparative study with several methods [30, 37, 38,
44, 56–64] applied on the same MIT-BIH database in terms of sensitivity rates.
Based on the results presented in Table 3, all the above mentioned algorithms have good QRS complex detection capability with a sensitivity that exceeds 99%. Similarly, the
Table
2
P
er
formanc
e of the pr
op
osed metho
d on EC
G signals with diff
er
en
t SNR v
proposed method provided satisfactory and competitive results and could be considered for QRS complex detection in the ECG signal.
Discussion
In summary, a few approaches based on grammatical formalism for ECG signal pro-cessing and controls were used. The proposed method confirmed that regular grammar domains could be extended to be applied for negative and positive peaks recognition. The QRS complex is assimilated to a pair of adjacent peaks which satisfy certain criteria of standard deviation and duration. Various parameters were determined, such as the
Fig. 13 Sensitivity variation according to Signal-to-Noise Ratio (SNR). Application on 100, 101, 102, 103 and 105 ECG records
Table 3 Comparison of performance of several QRS detection algorithms cited in the lit-erature
Method Method description Sensitivity (%)
Pan et al. [30] Derivative approach based on filtering and analyzing the slope 99.30 Szu et al. [37] Neural network based on adaptive filtering 99.50 Sai et al. [38] Using the Euclidean distance metric with KNN algorithm (K-Nearest
Neighbor) 99.81
Ben et al. [44] Approach based on discrete wavelet decomposition and calculation
of energy 99.39
Ham et al. [56] Derivative approach based on filtering using an optimized process of
rule decision 99.46
Cho et al. [57] A multi wavelet packet decomposition 99.14
Had et al. [58] Empirical modal decomposition (EMD) 99.92
Chr et al. [59] Use of adaptive thresholding 99.65
Gha et al. [60] Mathematical model based on the continuous wavelet transform
(CWT) 99.91
Kry et al. [61] Technique based on the recursive temporal prediction 99.00 Meh et al. [62] Approach based on SVM (Support Vector Machine) 99.75 Gri et al. [63] A transformation based on the duration and the energy 99.26 Tra et al. [64] Approach based on mathematical morphology 99.38 The suggested method Approach based on regular grammar and calculation of the standard
number of QRS complex, the QRS durations, the RR distances, and the standard devia-tions σRR as well σQRS.
Compared with usual methods, the proposed approach affirmed that the use of gram-mar can represent the QRS structures efficiently. The syntactic approach can describe different types of ECG signals issued from the standard MIT-BIH arrhythmia database. The average sensitivity (Se) rate of the proposed method was 99.74% and the average specificity (Sp) rate was 99.86%. The average False Detection Rate (FDR) rate and the average False Negative Rate (FNR) rate were 0.26 and 0.14% respectively. These results are interesting and can be further improved by enhancing preprocessing.
We used σRR and σQRS of the RR and QRS distances regularity. We defined a thresh-old where these two variables would be irregular.
In order to study noise sensitivity, the method was applied on different ECG record-ings for different SNR values. The variation of the sensitivity and the specificity rates according to SNR was performed. When the SNR values were greater than 40 dB, the method gave high sensitivity values which exceeded 99%. When the SNR values were lower than 24 dB, the sensitivity value decreased to 90%.
Conclusion
In this paper, the DFA proved useful for QRS complex recognition and ECG signal interpretation. A QRS complex is assimilated to a pair of adjacent peaks that satisfy certain criteria of standard deviation. This method recognizes the QRS complex in an ECG waveform. The QRS complex is described using deterministic automata and regu-lar expressions. For an input signal, all the various indicators such as the complex-QRS durations, the RR distances, the σRR and the σQRS were deduced. The σRR and σQRS parameters were added to quantify the regularity of the RR distances and QRS dura-tions, respectively. This work is aimed at assisting medical diagnosis and providing clini-cal decision aid for ECG analysis.
Currently, we are working on improving preprocessing and we will propose other grammatical rules to represent distinct pathological cases. We are also working on a hybrid method based on grammar and statistics to ensure a good performance in all cases. The σRR and σQRS variables will be better analyzed on a large scale population in order to provide a fine classification of pathologies.
Abbreviations
ECG: electrocardiogram; QRS: The sequence of Q, R, and S peaks; DFA: deterministic finite automata; RR: distance separat-ing two consecutive R peaks; TP: True Positive; FP: False Positive; FN: False Negative (FN); Se: Sensitivity; Sp: Specificity; FDR: False Detection Rate; FNR: False Negative Rate (FNR); SNR: Signal to Noise Ratio.
Authors’ contributions
SH carried out the studies, participated in the sequence alignment and drafted the manuscript. ABA participated in the design of the study and performed the statistical analysis. MHB conceived of the study, and participated in its design and coordination. All authors read and approved the final manuscript.
Acknowledgements Not applicable. Competing interests
The authors declare that they have no competing interests. Data availability
ECG signals are issued from the standard MIT-BIH arrhythmia database: https://www.physionet.org/physiobank/
Received: 4 November 2016 Accepted: 10 February 2017
References
1. Li C, Zheng C, Tai C. Detection of ECG characterictic points using wavelet transforms. IEEE Trans Biomed Eng.
1995;42:21–8. doi:10.1109/10.362922.
2. Linh TH, Osowski S, Stodolski M. On-line heart beat recognition using Hermite polynomials and neuro-fuzzy
net-work. IEEE Trans Instrum Meas. 2003;52:1224–31. doi:10.1109/TIM.2003.816841.
3. Link A, Endt P, Oeff M, Trahms L. Variability of the QRS in high resolution electrocardiograms and
magnetocardio-grams. IEEE Trans Biomed Eng. 2001;48:133–42. doi:10.1109/10.909634.
4. Gang L, Wenyer Y, Ling L. An artificial intelligence approach to ECG analysis. IEEE Eng Med Biol Mag. 2000;19:95–100. doi:10.1109/51.827412.
5. Kei-ichiro M, Nakajima H, Toyoshima T. Real-time discrimination of ventricular tachyarrhythmia with
fourier-trans-form neural network. IEEE Trans Biomed Eng. 1999;46:179–85. doi:10.1109/10.740880.
6. Dib N, Benali R, Slimane ZH, Reguig FB. Delineation of the complex QRS and the t-end using wavelet transform and surface indicator. Signal processing and their applications . New York: IEEE International Workshop on Systems; 2011. p. 83–6.
7. Ince T, Kiranyaz S, Gabbouj M. A generic and robust system for automated patient-specific classification of ECG
signals. IEEE Trans Biomed Eng. 2009;56:1415–26. doi:10.1109/TBME.2009.2013934.
8. Ghoggali N, Melgani F, Bazi Y. A multiobjective genetic SVM approach for classification problems with limited
train-ing samples. IEEE Trans Geosci Remote Sens. 2009;47:1707–18. doi:10.1109/TGRS.2008.2007128.
9. Khandoker AH, Palaniswami M, Karmakar CK. Support vector machines for automated recognition of obstructive sleep
apnea syndrome from ECG recordings. IEEE Trans Inf Technol Biomed. 2009;13:37–48. doi:10.1109/TITB.2008.2004495.
10. Melgani F, Bazi Y. Classification of electrocardiogram signals with support vector machines and particle swarm
optimization. IEEE Trans Inf Technol Biomed. 2008;12:667–77. doi:10.1109/TITB.2008.923147.
11. Kampouraki A, Manis G, Nikou C. Heartbeat time series classification with support vector machines. IEEE Trans Inf
Technol Biomed. 2009;13:512–8. doi:10.1109/TITB.2008.2003323.
12. Zhu Y. SVM classification algorithm in ECG classification. Commun Comput Inf Sci. 2012;308:797–803. doi:10.1007/978-3-642-34041-3_110.
13. Lim JS. Finding features for real time premature ventricular contraction detection using a fuzzy neural network
system. IEEE Trans Neural Netw. 2009;20:522–7. doi:10.1109/TNN.2008.2012031.
14. Shyu LY, Wu YH, Hu W. Using wavelet transform and fuzzy neural network for VPC detection form the Holter ECG.
IEEE Trans Biomed Eng. 2004;51:1269–73. doi:10.1109/TBME.2004.824131.
15. Poungponsri S, Yu XH. An adaptive filtering approach for electrocardiogram (ECG) signal noise reduction using
neural networks. J Neurocomput. 2013;117:206–19. doi:10.1016/j.neucom.2013.02.010.
16. Ozbay Y, Ceylan R, Karlik B. Integration of type-2 fuzzy clustering and wavelet transform in a neural network based
ECG classifier. J Expert Syst Appl. 2011;38:1004–14. doi:10.1016/j.eswa.2010.07.118.
17. Tighiouart B, Rubel P, Bedda M. Improvement of QRS boundary recognition by means of unsupervised learning.
Comput Cardiol. 2003. doi:10.1109/CIC.2003.1291087.
18. Rodney Tan HG, Lum KM, Mok VH. Performance evaluation of coifman wavelet for ECG signal denoising. Int Fed Med
Biol Eng. 2007;15:419–22. doi:10.1007/978-3-540-68017-8_106.
19. Lu Z, Kim DY, Pearlman WA. Wavelet compression of ECG signals by the set artitioning in hierarchical trees algorithm.
IEEE Trans Biomed Eng. 2000;47:849–56. doi:10.1109/10.846678.
20. Hassanpour H, Parsaei A. Fetal ECG extraction using wavelet transform. IEEE Comput Intell Model Control Autom.
2006. doi:10.1109/CIMCA.2006.98.
21. Afsar FA, Afsar M. Robust electrocardiogram (ECG) beat classification using discrete wavelet transform. IEEE Int Conf
Bioinform Biomed Eng. 2008;2:1867–70. doi:10.1109/ICBBE.2008.796.
22. Nikolaev N, Nikolov Z, Gotchev A, Egiazarian K. Wavelet domain Wiener filtering for ECG denoising using improved
signal estimate. IEEE Int Conf Acoust Speech Signal Process. 2000;6:3578–81. doi:10.1109/ICASSP.2000.860175.
23. Benzid R, Marir F, Boussaad A, Benyoucef M, Arar D. Fixed percentage of wavelet coefficients to be zeroed for ECG
compression. IEEE Electron Lett. 2003;39:830–1. doi:10.1049/el:20030560.
24. Nouira I, Abdallah AB, Bedoui MH, Dogui M. A robust R peak detection algorithm using wavelet transform for heart rate variability studies. Int J Electr Eng Inform. 2013;5:270–84.
25. Sahambi JS, Tandon SM, Bhatt RKP. Using wavelet transform for ECG characterization. IEEE Eng Med Biol. 1997;16:77–
83. doi:10.1109/51.566158.
26. Sahambi JS, Tandon SM, Bhatt RKP. Quantitative analysis of errors due to power-line interference and base-line
drift in detection of onsets and offsets in ECG using wavelets. Med Biol Eng Comput. 1997;35:747–51. doi:10.1007/
BF02510988.
27. Gramatikov B, Brinker J, Yi-chun S, Thakor NV. Wavelet analysis and time-frequency distributions of the body surface ECG before and after angioplasty. Comput Methods Progr Biomed. 2000;62:87–98.
28. Weng C. Classification of ECG complexes using self-organizing CMAC. Measurement. 2009;42:399–707. doi:10.1016/j.measurement.2008.08.004.
29. Williams JL, Lesaffre E. Comparison of multi-group logistic and linear discriminant ECG and VCG classification. J
Electrocardiol. 1987;20:83–92. doi:10.1016/S0022-0736(87)80096-1.
30. Pan J, Tompkins WJ. A real-time QRS detection algorithm. IEEE Trans Biomed Eng. 1985;32:230–6. doi:10.1109/
TBME.1985.325532.
31. Poli R, Cagnoni S, Valli G. Genetic design of optimum linear and nonlinear QRS detectors. IEEE Trans Biomed Eng.
32. Giovanni B, Christian B, Sergio F. Possibilities of using neural networks for ECG classification. J Electrocardiol.
1996;29:10–6. doi:10.1016/S0022-0736(96)80003-3.
33. Coast DA, Stern RM, Cano GG, Briller SA. An approach to cardiac arrhythmia analysis using hidden Markov models.
IEEE Trans Biomed Eng. 1990;37:826–36. doi:10.1109/10.58593.
34. Olmez T. Classification of ECG waveforms using RCE neural network and genetic algorithm. Electr Lett.
1997;33:1561–2. doi:10.1049/el:19971019.
35. Osowski S, Linh TH. ECG beat recognition using fuzzy hybrid neural network. IEEE Trans Biomed Eng. 2001;48:1265–
71. doi:10.1109/10.959322.
36. Rosaria S, Carlo M. Artificial neural networks for automatic ECG analysis. IEEE Trans Signal Process. 1998;46:1417–25. doi:10.1109/78.668803.
37. Szu HH. Neural network adaptive wavelets for signal representation and classification. Opt Eng. 1992;31:1907–16. doi:10.1117/12.59918.
38. Saini I. QRS detection using K-Nearest Neighbor algorithm (KNN) and evaluation on standard ECG databases. J Adv
Res. 2012;4:331–44. doi:10.1016/j.jare.2012.05.007.
39. Wei S, Wang Y, Zuo Y. Wavelet neural networks robust control of farm transmission line deicing robot manipulators.
Comput Stand Interfaces. 2012;34:327–33. doi:10.1016/j.csi.2011.11.001.
40. Wei HL, Billings SA, Zhao YF, Guo LZ. An adaptive wavelet neural network for spatio-temporal system identification.
Neural Netw. 2010;23:1286–99. doi:10.1016/j.neunet.2010.07.006.
41. Barro S, Fernandez M. Classifying multi-channel ECG patterns with adaptive neural network. IEEE Eng Med Biol Mag.
1998;17:45–55. doi:10.1109/51.646221.
42. Benali R, Chikh MA. Neuro fuzzy classifier for cardiac arrythmias recognition. J Theor Appl Inf Technol. 2009;5:577–83. 43. Benali R, Dib N, Reguig FB. Cardiac arrhythmia diagnosis using a neuro-fuzzy approach. J Mech Med Biol.
2010;10:417–29. doi:10.1142/S021951941000354X.
44. Benali R, Reguig FB, Slimane ZH. Automatic classification of heartbeats using wavelet neural network. J Med Syst.
2012;36:883–92. doi:10.1007/s10916-010-9551-7.
45. Wieben O, Afonso V, Tompkins W. Classification of premature ventricular complexes using filter bank features,
induction of decision trees and a fuzzy rule-based system. Med Biol Eng Comput. 1999;37:560–5. doi:10.1007/
BF02513349.
46. Kohler BU, Hennig C, Orglmeister R. The principles of software QRS detection. IEEE Eng Med Biol Mag. 2002;21:42–
57. doi:10.1109/51.993193.
47. Dotsinsky I, Stoyanov T. Ventricular beat detection in single channel electrocardiograms. BioMed Eng Online. 2004;3:1–9.
48. Pedro RWD, Nunes FLS, Lima AM. Using grammars for pattern recognition in images: a systematic review. ACM
Comput Surv. 2013;46:1–34. doi:10.1145/2543581.2543593.
49. Gao J, Ding X, Zheng J. Image pattern recognition based on examples-A combined statistical and
structural-syntac-tic approach. Lect Notes Comput Sci. 1876;2000:57–66. doi:10.1007/3-540-44522-6_6.
50. Kókai G, Csirik J, Gyimóthy T. Learning the syntax and semantic rules of an ECG grammar. Lect Notes Comput Sci.
1997;1321:171–80. doi:10.1007/3-540-63576-9_106.
51. Trahanias P, Skordalakis E. Syntactic pattern recognition of the ECG. IEEE Trans Pattern Anal Mach Intell. 1990;12:648–
57. doi:10.1109/34.56207.
52. Hamdi S, Abdallah AB, Bedoui MH. Grammar formalism for ECG signal interpretation and classification. Appl Med
Inform. 2014;35:21–6 (ICID: 1134069).
53. Holsinger WP, Kempner KM, Miller MH. A QRS preprocessor based on digital differentiation. IEEE Trans Biomed Eng.
1971;18:212–7. doi:10.1109/TBME.1971.4502834.
54. Fraden J, Neumann MR. QRS wave detection. Med Biol Eng Comput. 1980;18:125–32. doi:10.1007/BF02443287.
55. Lobabi-Mirghavami H, Abdali-Mohammadi F, Fathi A. A novel grammar-based approach to atrial fibrillation arrhyth-mia detection for pervasive healthcare environments. J Comput Secur. 2015;2:155–63.
56. Hamilton PS, Tompkin WJ. Quantitative investigation of QRS detection rules using MIT/BIH Arrhythmia database.
IEEE Eng Med Biol Mag. 1986;33:1157–65. doi:10.1109/TBME.1986.325695.
57. Chouakri SA, Reguig FB, Ahmed AT. QRS complex detection based on multiwavelet packet decomposition. Appl
Math Comput. 2011;217:9508–25. doi:10.1016/j.amc.2011.03.001.
58. Slimane ZH, Amine NA. QRS complex detection using empirical mode decomposition. Digit Signal Process.
2010;20:1221–8. doi:10.1016/j.dsp.2009.10.017.
59. Christov I. Real time electrocardiogram QRS detection using combined adaptive threshold. BioMed Eng Online.
2004;3:1–9. doi:10.1186/1475-925X-3-28.
60. Ghaffari A, Golbayani H, Ghasemi M. A new mathematical based QRS detector using continuous wavelet transform.
Comput Electr Eng. 2008;38:81–91. doi:10.1016/j.compeleceng.2007.10.005.
61. Kyrkos A, Giakoumakis EA, Carayannis G. QRS detection through time recursive prediction technique. Signal Process.
1988;15:429–36. doi:10.1016/0165-1684(88)90061-8.
62. Mehta SS, Lingayat NS. Development of SVM based classification techniques for the Delineation of wave
compo-nents in 12-lead electrocardiogram. Biomed Signal Process Control. 2008;3:341–9. doi:10.1016/j.bspc.2008.04.002.
63. Gritzali F. Towards a generalized scheme for QRS detection in ECG waveforms. Signal Process. 1998;15:183–92. doi:10.1016/0165-1684(88)90069-2.
64. Trahanias PE. An approach to QRS-complex detection using mathematical morphology. IEEE Trans Biomed Eng.