R E S E A R C H
Open Access
Differential expression of major histocompatibility
complex class I in developmental glioneuronal
lesions
Avanita S Prabowo
1, Anand M Iyer
1, Jasper J Anink
1, Wim GM Spliet
2, Peter C van Rijen
2and Eleonora Aronica
1,3,4*Abstract
Purpose:The expression of the major histocompatibility complex class I (MHC-I) in the brain has received
considerable interest not only because of its fundamental role in the immune system, but also for its non-immune functions in the context of activity-dependent brain development and plasticity.
Methods:In the present study we evaluated the expression and cellular pattern of MHC-I in focal glioneuronal lesions associated with intractable epilepsy. MHC-I expression was studied in epilepsy surgery cases with focal cortical dysplasia (FCD I,n= 6; FCD IIa,n= 6 and FCD IIb,n= 15), tuberous sclerosis complex (TSC, cortical tubers; n= 6) or ganglioglioma (GG;n= 15) using immunocytochemistry. Evaluation of T lymphocytes with granzyme-B+ granules and albumin immunoreactivity was also performed.
Results:All lesions were characterized by MHC-I expression in blood vessels. Expression in both endothelial and microglial cells as well as in neurons (dysmorphic/dysplastic neurons) was observed in FCD II, TSC and GG cases. We observed perivascular and parenchymal T lymphocytes (CD8+, T-cytotoxic) with granzyme-B+granules in FCD IIb and TSC specimens. Albumin extravasation, with uptake in astrocytes, was observed in FCD IIb and GG cases. Conclusions:Our findings indicate a prominent upregulation of MHC-I as part of the immune response occurring in epileptogenic glioneuronal lesions. In particular, the induction of MHC-I in neuronal cells appears to be a feature of type II FCD, TSC and GG and may represent an important accompanying event of the immune response, associated with blood–brain barrier dysfunction, in these developmental lesions.
Keywords:Focal cortical dysplasia, Ganglioglioma, Cortical tubers, Neurons, Microglia, Major histocompatibility complex (MHC) class I
Introduction
Recent clinical and neuropathological evidence supports the critical role of a sustained inflammatory reaction in glioneuronal lesions with activation of both the innate and the adaptive immune response and involvement of different inflammatory pathways (for reviews see [1-4]). Interestingly, proinflammatory molecules have been shown to alter neuronal excitability and, in experimental models, to decrease the seizure threshold, contributing to neuronal cell death [2-4].
According to the current histopathological classifica-tion system [5], focal cortical dysplasia (FCD) has been classified into type I, characterized by cortical dyslami-nation (with three FCD subtypes according to the pat-tern of dyslamination), and type II, characterized by additional cytological abnormalities (FCD IIa with dys-morphic neurons and FCD IIb with dysdys-morphic neurons and balloon cells).
In a recent study [6], we confirmed the occurrence of complex inflammatory changes (involving both glial and neuronal cells) in FCD specimens and demonstrated that the severity of these changes is greater in FCD IIb than in specimens from patients with FCD I. The activation of components of the adaptive immunity, with the pres-ence of T lymphocytes (CD8+, T-cytotoxic/suppressor * Correspondence:[email protected]
1
Department of (Neuro)Pathology, Academic Medical Center, University of Amsterdam, Meibergdreef 9, Amsterdam 1105 AZ, The Netherlands 3
SEIN–Stichting Epilepsie Instellingen Nederland, Heemstede, The Netherlands
Full list of author information is available at the end of the article
immunophenotype), has also been mainly observed in FCD IIb specimens [6].
Whether these inflammatory changes represent a fea-ture common to different developmental glioneuronal lesions and whether induction of major histocompatibil-ity complex (MHC) class I molecules may be involved still needs to be clarified.
MHC-I molecules play a fundamental role in the immune system, in particular in the context of the adap-tive immune response, but have also been shown to have non-immune functions, being involved in the regulation of activity-dependent brain development and plasticity (for a review see [7]). Interestingly, glial and neuronal MHC-I upregulation has been observed in brain specimens from patients with Rasmussen’s encephalitis (a severe inflammatory epileptic encephalopathy of childhood) and intractable epilepsy and it has been sug-gested that it plays a critical role in antigen-specific cyto-toxicity [8,9].
The aim of the present study was to determine whether MHC-I is induced in focal glioneuronal lesions associated with intractable epilepsy. We evaluated the cellular distribution of MHC-I within a large spectrum of glioneuronal lesions, including focal cortical dysplasia type I, type IIa and type IIb, cortical tubers from patients with tuberous sclerosis complex (TSC) and ganglioglio-mas (GGs). Additionally, the presence of T lymphocytes with granzyme-B+granules and albumin immunoreactiv-ity within the lesion and its uptake into astrocytes were also analyzed.
Material and methods
Patients and controls
We examined a total of 48 surgical specimens: 6 FCD I (3, Ia; 3, Ib), 6 FCD IIa, 15 FCD IIb, 6 cortical tubers from patients with TSC and 15 GG. The cases included
in this study were obtained from the departments of neuropathology of the Academic Medical Center (versity of Amsterdam, UvA) in Amsterdam and the Uni-versity Medical Center in Utrecht (UMCU), the Netherlands. The clinical characteristics derived from the patients’medical records are summarized in Table 1. Patients underwent therapeutic surgical resection for re-fractory epilepsy and had, predominantly, medically in-tractable complex partial seizures. The postoperative seizure outcome was classified according to Engel [10]. All the patients included in our series did not have any apparent seizure activity in the 24 h before surgery. Patients who underwent implantation of strip and/or grid electrodes for chronic subdural invasive monitoring before resection were excluded from this study.
To grade the degree of FCD, we followed the inter-national consensus classification recently proposed [5]. All patients with cortical tubers fulfilled the diagnostic criteria for TSC [11]. For GG, we used the revised WHO classification of tumors of the central nervous system [12]. In five patients (one FCD, one TSC and three GG) a significant amount of perilesional tissue (normal-appearing cortex/white matter adjacent to the lesion) was resected as well. Brain tissue from patients with viral encephalitis (rabies encephalitis [13]; herpes simplex en-cephalitis (female, age at autopsy: 69 years) and Rasmus-sen’s encephalitis (n = 6; 4 females and 2 males; mean age at surgery: 20.6 years, range: 16 to 26) were also examined as positive controls. In addition, normal-appearing control cortex/white matter was obtained at autopsy from six young adult control patients (Table 1), without a history of seizures or other neurological dis-eases. All autopsies were performed within 12 h after death. Informed consent was obtained for the use of brain tissue. Tissue was obtained and used in a manner compliant with the Declaration of Helsinki.
Table 1 Summary of clinical findings for epilepsy patients and controls
Pathology type Number of cases
Gender (males/females)
Mean age at surgery (years/range)
Localization Mean duration of epilepsy (years/range)
FCD I 6 3/3 27.8 (19 to 39) 4 Temporal 7.7 (6 to 13)
2 Frontal
FCD IIa 6 3/3 24.3 (11 to 24) 3 Frontal 6.1 (2 to 11)
3 Temporal
FCD IIb 15 7/8 23.2 (17 to 41) 8 Temporal 7.8 (3 to 15)
7 Frontal
Cortical tubers (TSC) 6 3/3 17.8 (5 to 35) 3 Frontal 13.5 (2.8 to 34)
3 Temporal
2 Parietal
GG 15 8/7 29.2 (15 to 46) Temporal 7.8 (3 to 15)
Controls (no epilepsy) 6 3/3 30.1 (20 to 41) Temporal
Tissue preparation
Formalin-fixed, paraffin-embedded tissue samples (one representative paraffin block per case containing the complete lesion or the largest part of the lesion resected at surgery) were sectioned at 6μm and mounted on pre-coated glass slides (Star Frost, Waldemar Knittel GmbH, Braunschweig, Germany). Sections of all specimens were processed for hematoxylin eosin, luxol fast blue and Nissl stains as well as for immunocytochemical stainings for a number of neuronal and glial markers, which are described below.
Immunocytochemistry
The primary antibodies used in the study are summarized in Table 2. Single-label immunocytochemistry was devel-oped using the Powervision kit (Immunologic, Duiven, the Netherlands). 3,3-diaminobenzidine (Sigma, St Louis, USA) was used as the chromogen. Sections were counterstained with hematoxylin.
For double-labeling of MHC-I with GFAP, MAP-2 or pS6 (as well as of albumin with CD31 or GFAP and GrB with GFAP) sections were, after incubation with the pri-mary antibodies overnight at 4°C, incubated for 2 h at room temperature with Alexa FluorW 568-conjugated anti-rabbit and Alexa FluorW 488 anti-mouse immuno-globulin G (IgG) or anti-goat IgG (Molecular Probes, The Netherlands; 1:100). Sections were then analyzed using a laser scanning confocal microscope (Leica TCS Sp2, Wetzlar, Germany).
For double-labeling of MHC-I with NeuN, sections were incubated with the first primary antibody. Anti-MHC-I was visualized with a polymer-alkaline phosp-hatase (AP)-labeled anti-rabbit antibody (BrightVision #DPVM55AP, Immunologic, Duiven, The Netherlands) and Vector Red (AP substrate kit III, #SK-5100, Vector
labs, Burlingame, CA, USA) as the chromogen. To re-move the first primary antibody (MHC-I), the sections were incubated at 121°C in a citrate buffer (0.01 M, pH 6.0) for 10 min. Sections were then incubated for 1 h at room temperature with the second pri-mary antibody (NeuN). The second pripri-mary anti-bodies were visualized with poly-AP anti-rabbit antibody (BrightVision #DPVM55AP, Immunologic, Duiven, The Netherlands) and Vector Blue (AP sub-strate kit III, #SK-5300, Vector labs, Burlingame, CA, USA) as the chromogen.
Evaluation of immunostaining
All labeled tissue sections were evaluated by two inde-pendent observers blind to clinical data, for the presence or absence of various histopathological parameters and specific immunoreactivity for the different markers. Two representative sections per case were stained and assessed for the MHC-I and albumin. The intensity of the staining was evaluated as previously described [6,14], using a semi-quantitative scale ranging from 0 to 3 (0: negative; 1: weak; 2: moderate; 3: strong immunoreac-tivity). All areas of the specimen were examined and the score represents the predominant cell staining intensity found in each case. The approximate proportion of cells (microglia, neurons and endothelial cells/blood vessels) showing MHC-I immunoreactivity (1: single to 10%; 2: 11% to 50%; 3: >50%) was also scored to give informa-tion about the relative number (‘frequency’ score) of positive cells within the specimens with a malformation of cortical development. In the case of a disagreement, independent reevaluation was performed by both obser-vers to define the final score. As proposed before [6,15], the product of these two values (intensity and frequency scores) was taken to give the overall score
Table 2 Immunocytochemistry: primary antibodies
Antigen Primary antibody Source Dilution
Glial fibrillary acidic protein (GFAP) Polyclonal rabbit DAKO, Glostrup, Denmark 1:4,000
Neuronal nuclear protein (NeuN) Mouse clone MAB377 Chemicon, Temecula, CA, USA 1:2,000
HLA-DP, DQ, DR (MHC-II) Mouse clone CR3/43 DAKO, Glostrup, Denmark 1:1000
HLA-A, B, C (MHC-I) Mouse clone HC-10 Gift from Prof. J. Neefjes, NKI, the Netherlands 1:200
Vimentin Mouse clone V9 DAKO, Glostrup, Denmark 1:400
Neurofilament (NF) Mouse clone SMI311 Sternberger Monoclonals, Lutherville, MD, USA 1:1,000
Microtubule associated protein (MAP2) Mouse clone HM2 Sigma,St. Louis, IL, USA 1:100
Microtubule associated protein (MAP2) Polyclonal rabbit Millipore, Billerica, MA, USA 1:500
Phospho-S6 ribosomal protein (pS6) Polyclonal rabbit (Ser235/236; pS6) Cell Signaling Technology, Beverly, MA, USA; 1:50
CD68 Mouse clone PG-M1 DAKO, Glostrup, Denmark 1:200
CD31 Mouse clone JC70A DAKO, Glostrup, Denmark 1:10
Albumin Rabbit polyclonal DAKO, Glostrup, Denmark 1:20,000
(immunoreactivity total score), which is shown in Figure 1 (MHC-I) and Figure 2 (albumin). Neuronal cell bodies were differentiated from glia and glia-neuronal balloon cells or giant cells based on morphology.
To analyze the percentage of double-labeled cells positive for MHC-I and NeuN, digital images of eight representative fields per section (magnification 20 times) were collected (Leica DM5000B). Images were analyzed with a Nuance VIS-FL Multi-spectral Imaging System (Cambridge Research Instrumentation; Woburn, MA) as previously described [16,17]. The total number of cells stained with MHC-I or NeuN, as well as the number of cells double labeled with both were counted visually and percentages were calculated (expressed as mean ± SEM) of cells co-expressing NeuN and MHC-I.
Quantitative analysis was performed for GrB and the numbers of positive cells were quantified as previously described [15,18]. Quantitative analysis of the staining
intensity in endothelial cells was also performed. The relative optical density ratio (ODR) of endothelial cells immunolabeled with MHC-I was calculated as previ-ously described [19]. The degree of MHC-I expression in microvessels was evaluated by counting the numbers of vessels expressing the protein in two non-overlapping microscopic fields (field size 1 mm2) of control and FCD IIb specimens (n = 6 in each group). Results were expressed as a normalized mean ± SEM of MHC-I posi-tive vessels per microscopic field, taking into account the total number of microvessels in control and FCD specimens, assessed by counting the number of CD31-positive vessels in adjacent serial sections, as previously described [20].
Statistical analysis
Statistical analyses were performed with SPSS for Windows (SPSS 11.5, SPSS Inc., Chicago, IL, USA). The
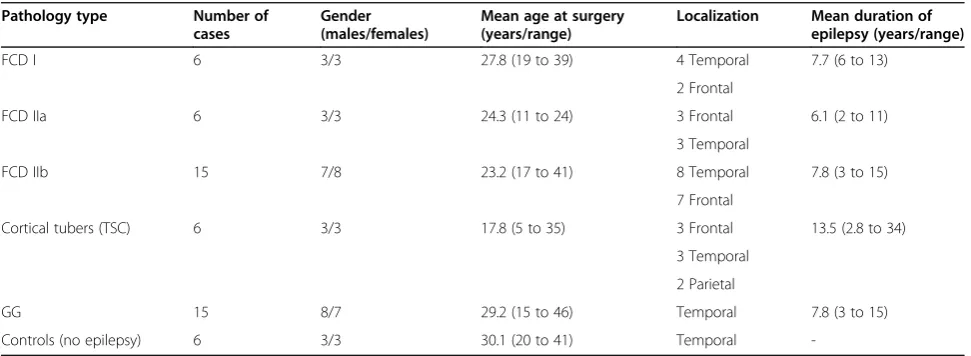
Figure 1Evaluation of MHC-I expression in control and FCD I, FCD IIa, FCD IIb, TSC and GG. (A)and(B): MHC-I immunoreactivity scores (total score; see material and methods for details) in microglial cells and neurons.(C): Graph showing percentages of neuronal cells
immunoreactive for NeuN and co-expressing MHC-I. Data are expressed as mean ± standard error of mean (SEM).P< 0.05 compared to FCD I and controls. FCD, focal cortical dysplasia; TSC, tuberous sclerosis complex; GG, ganglioglioma; MHC-I, major histocompatibility complex class I; ND, not determined; nd, not detectable.
two-tailed Student’s t-test was used to assess differences between groups. To assess differences between more than two groups a non-parametric Kruskal–Wallis test followed by a Mann–Whitney U test were used. Correl-ation between immunostaining (number of positive cells) and different clinical variables (duration of epilepsy, seiz-ure frequency, age at surgery, age at seizseiz-ure onset and epilepsy outcome) were assessed using the Spearman’s rank correlation test. A value of P< 0.05 was defined as being statistically significant.
Results
Case material and histological features
The clinical features of the cases included in this study are summarized in Table 1. All patients had a history of chronic pharmaco-resistant epilepsy. Age at surgery, seizure duration and seizure frequency were not statisti-cally different between patients with FCD I, FCD II and GG in this cohort. Postoperatively, 67% of patients in this cohort were completely seizure free. In this study, we excluded patients with a mild degree of cortical dys-plasia (mild malformation of cortical development). The FCD cases included displayed the histopathological fea-tures of FCD Ib or FCD IIa and IIb, according to the international consensus classification [5].
The histopathological features of the cortical tuber samples included cortical dyslamination, giant cells, dys-plastic neurons and astrogliosis [21,22]. TSC1 mutations were detected in one patient and TSC2 mutations in five patients. In agreement with previous studies [6,23-25], the expression of pS6 (indicating the activation of the mTOR signal transduction pathway) was observed within all tubers, and FCD II and GG samples in our co-hort. All of the 15 FCD IIb samples had a neuronal la-beling index (frequency score) greater than 50%. Of the 6 FCD IIa samples with pS6-positive neuronal cells, 3 (50%) had a labeling index between 1% and 10%, and the other 3 (50%) had a labeling index between 11% and 50%. In contrast, pS6 protein expression was not detected in FCD I cases, as in the normal control speci-mens. The number of HLA-DR (MHC-II) immunoreac-tive cells was not significantly different between FCD IIa and IIb in our cohort, but was higher compared to FCD I, as previously reported [6].
MHC-I expression in FCD I and II
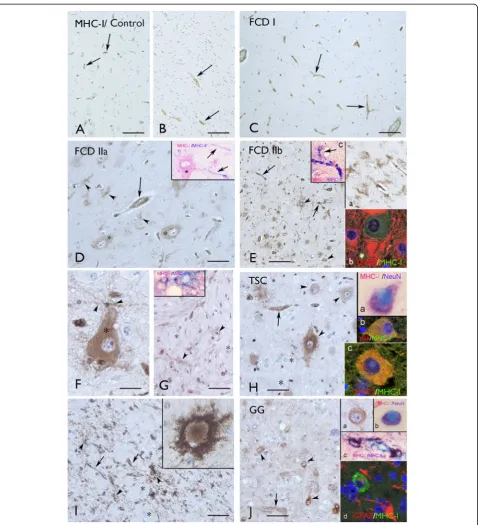
In the cortical autopsy of the human control, as well as in the normal-appearing cortex adjacent to the lesions (not shown), MHC-I was confined to blood vessels, and was not detected either in neurons or in glial cells in both cortex and white matter throughout all cortical layers (Figure 3A,B).
In agreement with previous observations, in both viral [13] and Rasmussen’s encephalitis [8,9] immunoreactivity
for MHC-I was also detected in lymphocytes, microglial cells, astrocytes and neurons (not shown).
In FCD I, MHC-I displayed an immunoreactivity pat-tern as in the controls, with expression in blood vessels, but no detectable immunoreactivity in glial or neuronal cells (Figure 3C and Figure 1A,B); in one case weak immunoreactivity was detected in a few microglial cells (Figure 1A).
In FCD IIa and IIb, consistent MHC-I expression was also observed in neurons and glial cells with the morph-ology of microglial cells (Figure 3D,E,F,G and Figure 1A, B). Double labeling confirmed MHC-I expression in cells of the microglial/macrophage lineage (HLA-DR positive cells; Figure 3 and inserts in 3E and 3G), in neurons (MAP-2 and NeuN positive cells; not shown), but not in astrocytes (Figure 3; insert (b) in 3E). The mean number of MHC-I positive neurons was found to be significantly higher in FCD IIb than in FCD IIa, whereas no signifi-cant differences were detected compared to TSC and GG specimens (Figure 1C). We did not detect MHC-I expression in balloon cells (Figure 3E,G). MHC-I immu-noreactivity in microvessel endothelium was not signifi-cantly different compared to the control cortex (autopsy; Table 3, and/or the perilesional cortex, not shown). No significant correlation was found between the increased MHC-I staining in neurons in FCD II and the different clinical variables. However, a positive correlation was detected between the MHC-I staining in microglia and the duration of epilepsy (Spearman’s rank correlation co-efficient for FCD II,r= 0.865 withP< 0.05).
MHC-I expression in cortical tubers (TSC)
The expression pattern of MHC-I in cortical tubers of TSC patients resembled that observed in FCD II, with MHC-I positive blood vessels, neurons and microglial cells, but not astrocytes (Figure 3H,I and Figure 1A,B). The mean number of MHC-I positive neurons was found to be significantly higher in TSC than in FCD IIa, whereas no significant differences were detected com-pared to FCD IIb and GG specimens (Figure 1C). A large majority of giant cells were negative for MHC-I, only occasionally (in two cases) was MHC-I expression detected in sporadic giant cells within the white matter (Figure 3I). No significant correlation was found between the increased MHC-I staining in neurons in TSC and the different clinical variables. However, a positive correlation was detected between the MHC-I staining in microglia in TSC and the duration of epilepsy (Spearman’s rank correlation coefficient for TSC, r= 0.835 withP< 0.05).
MHC-I expression in GG
not in tumor astrocytes (Figure 3J and Figure 1A,B). The mean number of MHC-I positive neurons was found to be significantly higher in GG than in FCD IIa, whereas no significant differences were detected compared to FCD IIb and TSC specimens (Figure 1C).
No significant correlation was found between the increased MHC-I staining in neurons in GG and the different clinical variables. However, a positive correl-ation was detected between the MHC-I staining in microglia and the duration of epilepsy (Spearman’s rank correlation coefficient for GG,r= 0.847 withP< 0.05).
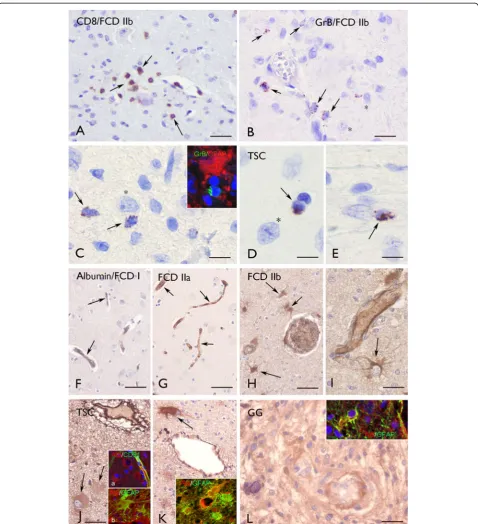
T lymphocytes with granzyme B+granules
In agreement with previous observations [6,26,27], inflammatory infiltrates in glioneuronal lesions, such as FCD IIb, contain T lymphocytes (CD8+, T-cytotoxic immunophenotype) (Figure 4A).
In FCD IIb and TSC, we detected CD8 positive cells with granzyme-B+ granules. These cells were often peri-vascularly located, but occasionally in the vicinity (or in close opposition) to dysmorphic neurons and astrocytes (Figure 4B,C,D,E and Figure 2A). Granzyme B immunor-eactivity was not detected in FCD I or IIa, and only occasionally (one case) in GG specimens (Figure 2A).
Albumin extravasation and immunoreactivity in astrocytes
Alterations in blood–brain barrier permeability were detected using albumin immunocytochemistry in FCD IIb, TSC and GG specimens (Figure 4H,I,J,K,L and Figure 2B). In FCD IIb and TSC specimens, albumin immunoreactivity, with diffuse cytoplasmatic staining, was detected in perilesional astrocytes and in perivascu-larly located balloon/giant cells in FCD IIb and TSC specimens (Figure 4H,I,J,K); double labeling confirmed co-localization in GFAP positive cells (Figure 4J,K). Strong albumin immunoreactivity was observed within GG specimens in tumor astrocytes (Figure 4L and Figure 2B).
Discussion
In the present study we provide evidence of neuronal and microglial MHC-I expression in epileptogenic glio-neuronal lesions. The glio-neuronal expression of MHC-I
was, however, only detected in FCD II, but not in FCD I specimens or in the perilesional region (despite the absence of significant differences in seizure frequency and duration). Interestingly, MHC-I expression in neu-rons was significantly higher in FCD IIb compared to FCD IIa and the large majority of balloon/giant cells did not express detectable levels of MHC-I. These observa-tions confirm the difference between FCD I and II [6], suggest some differences between IIa and IIb and indi-cate that induction of MHC-I is not simply an effect of seizure activity.
Several studies demonstrate that expression of MHC-I can be upregulated in glia and neurons in response to different types of challenges, including injury, infections (chronic and acute), central administration of endotoxins and exposure to different cytokines ([28-33] reviewed in [7]). Cytokines have been show to differentially regulate MHC-I induction in neurons [31,34,35]. Previous studies have demonstrated prominent expression of components of the IL-1R/TLR signaling pathways in neuronal cells in epileptogenic glioneuronal lesions [6,26,27,36]. Signaling through these pathways leads to activation of the tran-scription factor, nuclear factor-kappa B (NF-κB) [37]. Interestingly, it has been suggested that activation of NF-κB plays a role in induction of MHC-I [38,39]. Thus, NF-κB-dependent mechanisms of regulation may contribute to the more prominent MHC-I expression detected in FCD II (associated with consistent activation of IL-1R/TLR signaling pathways [6]) compared to FCD I.
Endogenous peptides presented by MHC-I molecules (called MHC-I peptides (MIPs) or the immunopepti-dome) represent the key to self/non-self-discrimination by cells of the immune system. In this respect, a recent study confirmed previous observations indicating that the immune system is tolerant to MIPs expressed at physiological levels but may promote immune responses towards self MIPs present in excessive amounts [40,41]. This may be important in the context, of the suggestion that neuronal MHC-I expression mediates removal of dysfunctional neurons [30]. The study by Caron et al. also suggests that changes in mTOR signaling can affect the expression of MHC-I and the repertoire of MIPs presented by MHC-I [41]. These observations highlight the complexity of MHC-I regulation and indicate the need for further analysis of the effect of mTOR modula-tion in lesions (such as FCD II, TSC and GG) in which this pathway is involved. Interestingly, a recent study suggests a novel viral etiology for FCD IIB [42], which could explain the constitutive activation of mTOR, as well as the induction of MHC-I, in this focal malforma-tion of cortical development.
Interestingly, neuronal MHC-I expression has been reported in Rasmussen’s encephalitis and it has been
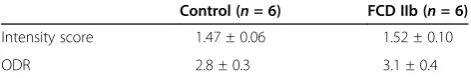
Table 3 MHC-I immunoreactivity in microvessel endotheliuma
Control (n= 6) FCD IIb (n= 6)
Intensity score 1.47 ± 0.06 1.52 ± 0.10
ODR 2.8 ± 0.3 3.1 ± 0.4
a
Figure 4Granzyme B (GrB) and albumin immunoreactivity (IR).(A)–(E) Granzyme B (GrB) IR. (A) Perivascular CD8 positive cells (arrows) for FCD IIb. (B) and (C) GrB positive cells (arrows) for FCD IIb around blood vessels and in the vicinity of dysmorphic neurons (asterisks). Insert in (C) shows a GrB positive cell near an astrocyte (GFAP positive). (D) and(E) GrB positive cells in cortical tubers (arrows) for TSC, also the vicinity of a dysmorphic neuron (asterisk in (D)). (F)–(L) Albumin IR. For FCD I (F) and FCD IIa (G) there is an absence of glial IR. Albumin IR was detected in blood vessels (arrows). (H) and (I) FCD IIb: Albumin IR was detected in perivascular astrocytes (arrows). (J) and (K) TSC: Strong albumin IR was detected within the tuber in the perivascular region with expression in giant cells (arrows). Insert (a) in (J) shows albumin in cells surrounding a blood vessel (stained with CD31). Insert (b) in (J) and the insert in (K) show co-localization of albumin with GFAP within tubers. (L) For GG, there is strong albumin IR within the tumor. The insert shows co-localization of albumin with GFAP in tumor astrocytes. Scale bars (A): 40μm; (B): 25
suggested that it plays a critical role in antigen-specific cytotoxicity [8]. MHC-I expression is necessary for antigen-specific cytotoxicity mediated by CD8+ lympho-cytes [43]. In this context, we also detected CD8+ T lymphocytes with GrB in FCD IIB and TSC specimens in the vicinity of neurons. The possible contribution of a MHC-I restricted immune response to neuronal injury, occurring in patients with developmental path-ologies and intractable epilepsy [18,44], requires further investigation.
MHC-I was also was found to be expressed in reactive microglial cells. Upregulation in microglial cells has been shown in both multiple sclerosis (MS) [45] and Rasmus-sen’s encephalitis [8,9]. Interestingly, the microglial ex-pression of MHC-I was significantly higher in FCD II compared to FCD I, reflecting the more prominent acti-vation of microglial cells observed in FCD II specimens [6]. Moreover, MHC-I expression in microglia correlated positively with the duration of epilepsy, suggesting that the upregulation of MHC-I in these cells may also occur later in epileptogenesis.
Astrocytes did not display MHC-I immunoreactivity. Expression of MHC-I in astrocytes has also not been observed in MS lesions [45]. Thus upregulation of MHC-I in astrocytes appears to represent a specific fea-ture of Rasmussen’s encephalitis and an MHC-I res-tricted T-cell response has been suggested as critically contributing to the occurrence of the astrocytic degener-ation observed in this pathology [9].
MHC-I expression was not detected in balloon cells in FCD IIb and in the large majority of giant cells in TSC. Interestingly, expression of MHC-I has been detected in the giant cells from different types of TSC-associated brain lesions in fetal cases ranging from 23 to 34 gestational weeks (GW) [46], indicating developmental changes in the phenotype of giant cells. MHC-I expression in these cells early in development may reflect their role as antigen-presenting cells and may account for the dynamic changes occurring early in development in TSC lesions.
We did not detect changes in the expression levels of MHC-I in endothelial cells within the different lesions examined. However, lesions (FCD IIB, TSC and GG) with prominent inflammatory changes and MHC-I upre-gulation in neurons and microglia displayed evidence of alterations in blood–brain barrier permeability, with al-bumin extravasation and uptake in astrocytes. These observations confirm previous findings for TSC [26], highlighting its similarity to FCD IIB and the differences with FCD I.
Our findings distinguish type I from type II FCD and indicate a prominent upregulation of MHC-I in neurons and microglial cells as part of the immune response oc-curring in epileptogenic glioneuronal lesions, such as FCD II, TSC and GG.
Abbreviations
AP: alkaline phosphatase; FCD: focal cortical dysplasia; GFAP: glial fibrillary acidic protein; GG: ganglioglioma; GrB: granzyme B; HLA: human leukocyte antigen; IgG: immunoglobulin G; IR: immunoreactivity; MHC: major histocompatibility complex; MIP: MHC-I peptide; MS: multiple sclerosis; NF-κB: nuclear factor-kappa B; NeuN: neuronal nuclear protein; ODR: optical density ratio; SEM: standard error of mean; TSC: tuberous sclerosis complex.
Competing interest
None of the authors has any conflict of interest to disclose.
Authors’contributions
Immunohistochemistry and analysis of the data were performed by AP, AI and JA. EA helped with the analysis of the data. AI and AP helped EA in drafting and preparing the manuscript for submission. The overall experimental design was conceived and supervised by EA. WS and PR helped in the selection and collection of brain tissues. All authors read and approved the final manuscript.
Acknowledgements
This work was supported by the National Epilepsy Fund,‘Power of the Small’, the Hersenstichting Nederland (NEF 09–05), EU FP7 project NeuroGlia (grant agreement number 202167) and KIKA (Stichting Kinderen Kankervrij; EA, AP). We confirm that we have read the Journal’s position on issues involved in ethical publication and affirm that this report is consistent with those guidelines.
Author details
1Department of (Neuro)Pathology, Academic Medical Center, University of
Amsterdam, Meibergdreef 9, Amsterdam 1105 AZ, The Netherlands. 2Departments of Pathology and Neurosurgery /Rudolf Magnus Institute for
Neuroscience, University Medical Center Utrecht, Utrecht, The Netherlands. 3SEIN–Stichting Epilepsie Instellingen Nederland, Heemstede, The Netherlands.4Swammerdam Institute for Life Sciences, Center for Neuroscience, University of Amsterdam, Amsterdam, The Netherlands.
Received: 14 November 2012 Accepted: 10 January 2013 Published: 24 January 2013
References
1. Aronica E, Crino PB:Inflammation in epilepsy: clinical observations. Epilepsia2011,52(Suppl 3):26–32.
2. Vezzani A, French J, Bartfai T, Baram TZ:The role of inflammation in epilepsy.Nature Reviews Neurology2011,7:31–40.
3. Vezzani A, Auvin S, Ravizza T, Aronica E:Glia-neuronal interactions in ictogenesis and epileptogenesis: role of inflammatory mediators. In Jasper’s Basic Mechanisms of the Epilepsies. 4th edition. Edited by Noebels JL, Avoli M, Rogawski MA, Olsen RW, Delgado-Escueta AV. Bethesda, MD: 2012. 4. Aronica E, Ravizza T, Zurolo E, Vezzani A:Astrocyte immune responses in
epilepsy.Glia2012,60:1258–1268.
5. Blumcke I, Thom M, Aronica E, Armstrong DD, Vinters HV, Palmini A, Jacques TS, Avanzini G, Barkovich AJ, Battaglia G,et al:The clinicopathologic spectrum of focal cortical dysplasias: a consensus classification proposed by an ad hoc Task Force of the ILAE Diagnostic Methods Commission.Epilepsia2011,52:158–174.
6. Iyer A, Zurolo E, Spliet WGM, van Rijen PC, Baayen JC, Gorter JA, Aronica E: Evaluation of the innate and adaptive immunity in type I and type II focal cortical dysplasias.Epilepsia2010,51(9):1763–1773.
7. Boulanger LM:MHC class I in activity-dependent structural and functional plasticity.Neuron Glia biology2004,1:283–289.
8. Bien CG, Bauer J, Deckwerth TL, Wiendl H, Deckert M, Wiestler OD, Schramm J, Elger CE, Lassmann H:Destruction of neurons by cytotoxic T cells: a new pathogenic mechanism in Rasmussen’s encephalitis.
Ann Neurol2002,51:311–318.
9. Bauer J, Elger CE, Hans VH, Schramm J, Urbach H, Lassmann H, Bien CG: Astrocytes are a specific immunological target in Rasmussen’s encephalitis.Ann Neurol2007,62:67–80.
10. Engel JJ:Outcome with respect to epileptic seizures. InSurgical Treatment of the Epilepsies. Edited by Engel JJ. New York: Raven Press; 1993:609–621. 11. Gomez M, Sampson J, Whittemore V:The Tuberous Sclerosis Complex. Oxford:
12. Louis DN, Ohgaki H, Wiestler OD, Cavanee WK:WHO Classification of Tumours of the Central Nervous System. Lyon: IARC; 2007.
13. van Thiel PP, de Bie RM, Eftimov F, Tepaske R, Zaaijer HL, van Doornum GJ, Schutten M, Osterhaus AD, Majoie CB, Aronica E,et al:Fatal human rabies due to Duvenhage virus from a bat in Kenya: failure of treatment with coma-induction, ketamine, and antiviral drugs.PLoS Neglected Tropical Diseases [electronic resource]2009,3:428.
14. Ravizza T, Boer K, Redeker S, Spliet WG, van Rijen PC, Troost D, Vezzani A, Aronica E:The IL-1beta system in epilepsy-associated malformations of cortical development.Neurobiol Dis2006,24:128–143.
15. Aronica E, Gorter JA, Redeker S, Ramkema M, Spliet WG, van Rijen PC, Leenstra S, Troost D:Distribution, characterization and clinical significance of microglia in glioneuronal tumours from patients with chronic intractable epilepsy.Neuropathol Appl Neurobiol2005,31:280–291. 16. van der Loos CM:Multiple immunoenzyme staining: methods and
visualizations for the observation with spectral imaging.J Histochem Cytochem2008,56:313–328.
17. Boer K, Troost D, Timmermans W, Gorter JA, Spliet WG, Nellist M, Jansen F, Aronica E:Cellular localization of metabotropic glutamate receptors in cortical tubers and subependymal giant cell tumors of tuberous sclerosis complex.Neuroscience2008,156:203–215.
18. Maldonado M, Baybis M, Newman D, Kolson DL, Chen W, McKhann G 2nd, Gutmann DH, Crino PB:Expression of ICAM-1, TNF-alpha, NF kappa B, and MAP kinase in tubers of the tuberous sclerosis complex.Neurobiol Dis2003,14:279–290.
19. Aronica E, Gorter JA, Redeker S, van Vliet EA, Ramkema M, Scheffer GL, Scheper RJ, van der Valk P, Leenstra S, Baayen JC,et al:Localization of breast cancer resistance protein (BCRP) in microvessel endothelium of human control and epileptic brain.Epilepsia2005,46:849–857. 20. Airas L, Lindsberg PJ, Karjalainen-Lindsberg ML, Mononen I, Kotisaari K,
Smith DJ, Jalkanen S:Vascular adhesion protein-1 in human ischaemic stroke.Neuropathol Appl Neurobiol2008,34:394–402.
21. Mizuguchi M, Takashima S:Neuropathology of tuberous sclerosis.Brain Dev2001,23:508–515.
22. DiMario FJ Jr:Brain abnormalities in tuberous sclerosis complex.J Child Neurol2004,19:650–657.
23. Baybis M, Yu J, Lee A, Golden JA, Weiner H, McKhann G 2nd, Aronica E, Crino PB:mTOR cascade activation distinguishes tubers from focal cortical dysplasia.Ann Neurol2004,56:478–487.
24. Schick V, Majores M, Engels G, Hartmann W, Elger CE, Schramm J, Schoch S, Becker AJ:Differential Pi3K-pathway activation in cortical tubers and focal cortical dysplasias with balloon cells.Brain Pathology2007, 17:165–173.
25. Boer K, Troost D, Timmerman W, Spliet WGM, van Rijen PC, Aronica E: Pi3K-mTOR signaling and AMOG expression in epilepsy-associated glioneuronal tumors.Brain Pathology2010,20:234–244.
26. Boer K, Jansen F, Nellist M, Redeker S, van den Ouweland AM, Spliet WG, van Nieuwenhuizen O, Troost D, Crino PB, Aronica E:Inflammatory processes in cortical tubers and subependymal giant cell tumors of tuberous sclerosis complex.Epilepsy Res2008,78:7–21.
27. Aronica E, Boer K, Becker A, Redeker S, Spliet WG, van Rijen PC, Wittink F, Breit T, Wadman WJ, Lopes da Silva FH,et al:Gene expression profile analysis of epilepsy-associated gangliogliomas.Neuroscience2008, 151:272–292.
28. Maehlen J, Schroder HD, Klareskog L, Olsson T, Kristensson K:Axotomy induces MHC class I antigen expression on rat nerve cells.Neurosci Lett1988,92:8–13. 29. Pereira RA, Tscharke DC, Simmons A:Upregulation of class I major
histocompatibility complex gene expression in primary sensory neurons, satellite cells, and Schwann cells of mice in response to acute but not latent herpes simplex virus infection in vivo.J Exp Med1994, 180:841–850.
30. Neumann H, Cavalie A, Jenne DE, Wekerle H:Induction of MHC class I genes in neurons.Science1995,269:549–552.
31. Neumann H, Schmidt H, Cavalie A, Jenne D, Wekerle H:Major histocompatibility complex (MHC) class I gene expression in single neurons of the central nervous system: differential regulation by interferon (IFN)-gamma and tumor necrosis factor (TNF)-alpha.J Exp Med1997,185:305–316.
32. Kimura T, Griffin DE:The role of CD8(+) T cells and major
histocompatibility complex class I expression in the central nervous system of mice infected with neurovirulent Sindbis virus.J Virol2000, 74:6117–6125.
33. Foster JA, Quan N, Stern EL, Kristensson K, Herkenham M:Induced neuronal expression of class I major histocompatibility complex mRNA in acute and chronic inflammation models.J Neuroimmunol2002,131:83–91. 34. Neumann H:Control of glial immune function by neurons.Glia2001,
36:191–199.
35. Neumann H:The immunological microenvironment in the CNS: implications on neuronal cell death and survival.J Neural Transm Suppl 2000,59:59–68.
36. Boer K, Crino PB, Gorter JA, Nellist M, Jansen FE, Spliet WG, van Rijen PC, Wittink F, Breit T, Troost D,et al:Gene expression analysis of tuberous sclerosis complex cortical tubers reveals increased expression of adhesion and inflammatory factors.Brain Pathol2010,20:704–719. 37. Oeckinghaus A, Hayden MS, Ghosh S:Crosstalk in NF-kappaB signaling
pathways.Nat Immunol2011,12:695–708.
38. Kesson AM, Cheng Y, King NJ:Regulation of immune recognition molecules by flavivirus, West Nile.Viral immunology2002,15:273–283. 39. Forloni M, Albini S, Limongi MZ, Cifaldi L, Boldrini R, Nicotra MR, Giannini G,
Natali PG, Giacomini P, Fruci D:NF-kappaB, and not MYCN, regulates MHC class I and endoplasmic reticulum aminopeptidases in human neuroblastoma cells.Cancer Res2010,70:916–924.
40. Schild H, Rotzschke O, Kalbacher H, Rammensee HG:Limit of T cell tolerance to self proteins by peptide presentation.Science1990, 247:1587–1589.
41. Caron E, Vincent K, Fortier MH, Laverdure JP, Bramoulle A, Hardy MP, Voisin G, Roux PP, Lemieux S, Thibault P, Perreault C:The MHC I immunopeptidome conveys to the cell surface an integrative view of cellular regulation.Mol Syst Biol2011,7:533.
42. Chen J, Tsai V, Parker WE, Aronica E, Baybis M, Crino PB:Detection of human papillomavirus in human focal cortical dysplasia type IIB. Ann Neurology2012,72:881–892.
43. Christinck ER, Luscher MA, Barber BH, Williams DB:Peptide binding to class I MHC on living cells and quantitation of complexes required for CTL lysis.Nature1991,352:67–70.
44. Choi J, Nordli DR Jr, Alden TD, DiPatri A Jr, Laux L, Kelley K, Rosenow J, Schuele SU, Rajaram V, Koh S:Cellular injury and neuroinflammation in children with chronic intractable epilepsy.J Neuroinflammation2009,6:38. 45. Gobin SJ, Montagne L, Van Zutphen M, Van Der Valk P, Van Den Elsen PJ,
De Groot CJ:Upregulation of transcription factors controlling MHC expression in multiple sclerosis lesions.Glia2001,36:68–77.
46. Prabowo AS, Anink JJ, Lammens M, Nellist M, van den Ouweland AM, Adle-Biassette H, Sarnat HB, Flores-Sarnat L, Crino PB, Aronica E:Fetal brain lesions in tuberous sclerosis complex: TORC1 activation and inflammation.Brain Pathology2012,23:45–59.
doi:10.1186/1742-2094-10-12
Cite this article as:Prabowoet al.:Differential expression of major
histocompatibility complex class I in developmental glioneuronal lesions.Journal of Neuroinflammation201310:12.
Submit your next manuscript to BioMed Central and take full advantage of:
• Convenient online submission
• Thorough peer review
• No space constraints or color figure charges
• Immediate publication on acceptance
• Inclusion in PubMed, CAS, Scopus and Google Scholar
• Research which is freely available for redistribution