M E T H O D O L O G Y
Open Access
CloVR-ITS: Automated internal transcribed spacer
amplicon sequence analysis pipeline for the
characterization of fungal microbiota
James Robert White
*, Cynthia Maddox, Owen White, Samuel V Angiuoli and W Florian Fricke
*Abstract
Background:Besides the development of comprehensive tools for high-throughput 16S ribosomal RNA amplicon
sequence analysis, there exists a growing need for protocols emphasizing alternative phylogenetic markers such as those representing eukaryotic organisms.
Results:Here we introduce CloVR-ITS, an automated pipeline for comparative analysis of internal transcribed spacer (ITS) pyrosequences amplified from metagenomic DNA isolates and representing fungal species. This pipeline performs a variety of steps similar to those commonly used for 16S rRNA amplicon sequence analysis, including preprocessing for quality, chimera detection, clustering of sequences into operational taxonomic units (OTUs), taxonomic assignment (at class, order, family, genus, and species levels) and statistical analysis of sample groups of interest based on user-provided information. Using ITS amplicon pyrosequencing data from a previous human gastric fluid study, we demonstrate the utility of CloVR-ITS for fungal microbiota analysis and provide runtime and cost examples, including analysis of extremely large datasets on the cloud. We show that the largest fractions of reads from the stomach fluid samples were assigned to Dothideomycetes, Saccharomycetes, Agaricomycetes and Sordariomycetes but that all samples were dominated by sequences that could not be taxonomically classified. Representatives of the Candida genus were identified in all samples, most notablyC. quercitrusa, while sequence reads assigned to the Aspergillus genus were only identified in a subset of samples. CloVR-ITS is made available as a pre-installed, automated, and portable software pipeline for cloud-friendly execution as part of the CloVR virtual machine package (http://clovr.org).
Conclusion:The CloVR-ITS pipeline provides fungal microbiota analysis that can be complementary to bacterial 16S rRNA and total metagenome sequence analysis allowing for more comprehensive studies of environmental and host-associated microbial communities.
Keywords:Internal transcribed spacer (ITS), Fungal microbiota, Automated sequence analysis pipeline, Cloud computing
Background
The advancement of massively parallel next-generation sequencing technologies has led to the ability to deeply sample complex microbial communities through se-quencing of targeted phylogenetic marker genes [1] and whole-genome shotgun DNA [2]. While the 16S riboso-mal RNA (rRNA) gene has been a major point of focus for researchers describing bacterial and archaeal
communities, significantly less effort has been devoted to markers of fungal organisms and the characterization of fungal components of microbial communities.
The fungal tree of life continues to be explored and refined, and currently, in contrast to 16S rRNA studies, there is little community consensus on conserved se-quence markers suitable for broad phylogenetic classifi-cations of eukaryotic organisms or reasonable diversity thresholds to describe eukaryotic taxa at the species or genus-level [3-5]. Recent studies have begun to explore fungal diversity through amplification of the internal transcribed spacer (ITS) region of the eukaryotic rRNA
* Correspondence:[email protected];[email protected] Institute for Genome Sciences, University of Maryland School of Medicine, BioPark II - 801 West Baltimore Street, Baltimore, MD 21201, USA
operon [6-16], but there remains a need for community-accepted standards and more rigorous sequence analysis protocols. The internal transcribed spacers ITS1 and ITS2 are the two elements of the eukaryotic rRNA cis-tron separating the 18S, 5.8S, and 28S rRNA genes, re-spectively. RNA polymerase 1 synthesizes this cistron as a single long transcript, and internal spacers are subse-quently removed from the functional ribosomal RNA elements. Typically, the “ITS region” refers to the con-tiguous region of ITS1, the 5.8S gene, and ITS2 (see Additional file 1: Figure S1 for a diagram). Because this region can be amplified across a broad range of fungal organisms, using methodologies developed and tested for 16S rRNA amplicon sequence analysis as a reference bears the potential to introduce comparable tools for the characterization of the fungal microbiota [17].
Here we present CloVR-ITS, a standard operating pro-cedure (SOP) for ITS amplicon sequence analysis for fungal diversity studies. This protocol includes prepro-cessing of multiplexed pyrosequences, de novo chimera detection and removal using UCHIME, and high-quality post-filtered sequence alpha and beta-diversity analyses. CloVR-ITS has been designed to effectively process se-quence data representing any contiguous segment of the ITS region (i.e. ITS1 or ITS2) and can perform compara-tive analysis of hundreds of samples. Based on available reference data, we determined robust sequence identity thresholds to approximate the taxonomic distribution and diversity of fungal communities at multiple levels. In order to make our SOP widely available with minimal software installation requirements and capable of run-ning on a cloud-based infrastructure, we have imple-mented our protocol within the Cloud Virtual Resource (CloVR) framework [18,19]. The CloVR framework guar-antees CloVR-ITS users reproducible analysis results, establishes software transparency, and provides cloud-based options for pipeline execution. We illustrate the utility of our pipeline by analyzing fungal ITS data gen-erated from human gastric aspirates of nine patients with variable health status. CloVR-ITS can be run on realistic data in a commercial cloud for a very low price, potentially saving labs the significant investment of add-itional computing software and hardware.
Methods
Taxonomic reference database
To generate a broad ITS reference set for taxonomic as-signment of ITS amplicon sequences, we first obtained 213,357 reference ITS2 sequences from the ITS2 data-base [20,21], together with taxonomic information and corresponding NCBI identification (GI) numbers. The ITS2 database utilizes a comprehensive Hidden Markov Model (HMM) approach for identification of ITS2-specific regions from GenBank sequence entries. Next,
full fasta sequence entries from the NCBI-NT database corresponding to the GI numbers were extracted using thefastacmdtool [22]. This allows for longer portions of the entire rRNA cistron region (including ITS1, ITS2, 18S, 5.8S, and 28S genes) to be incorporated in the cus-tom database when available. For the final set of anno-tated sequences, we required sequences not to represent uncultured, environmental, or unclassified taxa. In sev-eral cases, the taxonomic lineages of the reference sequences were incomplete, i.e. they were lacking assign-ments at some of the taxonomic levels (Example:“No class level; Zygophyllales; Krameriaceae; Krameria; Krameria ixine”). In these cases, missing fields in the reference database were filled with, for example, "No_class" or “No_order”. All reference sequences were clustered using a 100% identity threshold to identify identical sequences, which were not removed from the database. The final cus-tom database (named clovr-itsdb version 1.0) consists of 154,050 sequences representing over 8,440 genera and over 60,000 species. The 154,050 sequences belonged to 121,993 clusters that contained between one (107,397 clusters) and 103 identical sequences. In many cases, sequences in a cluster differed in length such that the shorter sequences perfectly matched a subsequence of a longer one. These differences in length can impact the e-values of BLASTN search results used for taxonomic as-signment of ITS amplicons (see below). Of the 14,596 clusters with multiple sequences, 4,966 clusters contained sequences with different annotations, typically at the spe-cies level; 905 showed differences at the genus level. Use of fasta (sequence) and txt (taxonomic assignments) file formats for clovr-itsdb allows for easy database expansion, as additional ITS amplicon sequence data become avail-able, as well as database curation, e.g. in cases where iden-tical reference sequences have different annotations.
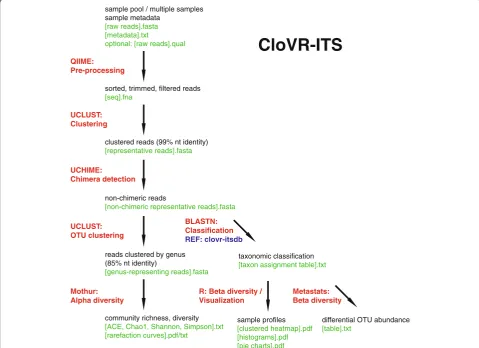
CloVR-ITS workflow
Preprocessing
CloVR-ITS begins by performing file existence and consistency checks for correct formatting, then de-multiplexing and quality filtering sequences as needed using the QIIME [23] script split_libraries.py with the following non-default parameter choices:
min-seq-length 100 (sets the minimum sequence length to 100 bp)
max-seq-length 2000 (sets the maximum sequence length to 2000 bp)
barcode-type variable_length (disables barcode corrections and allows for unique barcodes with varying lengths)
max-homopolymer 8 (sets the maximum homopolymer length allowed within the sequence to 8 bp)
max-ambig 0 (sets the maximum number of ambiguous bases allowed within the sequence to 0).
As in all CloVR pipelines, parameters can be adjusted by experienced users in the pipeline configuration file as documented on the CloVR project website (http://clovr. org).
Chimera detection and removal
To assist in chimera detection and downstream taxo-nomic analysis, sequences passing quality filtering are clustered into high-similarity groups using a 99% se-quence identity threshold with UCLUST [24] (allowing for reverse complement comparisons). The longest elem-ent in each cluster is selected as cluster-represelem-enting se-quence. Formatted representative sequences are then submitted to UCHIME [25] (usingde novomode with de-fault parameters). All identified chimeric representatives and their associated sequences are removed from consid-eration before the next step in the pipeline.
CloVR-ITS
taxonomic classification [taxon assignment table].txt reads clustered by genus
(85% nt identity)
[genus-representing reads].fasta BLASTN: Classification REF: clovr-itsdb sample pool / multiple samples
sample metadata [raw reads].fasta [metadata].txt
optional: [raw reads].qual
clustered reads (99% nt identity) [representative reads].fasta
non-chimeric reads
[non-chimeric representative reads].fasta sorted, trimmed, filtered reads
[seq].fna
UCLUST: Clustering QIIME: Pre-processing
differential OTU abundance [table].txt
R: Beta diversity / Visualization
sample profiles [clustered heatmap].pdf [histograms].pdf [pie charts].pdf UCHIME:
Chimera detection
UCLUST: OTU clustering
community richness, diversity [ACE, Chao1, Shannon, Simpson].txt [rarefaction curves].pdf/txt
Mothur: Alpha diversity
Metastats: Beta diversity
Genus-level diversity analysis
Sequences passing the chimera detection step are re-clustered into genus-level operational taxonomic units using UCLUST with an 85% identity threshold, based on our evaluation of available reference data (see below). Using components from the Mothur package [26], alpha-diversity analysis is performed for each sample in-cluding computation of rarefaction curves and ecological statistics such as ACE and Chao1 estimators, Shannon entropy, and the Simpson index.
Taxonomic and statistical analysis
All non-chimeric representative sequences from the 99% identity clusters are searched against the curated data-base of ITS reference sequences from known species (clovr-itsdb v1.0) using BLASTN [22] with an e-value threshold of 1e-5. Each sequence is assigned to the taxo-nomic lineage of the best BLAST alignment covering at least 90% of the query sequence length and matching with a minimum identity of 90%, 85%, 75%, 70%, and 60% identity for species, genus, family, order, and class-level assignments, respectively (see justification below). BLAST result tables are provided in the CloVR-ITS pipeline output and contain up to 10 matching reference sequences per query sequence. Representatives without alignments of sufficient coverage or identity are denoted as “Unclassified.” Assignments to representatives are then propagated across the corresponding clusters, so that every clustered sequence is consistently annotated. Classification results are processed to detect differentially abundant taxa between groups of interest at multiple taxonomic levels (class, order, family, genus, species) using the Metastats program [27] with default parameters. Additional visualiza-tions of taxonomic annotavisualiza-tions are computed using R-based scripts and include stacked histograms, pie charts, and heatmap clusterings.
Gastric fluid sample data
ITS1 regions were amplified as part of a larger project to study the microbiota composition of human gastric acid samples (von Rosenvinge et al. in preparation). The data sets supporting the results of this article are available in the NCBI Short Read Archive repository [SRA: SRA056502; http://www.ncbi.nlm.nih.gov/sra/]. Briefly, adult patients with clinically indicated upper endoscopy were enrolled in the study (University of Maryland School of Medi-cine IRB Protocol #HP-00045881) and gastric fluid aspi-rated and collected in a sterile container during the procedure. All subjects provided their informed consent. Demographics, clinical features, and endoscopic indica-tions and findings were recorded (Additional file 2: Table S1). Samples were immediately put on ice and within sev-eral hours aliquoted (0.5 mL), combined with RNAlater (0.5 mL; Qiagen) and frozen at −80°C for subsequent
processing. Samples were centrifuged at 5,000 × g for 8 min and the supernatant discarded. Cell pellets were re-suspended in 0.6 mL of 1X Phosphate Buffered Saline (PBS) and processed as described previously [28]. Cell lysis was initiated with 5μL of lysozyme (10 mg/mL; Amresco), 13μL of mutanolysin (11.7 U/μL; Sigma-Aldrich), and 3μL of lysostaphin (4.5 U/μL; Sigma-Aldrich) and samples incubated at 37°C for 30 min. Samples underwent a sec-ond enzyme incubation at 56°C for 45 min, after the addition of 10μL Proteinase K (20 mg/mL: Research Pro-ducts International), 50 μL 10% SDS, and 2 μL RNase (10 mg/mL). After the enzyme treatments cells were disrupted by bead beating in tubes with Lysing Matrix B (0.1 mm silica spheres, MP Biomedicals), at 6 m/s for 40 s at room temperature in a FastPrep-24 (MP Biomedicals). The resulting crude lysate was processed using the ZR Fecal DNA mini-prep kit (Zymo) according to the manu-facturer's recommendation. The samples were eluted with 100μL of ultra pure water into separate tubes. The DNA concentrations in the samples were measured using the Quant-iT PicoGreen dsDNA assay kit from Molecular Probes (Invitrogen).
Genomics Resource Center at the Institute for Genome Sciences, University of Maryland School of Medicine, using protocols recommended by the manufacturer as amended by the Center. ITS sequences were screened for human DNA by searching against the NCBI NT database using BLASTN (with word size 26). Six sequence reads from a single patient sample matched human non-ITS DNA with >97% identity along >90% of their length and were removed from the analysis.
Local and cloud-scale pipeline runs
The local desktop used for CloVR-ITS pipeline tests was a 64-bit quad core (Intel Xeon E5520 2.27 GHz CPU) with 4 GB of RAM. The local version of CloVR (CloVR release candidateclovr-1.0-RC4) was run using VMware Player version 2.0.5 build-109488 (http://vmware.com) configured to a single CPU and 2048 MB of main mem-ory. Amazon EC2 allows for a variety of instance types with variable CPU speeds, available RAM and disk storage (http://aws.amazon.com/ec2/#instance). Earlier work has demonstrated that c1.xlarge instances are cost-effective for many bioinformatics applications such as BLAST and HMMER [19,31]. The c1.xlarge instance type provides 8 virtual CPU cores, 7 GB RAM per instance, and 1,690 GB of local temporary disk storage. In this study, each pipeline was run on a separate cluster within the cloud and all instances (master or otherwise) utilized the c1.xlarge instance type. Direct costs of running CloVR-ITS on Amazon EC2 were computed using cluster per-formance charts, visualized with the Ganglia tool (http:// ganglia.sourceforge.net), which describe cluster size and utilization over time. CloVR-ITS pipeline runtimes were obtained using the Ergatis workflow system [32].
To test the scalability of CloVR-ITS using larger data-sets, we simulated a 1-million read dataset by randomly sampling sequences (with replacement) from the human gastric fluid dataset, and randomly creating sequencing errors using a simple uniform error rate of 0.8%. This allowed us to create a larger realistic dataset with similar diversity to the original human gastric dataset. For each of 10 samples, 100,000 sequences were simulated.
Results and discussion CloVR implementation
The CloVR-ITS SOP for ITS amplicon sequence analysis for fungal diversity studies was implemented within the Cloud Virtual Resource (CloVR) framework [18,19]. CloVR (http://clovr.org) is an open source virtual appliance that provides automated bioinformatics workflows for mi-crobial genomics applications [18]. CloVR integrates gen-omic tools in a robust, user-friendly, and fully automated software package with optional support for cloud comput-ing platforms. This tool is distributed as a portable virtual machine that is launched on a desktop or laptop and
optionally manages additional resources available on the cloud to perform large-scale sequence analysis. Implemen-tation of the ITS analysis pipeline into CloVR provides the advantage of portability across multiple platforms, access to pre-installed and pre-configured software tools bundled into an automated analysis pipeline, and seamless support of online academic (http://diagcomputing.org) or com-mercial (http://aws.amazon.com) cloud computing ser-vices. Several steps of the CloVR-ITS pipeline are parallelizable (chimera detection, BLAST), allowing for multi-CPU support on a cloud-based infrastructure. In order to take full advantage of the cloud multi-CPU cap-abilities, the CloVR framework supports auto-scaling for BLAST processes.
Parameter selection
In an effort to select practical parameter values for our methodology, including sequence similarity thresholds for taxonomic classification, we performed a preliminary di-versity study of ITS2 regions from known fungal species, that is, the ITS portion surrounded by the 5.8S and 28S rRNA genes [33]. Our source for reference sequences was the ITS2 database, which utilizes a robust Hidden Markov Model (HMM) based method for identification of ITS2-specific regions [20,21]. We extracted 213,357 taxonomic-ally classified sequences corresponding to 783 genera and 1,898 distinct eukaryotic species.
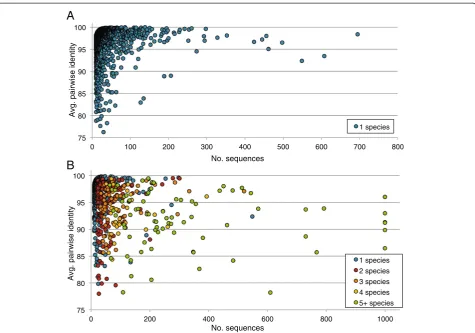
From this reference set, we created datasets for each specific taxonomic group ranging from 10 to 1,000 sequences. In cases where more than 1,000 sequences were available for a particular taxon, we randomly selected 1,000 sequences from the full set. Within each taxon grouping, we then performed multiple sequence align-ments using MUSCLE with default parameters [34] and computed pairwise identities using custom Perl scripts be-tween all sequences within each MUSCLE alignment to determine the average pairwise identity between any two sequences in the same taxon. Only those columns of the multiple sequence alignment containing <5% gaps were used for the pairwise identity calculations. Figure 2 dis-plays the results of our analysis at the species, genus, and order levels. It is important to note that the amplified ITS fragment contains intergenic regions, which are subject to different selective pressures than rRNA genes and, thus, are expected to evolve at different speeds. Therefore, simi-larity thresholds typically applied to rRNA genes, e.g. 97% identity for 16S rRNA genes between members of the same species, are not suitable for ITS amplicon sequence analysis.
To ensure that an 85% sequence identity threshold pro-vided reasonable separation between most genera, we also computed pairwise identities between randomly selected sequences from different genera using BLASTN. Ultimately the vast majority of genera-specific represen-tatives could not be practically aligned using BLASTN beyond 30 base pairs, indicating substantial sequence heterogeneity, including indels, among ITS2 sequences from different genera. This sequence variation argues against use of tree-based phylogenetic distance predic-tions that have been employed in 16S rRNA analysis.
However, we did detect reasonable homogeneity among 211 (0.07%) pairwise alignments. Those ITS2 sequences from different genera that aligned over at least 90% of one of the sequences’lengths, showed a me-dian alignment identity of 91%, which suggests a poten-tial bias toward inadvertent collapse of some genera into clusters. We examined the 201 unique genera that met this alignment criterion, and found that 75% had a sig-nificant alignment with only one or two other genera.
However in 25 genera (12.4%), we found significant align-ments with five to seven other genera. As an example, the representative sequence for the genus Ascochyta had alignments of 98%, 97%, 97%, 96%, 96%, and 96% identity over 90% of the query with representatives for the genera Peyronellaea, Epicoccum, Dothiorella, Stagonosporopsis, Phoma, and Boeremia, respectively. Five of these genera are members of the Didymellaceae family, and all are members of the Dothideomycetes class. Examining the overall similarity within each of these genera individually, we observed a range from 82.6% to 99.8%.
These findings clearly demonstrate that based on cur-rently available ITS reference data, a universal set of se-quence identity thresholds for taxonomic assignment of ITS amplicons cannot be determined. This could be due either to misclassified entries within the fungalclovr-itsdb reference database, e.g. incorrect assignment of related species to different genera, or indicate that the fungal ITS region does not provide sufficient resolution to differenti-ate between several closely reldifferenti-ated taxonomic groups.
75 80 85 90 95 100
0 100 200 300 400 500 600 700 800
A
vg. pairwise identity
1 species
75 80 85 90 95 100
0 200 400 600 800 1000
A
vg. pairwise identity
1 species 2 species 3 species 4 species 5+ species
B
A
No. sequences
No. sequences
Based on these evaluations, we implemented our ITS protocol to provide reasonable taxonomic resolution and to utilize an 85% identity threshold for clustering sequences into genus-level operational taxonomic units, and to assign sequences to a taxonomic lineage based on similar sequence identity and coverage criteria (see Methods). Our selections are consistent with other val-idation studies examining species and genus-level diver-sity using fungal ITS sequences [3,35-38].
CloVR-ITS performance and cost
To examine the costs and resources needed to run the CloVR-ITS pipeline on a local desktop computer (2048 MB of RAM) and on the commercial Amazon EC2 cloud (c1.xlarge instance type; see Methods for details), we ran an ITS1 amplicon dataset representing fungal communities within a larger human gastric microbiome study (von Rosenvinge et al. in prepar-ation). Samples from patients averaged 14,965 reads per sample with mean read length of 267 bp and a total number of raw sequence reads of 134,682. CloVR-ITS pipelines completed in less than 2 h on the local desktop and required only 41 min (including data transfer time) to run on Amazon EC2, at a cost of $1.32 in on-demand rental time.
In order to simulate significantly larger CloVR-ITS runs, we also created a dataset of 1 million sequences simulated from our original gastric dataset to run locally and on Amazon EC2 (see Methods for details). Including data transfer time, CloVR-ITS required 3 hours 23 min-utes to complete locally, and less than 2 hours when the pipeline was executed on Amazon EC2. Importantly, CloVR-ITS auto-scaled from a single instance on Amazon EC2 to a two-node cluster with a total of 16 CPUs during the chimera detection and BLAST steps of the pipeline. The overall cost from start to finish for this run was $1.98, indicating that even larger datasets can be analyzed by CloVR-ITS at negligible cost in a commercial cloud environment.
Analysis of gastric fluid ITS dataset
To illustrate the utility of our pipeline, we describe the CloVR-ITS analysis results of the previously mentioned human gastric fluid study (von Rosenvingeet al.in prep-aration). For this study, stomach fluid was collected from a diverse patient population and used for DNA iso-lation and ITS1-specific PCR amplification (see Additional file 1: Figure S1 for a diagram of primer locations). A summary of the patient metadata is given in Additional file 2: Table S1. All results described in this section are based on outputs generated directly from the CloVR-ITS pipeline including numerous visualizations (see Figures 3 and 4).
Of 134,682 total raw DNA sequences used as input to the pipeline, 133,763 (99.3%) passed initial quality checking. Using UCHIME for chimera assessment (see Methods), a total of 1,235 reads were identified as chimeric and removed by the pipeline. Table S2 describes the overall summary statistics of quality-filtering and chimera detec-tion for each sample (see Addidetec-tional file 3: Table S2). After trimming of primer and barcode sequences, amplicon sizes ranged from 71 to 569 bp (median trimmed length 253 bp), with all samples showing a similar distribution of size ranges, consistent with the visual control of the ITS amplification results using gel electrophoresis prior to se-quencing. Passing sequences (average 14,725 per sample) were clustered into 195 genus-level OTUs using the 85% identity threshold; six of these 195 OTUs were found in all nine patient samples.
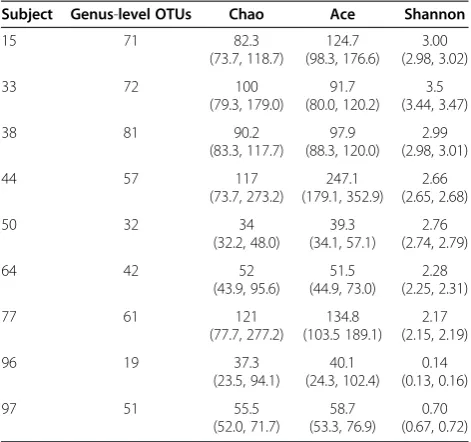
Rarefaction analysis revealed a substantial range of di-versity among patient samples (Figure 3A) with a sample from a HIV/AIDS patient (#96) treated prophylactically with trimethoprim/sulfamethoxazole (co-trimoxazole) against Pneumocystis pneumonia (PCP) exhibiting the least diverse fungal microbiota. Co-trimoxazole is an ef-fective broad-spectrum antibiotic, which also exhibits anti-fungal activities [39]. Reduced complexity of the fungal microbiota in this patient sample was also indi-cated by ecological estimators computed by the CloVR-ITS pipeline (e.g. Chao1 and ACE richness estimators, and the Shannon diversity index; see Table 1).
CloVR-ITS calculates estimators for each sample inde-pendently without controlling for sampling depth across all samples.
Using the BLAST-based CloVR-ITS taxonomic classi-fication of representative ITS amplicons clustered at 99% identity (see Methods for details), we found all samples to be dominated by sequences that could not be confi-dently assigned to a taxonomic lineage. On average 71% of these representative sequences within a sample could not be classified (Figure 3B). Of the taxonomically-assigned sequences, the largest fractions belonged to Dothideomycetes and Saccharomycetes (both average 8%), Agaricomycetes (average 6%) and Sordariomycetes (average 3%) (see Additional file 4: Table S3 for full results).
NT (e-value threshold: 1e-5). Manual inspection of these BLAST hits suggested that the vast majority matched fungal 18S rRNA/ITS spacer regions when searched against NCBI NT, supporting the notion that the ITS1F/ ITS2 amplification products were generally specific to the ITS region.
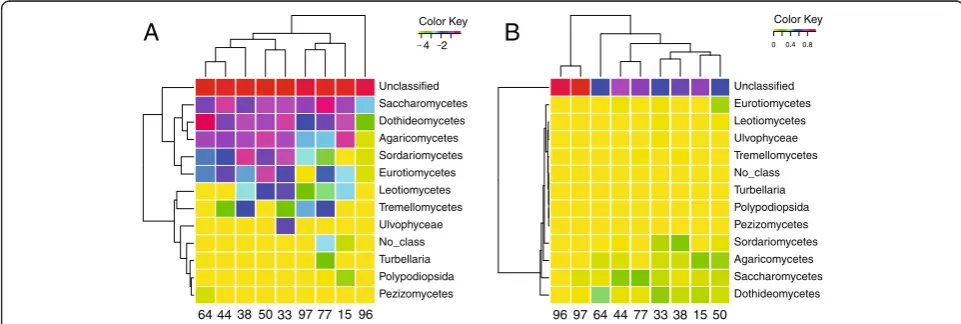
As part of its graphical output, CloVR-ITS produces heatmaps with hierarchical clusterings of taxonomic abundances using either standard relative abundances or log-normalized proportions. Log-normalized proportions provide the advantage of (i) allowing for more equivalent weighting of high- and low-abundance taxa for cluster-ing purposes, and (ii) makcluster-ing differences between low-abundance taxa more easily visible (compare Figure 4A
and B). Clustering samples based on taxonomic abun-dances, we observed different groupings depending on whether or not we used a log-normalized transformation (Figure 4). Clustering did not reveal obvious correlations between fungal microbiota compositions and specific pa-tient groups (see Additional file 2: Table S1 for clinical features of subjects). However, statistical validation of the results is difficult due to low sample numbers and highly variable patient backgrounds.
At lower taxonomic levels we found substantial dispar-ities in diversity among the samples. A total of 12 classes, 30 orders, 47 families, 82 genera, and 143 species were assigned by our BLAST-based procedure (see Additional file 4: Table S3). At the species level, sequences from each
0 5000 10000 15000 20000
02
0
4
0
6
0
8
0
Sequences_sampled
Number of O
TUs
33 38 44 50 77 97 15 64 96
A
B
% of hits
0 20 40 60 80 100
Unclassified Ulvophyceae Turbellaria Tremellomycetes Sordariomycetes Saccharomycetes Polypodiopsida Pezizomycetes No_class Leotiomycetes Eurotiomycetes Dothideomycetes Agaricomycetes
33 38 44 50 77 97
15 64 96
Figure 3CloVR-ITS rarefaction and histogram visualizations for gastric fluid data.Example outputs of the CloVR-ITS pipeline for the human gastric fluid data: (A) rarefaction curves of genus-level OTUs (85% identity threshold for clustering) and (B) stacked histograms displaying relative abundances at the taxonomic class level (60% identity threshold over 90% of the sequence).
Pezizomycetes Polypodiopsida Turbellaria No_class Ulvophyceae Tremellomycetes Leotiomycetes Eurotiomycetes Sordariomycetes Agaricomycetes Dothideomycetes Saccharomycetes Unclassified
4 2 Color Key
33 38
44 50 97 77 15
64 96
Dothideomycetes Saccharomycetes Agaricomycetes Sordariomycetes Pezizomycetes Polypodiopsida Turbellaria No_class Tremellomycetes Ulvophyceae Leotiomycetes Eurotiomycetes Unclassified
0 0.40.8 Color Key
33 38 44 77 50 97 64 15 96
B
A
subject could be assigned to Candida species, particularly to the speciesC.quercitrusa(Table 2); the sample from the HIV/AIDS patient treated with co-trimoxazole was the only patient sample without significantC.quercitrusa con-tent (1 sequence). This sample, however, contained 32 C. dubliniensissequences, a species which was only found in one other patient sample (#77) at low counts (1 sequence). Although we cannot provide robust statistical support for the association of C. dubliniesis with HIV/AIDS gastric fluid samples, it is intriguing thatC.dubliniensis is a less virulent and less metabolically versatile close relative ofC. albicans[40] which has been associated with bloodstream and other infections particularly in immunocompromised individuals, including HIV/AIDS patients [41]. We also
found differences in Aspergillus abundance (Table 3), with several samples being devoid of Aspergillus assignments altogether (such as the low-diversity sample #96), while in others between 0.3 and 1.2% were assigned to different Aspergillus species includingA.versicolor.
Overall, based on the species-level classification, CloVR-ITS analysis of the gastric fluid samples suggests that fungal species in the stomach most likely originated from environmental sources, such as mold and degrad-ing plant material, e.g. Cladosporium spp., Aureobasi-dium pullulans, Schizophyllum commune, which were found in nine, eight and six of the nine samples, respect-ively. It is possible that at least some of the fungal spe-cies identified in the stomach were originally collected from the environment through the respiratory tract or ingested via vegetable food components.
Conclusions
CloVR-ITS is the first automated comparative analysis protocol for ITS amplicon pyrosequencing-based fungal microbiota analysis. Implemented in the CloVR virtual machine (http://clovr.org), it can be run time- and cost-efficiently in cloud-based infrastructures. Similarity thresholds for the assignment of ITS amplicons to known taxonomic lineages have been determined and included into CloVR-ITS based on the evaluation of available fungal sequence data. As an example for the utility of CloVR-ITS, we have presented the analysis of human gastric fluid samples, which demonstrates that fungal species typically associated with environmental or plant and human host settings most likely collected through food, the nasal and oral cavities and the lungs can be identified in the stomach. Large fractions of un-classified gastric fluid ITS amplicon sequence data sug-gest that the fungal microbiota of the stomach and probably also of other human-associated environments is still mostly underrepresented in available ITS sequence collections. The CloVR-ITS pipeline provides complemen-tary analysis for bacterial 16S rRNA and total metagen-ome sequence analysis protocols such as CloVR-16S and Table 1 Ecological estimators of alpha-diversity for
human gastric fungal communities, including 95% confidence intervals (shown in parentheses)
Subject Genus-level OTUs Chao Ace Shannon
15 71 82.3
(73.7, 118.7)
124.7 (98.3, 176.6)
3.00 (2.98, 3.02)
33 72 100
(79.3, 179.0)
91.7 (80.0, 120.2)
3.5 (3.44, 3.47)
38 81 90.2
(83.3, 117.7)
97.9 (88.3, 120.0)
2.99 (2.98, 3.01)
44 57 117
(73.7, 273.2)
247.1 (179.1, 352.9)
2.66 (2.65, 2.68)
50 32 34
(32.2, 48.0)
39.3 (34.1, 57.1)
2.76 (2.74, 2.79)
64 42 52
(43.9, 95.6)
51.5 (44.9, 73.0)
2.28 (2.25, 2.31)
77 61 121
(77.7, 277.2)
134.8 (103.5 189.1)
2.17 (2.15, 2.19)
96 19 37.3
(23.5, 94.1)
40.1 (24.3, 102.4)
0.14 (0.13, 0.16)
97 51 55.5
(52.0, 71.7)
58.7 (53.3, 76.9)
0.70 (0.67, 0.72)
Table 2 Overview of sequence reads from all samples assigned to known Candida species
Patient samples
#15 #33 #38 #44 #50 #64 #77 #96 #97
Candida (genus) 995 1193 700 2632 159 401 4008 33 841
C.albicans 8 0 42 0 0 202 2 0 509
C.dubliniensis 0 0 0 0 0 0 1 32 0
C.ergatensis 1 0 0 0 0 0 0 0 0
C.metapsilosis 0 32 0 0 0 0 0 0 0
C.parapsilosis 0 0 2 57 0 1 2 0 1
C.quercitrusa 986 1107 656 2573 159 198 3999 1 331
C.sp.3TMS-2011 0 54 0 0 0 0 0 0 0
C.sp.JJP-2009a 0 0 0 0 0 0 1 0 0
C.tropicalis 0 0 0 2 0 0 3 0 0
Table 3 Overview of sequence reads from all samples assigned to known Aspergillus species
Patient samples
#15 #33 #38 #44 #50 #64 #77 #96 #97
Aspergillus (genus) 46 87 0 52 70 0 8 0 1
A.penicillioides 1 0 0 0 0 0 0 0 0
A.ruber 0 0 0 0 0 0 1 0 0
A.sp.6 SMR-2010 0 0 0 0 0 0 0 0 1
A.sp.F55 0 86 0 19 0 0 0 0 0
A.sp.F9 0 1 0 0 0 0 0 0 0
CloVR-Metagenomics [19], QIIME [23], MG-RAST [42], Galaxy [43] and others, allowing for broader studies of en-vironmental and host-associated microbial communities. We expect to refine and expand CloVR-ITS as the re-search community adopts more standards regarding ITS sequence analysis of fungal communities.
Availability of supporting data
The data sets supporting the results of this article are available in the NCBI Short Read Archive repository [SRA: SRA056502; http://ncbi.nlm.nih.gov/sra/].
Additional files
Additional file 1:Figure S1.Overview of the ITS region and primers used in this study. Within the eukaryotic rRNA cistron, the genes coding for 18S, 5.8S, and 28S rRNA are separated by two transcribed spaces (ITS1 and ITS2). RNA polymerase 1 synthesizes this cistron as a single long transcript, and internal spacers are subsequently removed from the functional ribosomal RNA elements. In this study, we refer to the“ITS region”as the contiguous region of ITS1, the 5.8S gene, and ITS2. The human gastric fluid dataset analyzed in this paper were amplified with the ITS1/ITS2F primer pair encompassing the ITS1 region.
Additional file 2:Table S1.Demographics and clinical features of the enrolled patients. This table gives an overview of the patient demographic and clinical feature metadata associated with the human gastric fluid samples analyzed in this paper.
Additional file 3:Table S2.Pipeline sequence analysis statistics for human gastric ITS dataset. This table provides an overview of the number of sequences from each human gastric fluid sample that passed CloVR-ITS quality filtering and chimera detection stages.
Additional file 4:Table S3.ITS taxonomic assignment tables. Summary tables of ITS taxonomic classifications for human gastric fluid samples.
Additional file 5:Figure S2.Query coverage versus alignment identity for top-scoring BLASTN hits against clovr-itsdb v.1.0 for high-identity cluster representatives from the human gastric fluid dataset. High-identity (99% threshold) cluster representatives were searched against clovr-itsdb v.1.0 to determine the potential for taxonomic assignment. Here we plot the alignment identity and query coverage of the top-scoring hit for each representative.
Competing interests
The authors declare that they have no competing interests.
Authors’contributions
JRW and WFF conceived the study design. CM performed the experimental work and provided technical support. JRW carried out the implementation and testing. JRW and WFF performed the analysis. SVA provided technical support. JRW and WFF wrote the manuscript with help from CM, OW, and SVA. All authors read and approved the final manuscript.
Acknowledgements
This research was supported by funds from the National Human Genome Research Institute, NIH/ NHGRI, under Contract No. 5RC2HG005597-02 and the National Science Foundation, NSF, under Contract No. 0949201.
Received: 19 July 2012 Accepted: 21 November 2012 Published: 4 February 2013
References
1. Costello EK, Lauber CL, Hamady M, Fierer N, Gordon JI, Knight R:Bacterial community variation in human body habitats across space and time.
Science2009,326:1694–1697.
2. Rusch DB, Halpern AL, Sutton G, Heidelberg KB, Williamson S, Yooseph S, Wu D, Eisen JA, Hoffman JM, Remington K,et al:The sorcerer II global
ocean sampling expedition: Northwest Atlantic through Eastern tropical Pacific.PLoS Biol2007,5:e77.
3. Ryberg M, Nilsson RH, Kristiansson E, Topel M, Jacobsson S, Larsson E: Mining metadata from unidentified ITS sequences in GenBank: a case study in Inocybe (Basidiomycota).BMC Evol Biol2008,8:50.
4. White JR, Navlakha S, Nagarajan N, Ghodsi MR, Kingsford C, Pop M: Alignment and clustering of phylogenetic markers–implications for microbial diversity studies.BMC Bioinformatics2010,11:152. 5. Mullineux T, Hausner G:Evolution of rDNA ITS1 and ITS2 sequences and
RNA secondary structures within members of the fungal genera Grosmannia and Leptographium.Fungal Genet Biol: FG & B2009,46:855–867. 6. Bellemain E, Carlsen T, Brochmann C, Coissac E, Taberlet P, Kauserud H:ITS
as an environmental DNA barcode for fungi: an in silico approach reveals potential PCR biases.BMC Microbiol2010,10:189.
7. Porter TM, Golding GB:Are similarity- or phylogeny-based methods more appropriate for classifying internal transcribed spacer (ITS) metagenomic amplicons?New Phytol2011,192:775–782.
8. Fierer N, Breitbart M, Nulton J, Salamon P, Lozupone C, Jones R, Robeson M, Edwards RA, Felts B, Rayhawk S,et al:Metagenomic and small-subunit rRNA analyses reveal the genetic diversity of bacteria, archaea, fungi, and viruses in soil.Appl Environ Microbiol2007,73:7059–7066. 9. Lucero ME, Unc A, Cooke P, Dowd S, Sun S:Endophyte microbiome
diversity in micropropagated Atriplex canescens and Atriplex torreyi var griffithsii.PLoS One2011,6:e17693.
10. Park HK, Ha MH, Park SG, Kim MN, Kim BJ, Kim W:Characterization of the fungal microbiota (mycobiome) in healthy and dandruff-afflicted human scalps.PLoS One2012,7:e32847.
11. Zhang E, Tanaka T, Tajima M, Tsuboi R, Nishikawa A, Sugita T: Characterization of the skin fungal microbiota in patients with atopic dermatitis and in healthy subjects.Microbiol Immunol2011,55:625–632. 12. Orgiazzi A, Lumini E, Nilsson RH, Girlanda M, Vizzini A, Bonfante P, Bianciotto
V:Unravelling soil fungal communities from different mediterranean land-use backgrounds.PLoS One2012,7:e34847.
13. Kruger D, Kapturska D, Fischer C, Daniel R, Wubet T:Diversity measures in environmental sequences are highly dependent on alignment quality– data from ITS and new LSU primers targeting basidiomycetes.PLoS One
2012,7:e32139.
14. Liguori G, Lucariello A, Colella G, De Luca A, Marinelli P:Rapid identification of Candida species in oral rinse solutions by PCR.J Clin Pathol2007, 60:1035–1039.
15. Paulino LC, Tseng CH, Strober BE, Blaser MJ:Molecular analysis of fungal microbiota in samples from healthy human skin and psoriatic lesions.J Clin Microbiol2006,44:2933–2941.
16. Ghannoum MA, Jurevic RJ, Mukherjee PK, Cui F, Sikaroodi M, Naqvi A, Gillevet PM:Characterization of the oral fungal microbiome (mycobiome) in healthy individuals.PLoS Pathog2010,6:e1000713.
17. Dollive S, Peterfreund GL, Sherrill-Mix S, Bittinger K, Sinha R, Hoffmann C, Nabel C, Hill DA, Artis D, Bachman MA,et al:A tool kit for quantifying eukaryotic rRNA gene sequences from human microbiome samples.
Genome Biol2012,13:R60.
18. Angiuoli SV, Matalka M, Gussman A, Galens K, Vangala M, Riley DR, Arze C, White JR, White O, Fricke WF:CloVR: A virtual machine for automated and portable sequence analysis from the desktop using cloud computing.
BMC Bioinformatics2011,12:356.
19. Angiuoli SV, White JR, Matalka M, White O, Fricke WF:Resources and costs for microbial sequence analysis evaluated using virtual machines and cloud computing.PLoS One2011,6:e26624.
20. Koetschan C, Hackl T, Muller T, Wolf M, Forster F, Schultz J:ITS2 database IV: Interactive taxon sampling for internal transcribed spacer 2 based phylogenies.Mol Phylogenet Evol2012.
21. Chen S, Yao H, Han J, Liu C, Song J, Shi L, Zhu Y, Ma X, Gao T, Pang X,et al: Validation of the ITS2 region as a novel DNA barcode for identifying medicinal plant species.PLoS One2010,5:e8613.
22. Altschul SF, Madden TL, Schaffer AA, Zhang J, Zhang Z, Miller W, Lipman DJ: Gapped BLAST and PSI-BLAST: a new generation of protein database search programs.Nucleic Acids Res1997,25:3389–3402.
23. Caporaso JG, Kuczynski J, Stombaugh J, Bittinger K, Bushman FD, Costello EK, Fierer N, Pena AG, Goodrich JK, Gordon JI,et al:QIIME allows analysis of high-throughput community sequencing data.Nat Methods2010,7:335–336. 24. Edgar RC:Search and clustering orders of magnitude faster than BLAST.
25. Edgar RC, Haas BJ, Clemente JC, Quince C, Knight R:UCHIME improves sensitivity and speed of chimera detection.Bioinformatics2011,27:2194–2200. 26. Schloss PD, Westcott SL, Ryabin T, Hall JR, Hartmann M, Hollister EB,
Lesniewski RA, Oakley BB, Parks DH, Robinson CJ,et al:Introducing mothur: open-source, platform-independent, community-supported software for describing and comparing microbial communities.Appl Environ Microbiol
2009,75:7537–7541.
27. White JR, Nagarajan N, Pop M:Statistical methods for detecting differentially abundant features in clinical metagenomic samples.PLoS Comput Biol2009,5:e1000352.
28. Ravel J, Gajer P, Abdo Z, Schneider GM, Koenig SS, McCulle SL, Karlebach S, Gorle R, Russell J, Tacket CO,et al:Vaginal microbiome of reproductive-age women.Proc Natl Acad Sci U S A2011,108(Suppl 1):4680–4687. 29. Landlinger C, Baskova L, Preuner S, Willinger B, Buchta V, Lion T:
Identification of fungal species by fragment length analysis of the internally transcribed spacer 2 region.Eur J Clin Microbiol Infect Dis2009, 28:613–622.
30. Landlinger C, Preuner S, Willinger B, Haberpursch B, Racil Z, Mayer J, Lion T: Species-specific identification of a wide range of clinically relevant fungal pathogens by use of Luminex xMAP technology.J Clin Microbiol
2009,47:1063–1073.
31. Wilkening J, Wilke A, Desai N, Meyer DF:Using clouds for metagenomics: a case study. InIEEE Cluster. New Orleans: IEEE; 2009.
32. Orvis J, Crabtree J, Galens K, Gussman A, Inman JM, Lee E, Nampally S, Riley D, Sundaram JP, Felix V,et al:Ergatis: a web interface and scalable software system for bioinformatics workflows.Bioinformatics2010, 26:1488–1492.
33. Koetschan C, Forster F, Keller A, Schleicher T, Ruderisch B, Schwarz R, Muller T, Wolf M, Schultz J:The ITS2 Database III–sequences and structures for phylogeny.Nucleic Acids Res2010,38:D275–279.
34. Edgar RC:MUSCLE: multiple sequence alignment with high accuracy and high throughput.Nucleic Acids Res2004,32:1792–1797.
35. Schoch CL, Seifert KA, Huhndorf S, Robert V, Spouge JL, Levesque CA, Chen W:Nuclear ribosomal internal transcribed spacer (ITS) region as a universal DNA barcode marker for Fungi.Proc Natl Acad Sci U S A2012, 109:6241–6246.
36. Nilsson RH, Kristiansson E, Ryberg M, Hallenberg N, Larsson K-H: Intraspecific ITS Variability in the Kingdom Fungi as Expressed in the International Sequence Databases and Its Implications for Molecular Species Identification.Evol Bioinformatics Online2008,4:193–201. 37. Woo PC, Leung SY, To KK, Chan JF, Ngan AH, Cheng VC, Lau SK, Yuen KY:
Internal transcribed spacer region sequence heterogeneity in Rhizopus microsporus: implications for molecular diagnosis in clinical
microbiology laboratories.J Clin Microbiol2010,48:208–214. 38. Boyanton BL Jr, Luna RA, Fasciano LR, Menne KG, Versalovic J:DNA
pyrosequencing-based identification of pathogenic Candida species by using the internal transcribed spacer 2 region.Arch Pathol Lab Med2008, 132:667–674.
39. Edge MD, Rimland D:Community-acquired bacteremia in HIV-positive patients: protective benefit of co-trimoxazole.AIDS1996,10:1635–1639. 40. Jackson AP, Gamble JA, Yeomans T, Moran GP, Saunders D, Harris D, Aslett
M, Barrell JF, Butler G, Citiulo F,et al:Comparative genomics of the fungal pathogens Candida dubliniensis and Candida albicans.Genome Res2009, 19:2231–2244.
41. Khan Z, Ahmad S, Joseph L, Chandy R:Candida dubliniensis: an appraisal of its clinical significance as a bloodstream pathogen.PLoS One2012, 7:e32952.
42. Meyer F, Paarmann D, D'Souza M, Olson R, Glass EM, Kubal M, Paczian T, Rodriguez A, Stevens R, Wilke A,et al:The metagenomics RAST server - a public resource for the automatic phylogenetic and functional analysis of metagenomes.BMC Bioinformatics2008,9:386.
43. Kosakovsky Pond S, Wadhawan S, Chiaromonte F, Ananda G, Chung WY, Taylor J, Nekrutenko A:Windshield splatter analysis with the Galaxy metagenomic pipeline.Genome Res2009,19:2144–2153.
doi:10.1186/2049-2618-1-6
Cite this article as:Whiteet al.:CloVR-ITS: Automated internal transcribed spacer amplicon sequence analysis pipeline for the characterization of fungal microbiota.Microbiome20131:6.
Submit your next manuscript to BioMed Central and take full advantage of:
• Convenient online submission
• Thorough peer review
• No space constraints or color figure charges
• Immediate publication on acceptance
• Inclusion in PubMed, CAS, Scopus and Google Scholar
• Research which is freely available for redistribution