Organized by C.O.E.T, Akola, ISTE, New Delhi & IWWA. Available Online at www.ijpret.com406
INTERNATIONAL JOURNAL OF PURE AND
APPLIED RESEARCH IN ENGINEERING AND
TECHNOLOGY
A PATH FOR HORIZING YOUR INNOVATIVE WORK
MAPPING OF LINEAMENTS AND GEOMORPHOLOGY FOR GROUND WATER
POTENTIAL ZONE IDENTIFICATION FOR SUSTAINABLE DEVELOPMENT IN BILDI
RIVER SUB BASIN OF PURNA RIVER MAHARASHTRA, USING REMOTE SENSING
AND GIS TECHNIQUES
SHIVAKUMAR. M. TALE 1, B. S. MANJARE2
1. College of Engineering and Technology, Akola, University SGB Amravati, (MS) India. 2. Department of Geology RTM Nagpur University, Nagpur (MS) India.
Accepted Date: 07/09/2016; Published Date: 24/09/2016
Abstract:The study under analysis was carried out the application and importance of remote sensing and Geographic Information System (GIS) techniques for distinguish the groundwater resources by using lineament extraction. The IRS LISS III satellite image of 23.5 mt. spatial resolution were visually interpreted through GIS overlay analysis for lineaments extraction using Arc GIS 10.2 (Ver.) software. The extracted lineaments were statistically analyzed to determine lengths and intersections of the lineaments to generate rose diagram and lineament intersection map. The lineament/fracture analyses indicated that the area has several long and short fractures whose structural trends are mainly in north-south and east-west direction. The cross-cutting lineaments are relatively high areas around the central, north-eastern and near Pimpri, Pimpralla and Nagapur village of the study area but low in the other areas. The zones of high lineament intersection are viable region for groundwater prospecting in the study area. The groundwater prospect map is prepared taking into consideration of lineament map, geomorphological map and geological map along with drainage patterns in the study area. By combining these maps a with some field information on ground water level, well yield of various geomorphic units, obtained which is further used for preparing ground water prospect map.
Keywords: Lineament, geomorphology, remote sensing & GIS
Corresponding Author:MR. SHIVAKUMAR. M. TALE
Co Author: MR. B. S. MANJARE
Access Online On:
www.ijpret.com
How to Cite This Article:
Shivakumar M. Tale, IJPRET, 2016; Volume 5 (2): 406-420 PAPER-QR CODE
SPECIAL ISSUE FOR
INTERNATIONAL CONFERENCE ON
“INNOVATIONS IN SCIENCE & TECHNOLOGY:
Organized by C.O.E.T, Akola, ISTE, New Delhi & IWWA. Available Online at www.ijpret.com407
INTRODUCTION
Structural trends such as discontinuity can be detected in many forms, such as faults, fracture, joints, bedding planes or foliation, and lineation may be useful in several environmental applications including landslide studies, hydrogeology and mineral exploration. This discontinuity can be detected in the form of a lineament not only by ground mapping but also by using remotely sensed data such as conventional aerial photographs and satellite imagery. The good correlation between structures mapped in the field and using the lineament system enable the lineament to be regarded as representative of the structural indication of a particular area. Lineament in this study is defined as a mappable, linear feature of a surface, whose parts are aligned in a rectilinear or slightly curvilinear relationship and which differ from the pattern of adjacent features and presumably reflect some subsurface phenomenon (O’Leary et al. 1976). Remote sensing technique provides a means for regional understanding of groundwater system. Its data provides information on spatial patterns groundwater dependent vegetation or salinization and is often the only sources to study the history of change. The interpretation of remotely sensed data for linear features mapping is an integral part of groundwater exploration programmes in hard rock terrain (Gustafsson, 1993). Remote sensing with its advantages of spatial, spectral and temporal availability of data covering large and inaccessible areas within short time has become a very handy tool in assessing, monitoring and conserving groundwater resources. The integrated application of satellite imagery and digital elevation models (DEMs) in geological structural analysis is becoming increasingly popular (Syed & Saeid 2004). In this study how lineament extraction by using remote sensing techniques helps groundwater potential evaluation.
STUDY AREA
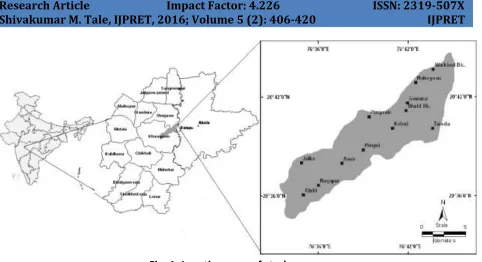
Bildi catchment is located in the south eastern part of the Purna alluvium and extends from the ridges and meets to the Mun River. Bildi catchment overlies two districts of the Maharashtra; i.e. Akola and Buldhana. It has an area of approximately 119.91 km 2. The Bildi river basin
covers an area of 140 sq.km km2 in theShegaon Taluka of Buldana District, Maharashtra. It is
Organized by C.O.E.T, Akola, ISTE, New Delhi & IWWA. Available Online at www.ijpret.com408
Fig. 1: Location map of study area
GEOMORPHOLOGY AND GEOLOGY
The study area is dominated by plains of Deccan trap. Physiographically the district falls under three structural cum physical units. In the north is a hilly strip of the Satpudas, Purna plains in the middle and the Ajanta range comprising Buldhana plateau in the south. The northern region forms a part of Satpura or Gawilgarh hills, which rise to general elevations of 600 to 700 m above mean sea level above MSL (mean sea level) with occasional peaks rising up to 1000 m above MSL or more. Purna plain is the main lowland region of the district, with average elevation ranging between 250 and 270 m above MSL. The Ajanta range carrying on its flat top high level mesa of Buldhana plateau covers the southern part of the district. The edge of this plateau, overlooking the Purna plains to its north, is a hilly ghat with average elevations of 500 to 600 m above MSL. Topographic relief in the Bildi catchment not changes significantly throughout the area. The elevation varies from 256 to 436 mt above MSL. Geology of Akola and Buldhana district is practically the geology of Deccan traps which occur in about- 80 percent of the district. The other geological formation younger than the trap also occurs in the district.
GEOMORPHOLOGY
Organized by C.O.E.T, Akola, ISTE, New Delhi & IWWA. Available Online at www.ijpret.com409
METHODOLOGY
In order to delineate geomorphological maps the geo-coded IRS-LISS -3 satellite data and SOI toposheet were used. Basic image characteristics like tone, texture, shape, color, associations, etc were used along with field observation such as topography, relief, slope factor, surface cover, soil and vegetation cover were considered while delineating geomorphic map of the study area. Then after this data integrated in geographic information systems (GIS) using the spatial overlap method in ARC GIS 10.2 Ver. to delineate groundwater potential zones. Depending on the lithological characteristics climatic condition, hydrological condition of the Bildi River sub basin and adjoining region has been divided into different geomorphological units of trifacial origin, namely the structural, fluvial and denudation origin. The descriptions of the various geomorphological units are described below.
Unit’s fluvial origin
North east trending Bildi River flow in to the lowering depression and negative land form which are surrounded by Purna drainage. These are filled with quaternary sediments of silt gravel and pebbles (Fig.2).
Younger alluvium flood plain
This unit mainly differs from the older flood plain in the cycle of deposition and occurs at relatively lower level. The younger alluvium occurs along Purna River, Mun River and Bildi River and lies at south west part of the study area. The younger alluvial plain landform represents a landscape of badland topography resulting from severe soil erosion. The elevation varies from 250 to 320 mt. (Fig.2).
Region of middle level plateau on Deccan trap
Plateau landform is mostly undulating landform occupying the hilly areas and the plains. Moderate to thick soil cover appreciable zone of weathering and less dissection are main characteristics of this landform. This landform found in the north west to south west part of the study area. The Elevation of this middle level Plateau is about 360 to 430 mt in the study area. Geologically this unit is covered by Deccan basalt (Fig.2).
Region of low level plateau on Deccan trap
Organized by C.O.E.T, Akola, ISTE, New Delhi & IWWA. Available Online at www.ijpret.com410
Fig.2: Geomorphological map of the study area
BILDI RIVER SUB BASIN
Organized by C.O.E.T, Akola, ISTE, New Delhi & IWWA. Available Online at www.ijpret.com411
DRAINAGE PATTERN OF BILDI RIVER SUB BASIN
Dendritic to subdendritic drainage pattern is most common pattern is formed in a drainage basin composed of fairly homogeneous rock without control by the underlying geologic structure. The longer the time of formation of a drainage basin is, the more easily the dendritic pattern is formed. The study area has dendritic to sub dendritic drainage type pattern (Fig.3). It is characterized by a tree like branching system in which tributaries join the gently curving main stream at acute angles .In the study area at some places the drainage pattern is slightly parallel due to parallel orientation of lineament (Tale & Manjare 2016).
GEOLOGY OF THE STUDY AREA
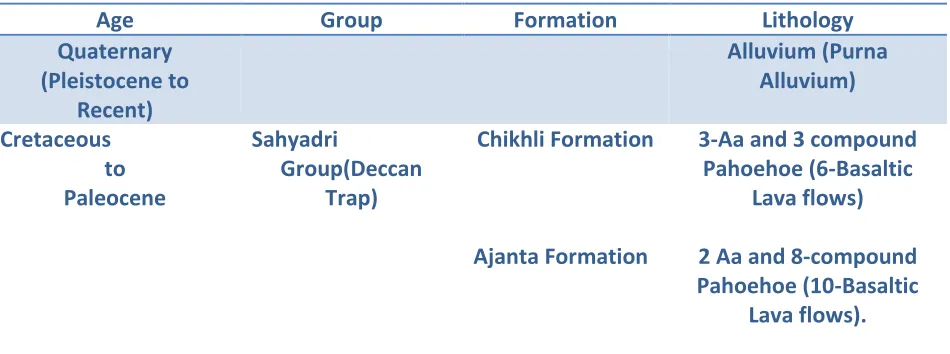
Geology of Akola and Buldhana district is practically the geo¬logy of Deccan traps which occur in about 80 % of the district. The other geological formation younger than the trap also occurs in the district. The succession of geological formation and area wise distribution (Table 1) of the study area is given below;
Table 1: The stratigraphic succession of the study area
Age Group Formation Lithology
Quaternary (Pleistocene to Recent) Alluvium (Purna Alluvium) Cretaceous to Paleocene Sahyadri Group(Deccan Trap) Chikhli Formation Ajanta Formation
3-Aa and 3 compound Pahoehoe (6-Basaltic
Lava flows)
2 Aa and 8-compound Pahoehoe (10-Basaltic
Lava flows).
Purna Alluvium
The northern part of the district on either side of Purna River is underlain by thick alluvial deposits of Pleistocene to Recent age and is termed as Purna Alluvium. The Alluvium is also observed in a small patch southwest of Balapur and east of Khamgaon along the boundaries of district. The Alluvial valley lies in narrow belt and covers roughly about 1800 sq. km. The valley extends about 51 km2. in Buldhana district and it tapers towards the western end. In Alluvial
Organized by C.O.E.T, Akola, ISTE, New Delhi & IWWA. Available Online at www.ijpret.com412
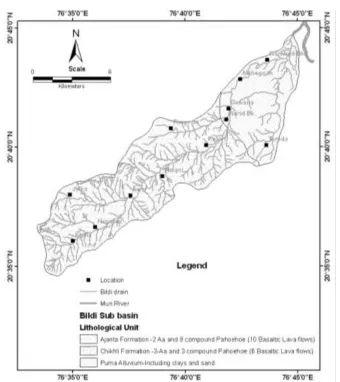
results in variable water yielding capacity depending upon the sand-clay ratio (Fig. 3). Purna Alluvium has a proven thickness of more than 300 meters. Based on studies the entire thickness of Alluvium has been divided into younger Alluvium and older Alluvium. The younger Alluvium contains comparatively more sand layers and thus forms good aquifer. The older Alluvium, which is more clayey with thin horizons of sand and silt forms a comparatively lesser potential aquifer. In younger Alluvium ground water generally occurs in confined to semi-confined conditions in the depth range of 11 to 40 m bgl, while in older Alluvium it occurs under confined conditions below the depth of 40 m.
Sahyadri Group (Deccan Trap)
Deccan Trap Basalt forms an important water bearing formation of the district. The disposition of vesicular and massive of different lava flows has given rise to multi layered aquifer system. The water bearing capacity of Vesicular Basalt largely depends upon size and shape of vesicles, density of vesicles and the degree of inter connection of vesicles. Massive Basalt generally does not possess primary porosity. However, Massive Basalt, which is fractured, jointed and weathered posses’ water bearing capacity. Degree of weathering and topographic setting also plays a major role in respect of productivity (Fig. 3). In Basalt, ground water occurs both in Vesicular and Massive Basalt as well as inter flow zones in weathered mantle, fractured zones. In general ground water occurs under water table conditions in shallow aquifer and semi-confined to semi-confined conditions in deeper aquifer. The unsemi-confined aquifer is developed due to the weathering and jointing of upper flow in Basalt down to depth of 15 to 20 mbgl. The Sahyadri Group in the study area divided in to two formations namely Chikhli Formation and Ajanta formation (GSI, 2000).
Chikhli Formation
This formation in the study area is very small in aerial distribution and recorded in the area are 3-Aa and 3 compound Pahoehoe (total of 6 Basaltic Lava flows) lava flows (Fig.3). All the lava flows shows the nature of dark, massive to fine grained moderately to high porphyritic, shows columnar jointing- road metals. In the study area this formation is in small patches near at North West to the Kinhi and Awar Village which covers the 0.87 % (GSI, 2000).
Ajanta Formation
Organized by C.O.E.T, Akola, ISTE, New Delhi & IWWA. Available Online at www.ijpret.com413
Fig. 3: Geological map of the study area (modified after GSI 2000)
CONCEPT OF LINEAMENT
Organized by C.O.E.T, Akola, ISTE, New Delhi & IWWA. Available Online at www.ijpret.com414
enhancement techniques including filtering operations, Principal Component Analysis (PCA) and spectral rationing are applied to reduce the problems in the identification of the lineaments. Lineaments are evaluated in order to extract further information on the distribution and nature of the lineaments for this purposes conventional techniques are applied to lineaments such as frequency or length against azimuth histograms (Mostafa and Zakir, 1996), rose-diagrams (Nalbant and Alptekin, 1995), and lineament density maps (Zakir et. al.1999). The purpose of this study is to analyze the spatial distribution of lineaments extracted from satellite images according to their density, intersection, length and orientation in order to contribute to the understanding of the structural setup of the Bildi river sub basin and large accept the view that the lineaments are surface expressions of faults, fractures .
Nature of Lineaments
Lineaments may be continuous or discontinuous. An uninterrupted linear scarp is an example of a continuous lineaments, the separate feature align in a consistent direction and are relatively closely spaced. Lineaments may be simple or composite. Simple lineaments consist of a single type of feature, such as linear stream valley or a series of aligned topographic escarpments. Composite lineaments consist of more than one type of feature, such as combination of aligned tonal feature and stream segments. On satellite image of Precambrian shield areas many of the long lineaments of are clearly defined by aligned straight segments of valley and by linear tonal contrasts. If there is a clear displacement then the lineament is identified as fault. Although displacement has apparently not accrued, the rocks may be more highly fractured and susceptible to stream erosion.
METHODOLOGY FOR LINEAMENT ANALYSIS
Lineaments usually appear as straight lines or “edges” on the images which in all cases contributed by the tonal differences within the surface material. The knowledge and the experience of the user is the key point in the identification of the lineaments particularly to connect broken segments into a longer lineament (Wang et al., 1990). The study of these lineaments in relation to geology, structure, magmatism, mineralisation and deep geophysical responses etc. led to the classification of these lineaments into various groups and classes.
1. Drainage line designates linear valley trends independent of the orientation or linearity of channel segments within the trend.
Organized by C.O.E.T, Akola, ISTE, New Delhi & IWWA. Available Online at www.ijpret.com415
Lineament Extraction
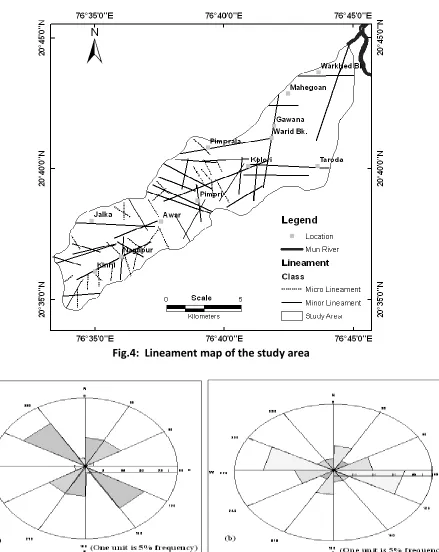
According to literature there are two common methods for the extraction of lineaments from satellite images: 1. Visual extraction/interpretation; at which the user first starts by some image processing techniques to make edge enhancements, using the directional and non-directional filters such as the Laplacian, and Sobel, then the lineaments are digitized manually by the user. 2. Automatic (or digital) extraction interpretation; various computer-aided methods for lineament extraction have been proposed. Most methods are based on edge filtering techniques. The most widely used software for the automatic lineament extraction is the LINE module of the PCA i.e. principle component analysis. By using these above different techniques 59 numbers of lineaments are extracted from IRS LIIS-3 data (Table 2, 3, 4 & Fig.4).
Classification of Lineaments
In general there is no minimum length for lineaments, but significant crustal feature are typically measured in tens or hundreds of kilometers. Kowalik and Gold (1976) suggested a lengthwise classification of lineaments/linear feature. The classification is as follows: (a) short/minor – 1.6 to 10 km (b) intermediate – 10 to 100 km (c) long/major – 100 to 500 km (d) mega - > 500 km. However, no uniform classification system has been evolved yet. The authors feel that keeping in mind the high resolution data/large scale of mapping (up to 1:5000) possible currently, lineaments can be classified based on their length as: (i) micro: <2km, (ii)minor: 2-10 km, (iii) medium: 10-100 km, (iv) major: 100-500 km, and (v) mega > 500 km (Table 2, 3, 4).
The most distinguishing feature of this map is that the highest concentration is observed along the north to Bildi river basin. This zone in the map extends from west of Pimpri, Warkhed bk. to the east of Balapur and Akola. That means the longest fault segments are observed along the Bildi river and crossing the lineament along the river channel. Other concentrations observed in the middle of the map and in the other part of the map i.e. on the upper side the lineament density is quite low and longer in length while at the eastern part the density decreases (Table 2, 3, 4).
Lineament Trends in the Area
Organized by C.O.E.T, Akola, ISTE, New Delhi & IWWA. Available Online at www.ijpret.com416
Table 2: Classification of lineament in the study area
Sr. No. Lineament Class Numbers % Cumulative Length(mts)
1 Micro lineament ( > 2 km) 25 42.37 33592.32
2 Minor lineament (2-10 km) 34 55.93 126118.13
TOTAL 59 159710.42
Table 3: Micro Lineament trends in study area
Sr. No Trends Number of fraction %
1 00-290 04 16
2 300-590 04 16
3 600-890 01 04
4 900-1190 00 00
5 1200-1490 15 60
6 1500-1790 01 04
Total 25
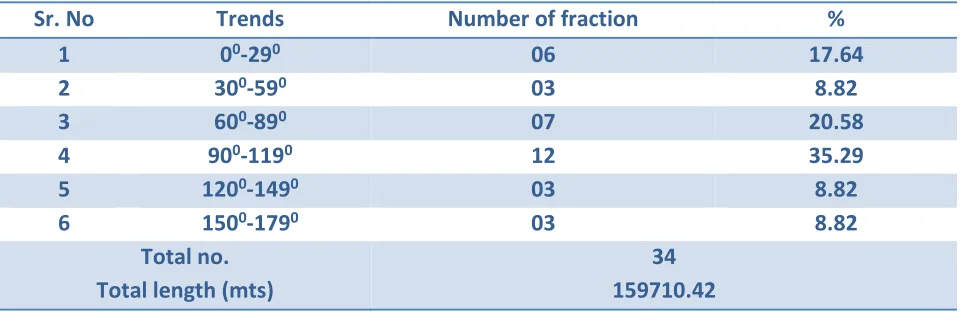
Table 4: Minor Lineament trends in study area
Sr. No Trends Number of fraction %
1 00-290 06 17.64
2 300-590 03 8.82
3 600-890 07 20.58
4 900-1190 12 35.29
5 1200-1490 03 8.82
6 1500-1790 03 8.82
Total no. Total length (mts)
Organized by C.O.E.T, Akola, ISTE, New Delhi & IWWA. Available Online at www.ijpret.com417
Fig.4: Lineament map of the study area
Organized by C.O.E.T, Akola, ISTE, New Delhi & IWWA. Available Online at www.ijpret.com418
Fig. 6: Representation of lineament on the IRS LISS-III FCC
Ground Water Prospecting Based on the Lineament, Geomorphology and Geology
Organized by C.O.E.T, Akola, ISTE, New Delhi & IWWA. Available Online at www.ijpret.com419
Fig.6: Ground water potential zone map of the study area
CONCLUSIONS
Satellite data integrated with GIS techniques has used for lineament identification and mapping. This study expressed the enhanced satellite data of IRS LISS III of 23.5 mt. spatial resoluion for lineament interpretation in a Bildi river sub basin of the Purna River. With preparation of various thematic maps geology, drainage pattern, regional structural lineament, lineament intersection and other field verification. In the study area there are 59 lineaments of minor and micro type. Out of which 25 are micro lineament and 34 are minor type. Most of minor and micro lineaments trends are NE, ESE, SE, SSW in which minor lineaments gives the length of 33592.32 mt. and minor lineament 126118.13 mt . Therefore it is suggesting that the trends are NE-SW and NW SE direction. The result of the analysed lineament/fracture indicated that the area has numerous long and short fractures whose structural trends are mainly in NE-SW and NW SE direction. The cross-cutting lineaments are comparatively high areas around the central, north-eastern and south-western parts near Pimpri, Pimpralla and Nagapur village of the study area but low in the other areas. The zones of high lineament intersection are good for groundwater prospecting in the study area.
REFERENCES
Organized by C.O.E.T, Akola, ISTE, New Delhi & IWWA. Available Online at www.ijpret.com420
2. Geological Survey of India (2001) District Resource Map –Buldhana and Akola district, Maharashtra, Geological Survey of India.
3. Gustafson, P. (1993) Satellite data and GIS as a tool in groundwater exploration in a semiarid area. Licentiate thesis. Dept thesis. Dept. of Geology, Chalmers Univ. of Technology, Publ. A 74.
4. Kowalik, W.S., and Gold, D.P. The Use of Landsat-1 Imagery in Mapping Lineaments in Pennsylvania. Proceeding First Int. Conf. on the New Basement Tectonics, Utah Geol. Assoc. 1976. 5; 236-249.
5. Mostafa, M. E, Zakir, F. A. 1996, “New enhancement techniques for azimuthal analysis of lineaments for detecting tectonic trends in and around the Afro-Arabian Shield. International Journal of Remote Sensing”, Vol.17, No.15, 2923-2943.
6. Nalbant, S., and Alptekin, Ö., 1995, “The use of Landsat Mapper imagery for analysing lithology and structure of Korucu-Dugla area in western Turkey”, International Journal of Remote Sensing, Vol.16, No.13, 2357-2374.
7. O’Leary, D. W. Friedman, J. D., Pohn, H. A., (1976), “Lineament, linear, lineation: Some proposed new standards for old terms”, Geological Society America Bulletin, Vol.87, 1463-1469.
8. Syed, A.A. and Saied, P., 2004, Geological applications of Landsat Enhanced Thematic Mapper (ETM) data and Geographic Information System (GIS): mapping and structural interpretation in south-west Iran, Zagros Structural Belt. International Journal of Remote Sensing, 25, pp. 4715–4727.
9. Tale S. M., Manjare B. S., (2016), Morphometric Analysis Of Bildi River Sub Catchment Of Purna River Sub Basin Maharashtra, India Using Remote Sensing And GIS Techniques, Journal of Innovative Prospective in Science, Vol. (I)issue I, pp., 53-60.
10. Wang, Jinfei, Member, IEEE, Howarth, Philip J., 1990, “Use of the Hough Transform in Automated Lineament Detection”, IEEE Transactions on Geoscience and Remote Sensing, Vol. 28, No. 4, 561-566.