Download complete issue: Vol. 2, No. 1 (PDF)
6
0
0
Full text
(2) 24. INTERNETWORKING INDONESIA JOURNAL. also directly manipulate the controller by using many engineering science calculation softwares and optimizations. The SPC software in the plant information management system also gain benefits from this network communication as it can be incorporated to the advanced control engineering software and the human machine interface (HMI), to gather data and to deliver the results to the controllers. Moreover, Ethernet communications is now being developed to replace the conventional analog signal transmission from the controller to sensors and actuators and vice versa, denoted in Figure 1 by the orange lines. By using faster industrial data communication, integrated monitoring and control systems over a wider plant area can be applied to perform better process production beyond the conventional industrial data transmission using analog signal. Plant-wide control within Tennessee Eastman (TE) is an interesting and challenging problem in industrial process control. The TE problem was first proposed by Downs dan Vogel in 1993 [5]. The problems include multivariable process control, multi objective optimization, adaptive and predictive control, interacting control, nonlinear control, identification and estimation, diagnostic and monitoring, education, and others. Since the TE problem was accepted as a standard experimental apparatus in plant-wide control design, more than 60 papers have been published internationally. The TE process represents a process simulator which mimics the real process. The diagram block of the TE process is shown in Figure 2. The process consists of many units, such as an exotermic reactor, a two-phase reactor, a flash separator and a reboiler stripper. In this TE process, there are 41 measured output variables and 12 manipulated variables. Using the TE process, various research from different perspectives and various control methods – with many different level of difficulties and complexities – can be conducted close to the real process [6,7]. The objectives of this paper are to evaluate operation cost, product quality, process pressure, and production rate from Tennessee Eastman process simulation, and to study control system design from the outcome tuning parameter controller PI by using SPC method. The outlined problems are: the system is linear system so there is no disturbance in simulation process, the simulation process is a simplified process (MATLAB with Fortran to simulink), the quality product is focused on G product composition, the analysis is done offline, and the process is viewed from overall perspective. The Tennessee Eastman process is provided by using basic control system as shown in Figure 2. In this paper, the Tennessee Eastman process is viewed from overall perspective (Figure 3) and simulated by using SIMULINK and MATLAB 7.01 based on simulation process developed by Ricker, 2000 [8]. In every stream of the Tennessee Eastman process, overall process uses PI controller where Kc and I denote the gain and the integral parameters respectively [9]. The simulation process is divided into 2 sections, the preliminary and the main sections. In the introduction section, based on the Tennessee Eastman overall process, the controller parameter value was changed. Controller parameter values are increased by multiplying with 100 and decreased by dividing with 100. JOELIANTO ET AL.. from the default controller parameter values. First, the process is simulated with no controller parameter change (called the default condition). Then one of the controller parameter process value is increased from the default parameter value and the simulation is repeated from the start. Next, the other controller parameter process value is decreased from the default parameter value and the simulation is repeated from the start. But the other controller parameter value is still at default value. The simulation result when the parameter values are at the default, increased, and decreased states were collected for the SPC analysis.. FC FI. FC. FI. FC. JC C O N D E N SE R C O O L IN G. A. PU RGE. C O M P R E SS O R PI. LC. C O N D EN S E R FI. FC. FI. FC. TI. TC S E P A R A T O R. D. X. PC. LC. E A N A L Y Z E R. TI. FI TC. FI. TI. PI. R EAC T OR C O O L IN G. R E A C T O R. FI. TC. LC. S T R I P P E R. FC. TC. FC. FI. E ST EA M. FC FC. C. A N A L Y Z E R. FI. FC. A N A L Y Z E R. G H. PRODU CT. Figure 2: Tennessee Eastman Process Scheme with Basics Controlling (McAvoy, Ye, 1994) [6]. Sample from data of each simulation was taken every 1 hour and UCL and LCL for control chart (x and MR chart) was calculated using equations below with n is 3: For x chart : N. ∑ xi x = i =1. (1). UCL = x + E 2 MR. (2). centre line (CL) = x. (3). LCL = x − E 2 MR. (4). N. For MR chart : MR = range from x i until x i + n. (5). UCL = D 4 MR. (6). ISSN: 1942-9703 / © 2010 IIJ.
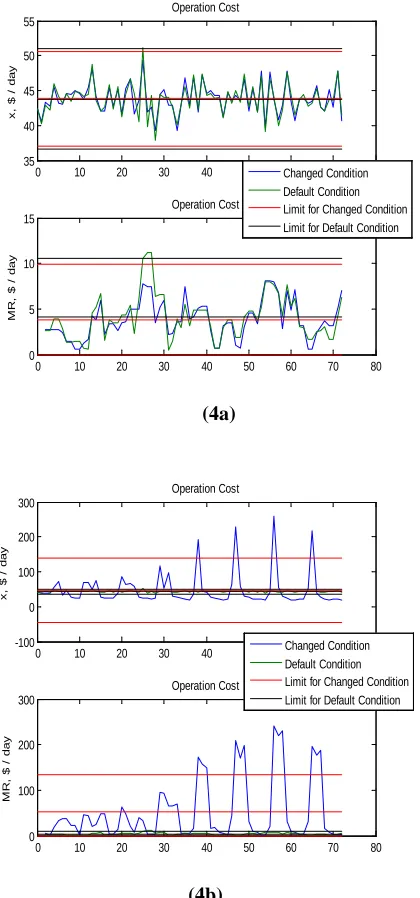
(3) INTERNETWORKING INDONESIA JOURNAL. Vol.2/No.1 (2010). centre line (CL) = MR. (7). LCL = D 3 MR. (8). The constants are given in Table 1 in the following.. Table 1 Constants for x chart and MR chart (Smith, 1998) [2] n. D3. D4. E2. 2. 0.000. 3.267. 2.659. 3. 0.000. 2.574. 1.772. 4. 0.000. 2.282. 1.457. 5. 0.000. 2.115. 1.29. 25. rate, and %G in product in Figure 3, with the controller parameter Kc and τI. The infuential controller parameters which resulted from the introduction section are the A feed rate controller Kc and τI parameters, C feed rate controller Kc and τI parameters, production rate controller Kc parameters purge rate controller Kc and τI parameters, %G in product controller Kc and τI parameters. In the main section, the value of each controller parameter that were resulted from the introduction section is then changed. Next, from the main section result, the parameter values of each controller that give the best and the worst condition is selected. The criteria for the value selection of each controller parameter that give best condition are given in the following: 1. It does not pass LCL and UCL, for x and MR chart, and for operation cost, product quality, pressure and production rate. 2. It has lower operation cost average, or higher product quality average, or pressure average that more closer to set point (2800 kPa), or higher production rate average than default condition. The criteria for the worst condition is opposite to the criteria for the best condition. 3.. Figure 3: Tennessee Eastman Overall Process Scheme (McAvoy, Ye, 1994) [5]. 2.. Simulation Procedures. Simulation is carried out by using the TE process simulation software developed in [8]. After simulation, each controller parameter value was studied and the controller parameter values that give the best state and the worst state based on control chart criteria are selected. Results are then analyzed by comparing operation cost, product quality, process pressure, and production rate control chart between the controller parameter values at default condition and at change value conditions. In the introduction section, the compared control charts are obtained when the controller parameter values are at default, increased, and decreased conditions. Next, the controller parameters that give significant difference in the control chart at 3 conditions for Tennessee Eastman overall process are called influential controller parameters. In the main section, the compared control charts are the control chart where every controller parameter value is at changed condition with control chart at the default condition. The Tennessee Eastman process is viewed from the overall perspective to decrease controller parameter which is then tested. The tested controller in the introduction section are the controller at A, C, D, and E feed rate, purge rate, production. Analysis and Results. Result analysis was done by compareing the operation cost, product quality, process pressure, and production rate control chart between the controller parameter change value condition with the default condition. In the introduction section, the control chart that was compared are the controller parameter values at default condition, at increased value condition, and decreased value condition. Example of the control chart from the introduction section result is τI parameter for %G in product controller shown in Figure 4(a) at the increased contoller parameter value condition, and Figure 4(b) for the decreased controller parameter value condition. In the main section, the control chart that was compared are the controller parameter values at the default condition and the changed value condition. The results of the value selection of the controller parameters from the main section are shown in Table 2. Example of the control chart from the main section result is τI parameter for %G in product with best condition shown in Figure 5.. ISSN: 1942-9703 / © 2010 IIJ.
(4) INTERNETWORKING INDONESIA JOURNAL. 26. JOELIANTO ET AL.. Operation Cost 55. 50. 50 x, $ / day. x, $ / day. Operation Cost 55. 45. 40. 40 35. 0. 10. 20. 30. 40. 50. Operation Cost. 35. 80 70 60 Changed Condition Default Condition Limit for Changed Condition Limit for Default Condition. 10. 5. 0. 10. 20. 30. 40. 50. 60. 70. 0. 10. 20. 30. 0. 80. 0. 10. 20. 30. 40. 60. 50. Changed Condition Default Condition 60 70 80 Limit for Changed Condition Limit for Default Condition. 50. 60. 70. 80. (5a). Quality 92. 200. 91 x, %. x, $ / day. 50. 5. Operation Cost. 100. 90 89. 0. 0. 10. 20. 30. 40. 50. Operation Cost 300. 88. Changed Condition 80 70 60 Default Condition Limit for Changed Condition Limit for Default Condition. 0. 10. 20. 30. 40 Quality. 2 1.5. 200. MR, %. MR, $ / day. 60 70 80 Changed Condition Default Condition Limit for Changed Condition Limit for Default Condition. 10. 300. 100. 0. 50. Operation Cost. (4a). -100. 40. 15 MR, $ / day. MR, $ / day. 15. 0. 45. 1 0.5. 0. 10. 20. 30. 40. 50. 60. 70. 80. 0. 0. 10. 20. 30. 40. (5b). (4b) Figure 4: Example of Control Chart (x and MR Chart) from the Introduction Section Result When Controller Parameter at (a) decreased value condition, (b) increased value condition. ISSN: 1942-9703 / © 2010 IIJ. 70. 80.
(5) INTERNETWORKING INDONESIA JOURNAL. Vol.2/No.1 (2010). 27. Pressure. x kPa gauge. 2805. Table 2: Each Controller Parameter Value for Default, Best, and Worst Condition from the Main Section Result. 2800. 2795. Contro ller 0. 10. 20. 30. 40. 50. Pressure. MR, kPa gauge. 8. 80 70 60 Changed Condition Default Condition Limit for Changed Condition Limit for Default Condition. 6 4 2 0. 0. 10. 20. 30. 40. 50. 60. 70. 80. (5c) Production 18.6. x, m3/hr. 18.4 18.2 18 17.8 17.6. 0. 10. 20. 30. 40. 50. Production. MR, m3/hr. 0.8. 60 70 80 Changed Condition Default Condition Limit for Changed Condition Limit for Default Condition. A feed rate C feed rate Product ion rate Purge rate %G in product. Default Condition Kc τI 0,01 0,001 / 60 0,00 0,001 / 3 60 3,2 –– 0,01 -0,4. 0,001 / 60 100 / 60. Best Condtion Kc 1 0,000 3 0,32 0,9 - 0,04. Worst Condition. τI 0,00001 / 60 0,01 / 60. 0,000033. ––. 128. 0,000011 1/ 60 1000 / 60. 0,000167. Kc 0,000333. -4. τI 0,03 / 60 0,09 / 60 –– 0,06 / 60 11,11 / 60. A feed rate controller (Kc) parameter and %G in product controller (τI) parameter show significant tendency when their value was increased such that the control chart would not pass their limit and when their value of parameter was decreased so that the control chart would pass their limit. A feed rate controller τI parameter showed tendency when the controller parameter value was increased such that the control chart would pass their limit and when the value was decreased such that the control chart would not pass their limit. C feed rate controller Kc and τI parameter, production rate and %G in product controller Kc parameter, purge rate controller Kc and τI parameter did not show any tendency in the control chart.. 0.6 0.4 0.2 0. 0. 10. 20. 30. 40. 50. 60. 70. 80. (5d) Figure 5: Example of Control Chart (x and MR Chart) from the Main Section Result for: (a) Operation Cost, (b) Quality, (c) Pressure, (d) Production Rate.. Based on the Tennessee Eastman overall process perspective, it was observed that not all PI controller parameter shows significant effects in operation cost, quality, pressure, and production rate between condition at changed value controller parameter and condition at default value controller parameter. The controller parameters on overall process that had significant influent are A feed rate controller Kc and τI parameter, C feed rate controller Kc and τI parameter, production rate controller Kc parameter, purge rate controller Kc and τI parameter, %G in product controller Kc and τI parameter.. The operation cost at the default condition (controller parameter have not changed yet) passed UCL for x and ME chart.. Value changing of each parameter values of the controller could give better chart result (x and MR) than the default value condition. Control chart can be used to provide easier overview of the process and the offset for chemical industry like Tennessee Eastman process. If the range value between UCL and LCL in control chart is samller, then the system response reaches the set-point with less oscillation. Only the purge rate controller with Kc and τI parameter at the best condition that gave lower operation cost average than at the default condition and the other controller parameter at best condition. 4.. Conclusions. The Tennessee Eastman process has been investigated from the plant wide control consideration by using statistical process control analysis. By using SPC, the Tennessee Eastman process can be evaluated and studied so the controller parameter values that gave better result than the default condition on operation cost, product quality, process pressure, and production rate can be obtained. In the future, it would be better if the controller parameter values were changed with particular selected parameters that can give better results, particulary on operation cost. Moreover, the investigation needs to include the effect of the set point value used in the process.. ISSN: 1942-9703 / © 2010 IIJ.
(6) INTERNETWORKING INDONESIA JOURNAL. 28. JOELIANTO ET AL.. Notation x. sample. x. sample (x) average. MR Moving Range average. LCL Lower Control Limit MR. Moving Range sample. n. number of sample that use to calculate a MR. N. number of sample. UCL Upper Control Limit. Endra Joelianto (M’01) received the B.Eng. degree in Engineering Physics from Bandung Institute of Technology, Indonesia in 1990, and Ph.D. degree in Engineering from The Australian National University (ANU), Australia in 2002. He was a Research Assistant with the Instrumentation and Control Laboratory, the Department of Engineering Physics, Bandung Institute Technology, Indonesia from 1990-1995. Since 1999, he has been with the Department of Engineering Physics, Bandung Institute of Technology, Bandung, Indonesia, where he is currently an Assistant Professor. His research interest includes hybrid control systems, discrete event systems, artificial intelligence, robust control and intelligent automation. He has edited one book on intelligent unmanned systems published by Springer-Verlag, 2009 and published more than 70 research papers. Dr. Joelianto currently is an Editor of the International Journal of Artificial Intelligence (IJAI). He is the Chairman of Society of Automation, Control & Instrumentation, Indonesia. He was the General Chair of the International Conference on Instrumentation, Control and Automation, Bandung 2009.. REFERENCES [1] Berger, Roger W. and Thomas Hart (1986), Statistical Process Control, A Guide for Implementation, Marcel Dekker, Inc. , New York. [2] Smith, Gerald M. (1998), “Statistical Process Control And Quality Improvement, 3rd edition”, Prentice Hall International, USA [3] Montgomery, Douglas C. (2001), Introduction to Statistical Process Control, 4th edition”, John Wiley & Sons, Inc., USA [4] Joelianto, E. and Hosana (2009), “Loop-Back Action Latency Performance of an Industrial Data Communication Protocol on a PLC Ethernet Network”, Internetworking Indonesia Journal, Vol.1, No.1, pp. 1118. [5] Downs, J. J. and E. F. Vogel (1993), “A Plant-Wide Industrial Control Problem”, Comput. Chem. Engng., 17, pp. 245–255. [6] McAvoy, T. J. and N. YE (1994), “Base Control for The Tennessee Eastman Problem”. Comput. Chem. Engng., 18, pp. 383–413. [7] McAvoy, T. J. (2002), “Model Predictive Statistical Process Control of Chemical Plant”, In Proceeding of the American Control Conference, pp. 3876-3881, Anchorage. [8] Ricker, N. Lawrence, (2000), http://www.eas.asu.edu/~csel/Software-TennEast.htm [9] Stephanopoulos, George (1984), Chemical Process Control, An Introduction to Theory and Practice, Prentice/Hall International, Inc., New Jersey.. ISSN: 1942-9703 / © 2010 IIJ.
(7)
Figure

![Figure 2: Tennessee Eastman Process Scheme with Basics Controlling (McAvoy, Ye, 1994) [6]](https://thumb-us.123doks.com/thumbv2/123dok_us/8756128.1749961/2.612.316.565.192.379/figure-tennessee-eastman-process-scheme-basics-controlling-mcavoy.webp)
![Figure 3: Tennessee Eastman Overall Process Scheme (McAvoy, Ye, 1994) [5]](https://thumb-us.123doks.com/thumbv2/123dok_us/8756128.1749961/3.612.54.286.77.410/figure-tennessee-eastman-overall-process-scheme-mcavoy-ye.webp)
+2

Related documents
transfer function of filter circuit and then apply sensitivity analysis as given in equation.
Moreover, the measurement data obtained while driving in urban traffic allowed plotting the characteristics of the time density for each of the tested two-wheeled
Charaka Samhita english translation; Sharira sthana, chapter 7, verse no.5, Chaukhambha Sanskrit series office, Varanasi, 1996. Shrikantha Murthy;
Conclusion: Immunization with SRBC suspension induced relative hypoxia, elevated reactive oxygen species (ROS), and oxidative stress in the lymphocytes as indicated by the increase
The current established methods for smoking cessation include wide range of side effects (Table No. 2), but as a comparison sublingual or buccal thin films are a better
This problem, the theorist asserts, is a multidimensional dilemma with four areas: production, consumption, trafficking and money laundering (Cf. As can be seen,
KEYWORDS: Mechanical engineering history, ancient Egypt, symbols in ancient Egypt, symbol meaning, symbol applications, Early Dynastic to Middle
When conducting their study in rural Manitoba, the RDI head from rural service providers and refugee sponsorship groups spoke not only of the challenges of rural resettlement,
