Assessment of the Influence of at Grade Road-Rail
Crossing on Traffic Performance in Addis Ababa,
Case of Sebategna and Adey Ababa Road-Rail
at Grade Intersection
Demelash Berhane Mengesha1,*, Murad Mohammed2, Alemayehu Gebissa3
1
Civil engineering, Debre Berhan University, Debre Berhan, Ethiopia
2
Jimma Institute of Technology, Jimma University, Jimma, Ethiopia
3
Chair of Geotechnics and Coastal Engineering, Faculty of Agricultural and Environmental Sciences, Rostock University, Rostock, Germany
Abstract
The main objective of this study was to evaluate the effects of road-rail at grade crossing on traffic performance. The study started by characterizing the existing traffic performance and correlating them with the existing flow problems. Finally, conclusions were drawn by comparing the level of service (LOS) and vehicular delay at different scenarios on two study areas. In this study, manual traffic counting method aided with video recording during the congested time period and the actual geometry of study junctions have been used for characterizing the existing traffic performance and for the input of VISSIM software. The existing traffic performance was analyzed by the use of Microsoft excel, while the vehicular delay and LOS have been determined by the use of VISSIM simulation modelling software version 9.0 in three different scenarios, by considering both light rail vehicle (LRV) and pedestrian crossing, without LRV crossing and in absence of pedestrians. From the result of the study, most of the movements dominated by the through movements of north bound (41%, 37%) and south bound (31%, 46%) for Adey Ababa and Sebategna intersections respectively. The west bound left turn and north bound right turn movements of Sebategna intersection was greater than other left and right turning movements, this was due to both movements to and from the largest market place merkato. The levels of service of the first scenario for both intersections were between LOS F and D for all movements except the LRV movements. According to an additional delay analysis, from the three scenarios an average additional delay due to LRV crossing have been 1.46 sec./veh and 1.51 sec./veh for Sebategna and Adey Ababa intersections respectively, while an average additional delay due to pedestrian crossing shown to be 13.22 sec./veh and 5.37 sec./veh for Sebategna and Adey Ababa intersections respectively. From those result of additional delay, the traffic performance was more affected by pedestrian crossing than that of LRV crossing. Based on this finding, alternative route was recommended for vehicles whose destination were Merkato market center from southern and western part of the city for Sebategna intersection, and providing pedestrian overpass crossing facility on the near-by intersections along LRT will minimize the existing traffic performance problems.Keywords
Additional traffic delay, Light rail transit (LRT), Road-rail at grade intersection, Traffic congestion, Traffic performance characteristics, VISSIM simulation modelling1. Introduction
As the population and economic growth of every city increases, the demand of transportation for movement of goods and people from origin to destination should also
* Corresponding author:
[email protected] (Demelash Berhane Mengesha) Published online at http://journal.sapub.org/ijtte
Copyright©2019The Author(s).PublishedbyScientific&AcademicPublishing This work is licensed under the Creative Commons Attribution International License (CC BY). http://creativecommons.org/licenses/by/4.0/
increases. This demand of transportation can be fulfilled by increasing the existing public transportation facility, by increasing the capacity of existing transportation infrastructure, and or by introducing a new additional mode of transportation system based on which the new light rail transit (LRT) system in Addis Ababa city was introduced.
by Y. Wiseman (2018) says that rail transport couldn`t be the solution for traffic congestion relative to autonomous vehicles. The journal explains that, Different ways of driving and different responses to events in the roads by different drivers of autonomous vehicles could minimize traffic jams. Moreover, the journal reveals that, since an empty autonomous vehicle can move by itself to a remote parking space that couldn`t be used for moving traffic, will result in uncomplicated increase of road capacity [15]. The author of this paper thought that the introduction of rail transport in developing city like Addis Ababa will minimize the transport demand but still it may increase traffic congestion as the two terms were different.
In Addis Ababa city the performance of intersections has negative effect on road uses day to day activities. Now a day’s traffic congestion becomes threat in the city economic growth by limiting the mobility of the road uses and by increasing delay and fuel consumption. Hence to reduce the congestion problem at intersections it is important to assess the possible causes that affect the performance of the intersections and measure the traffic congestion and the level of services in order to make the traffic performance smooth and effective [2].
1.1. Definition and Type of LRT
Different literatures give different related definition for the term Light Rail Transit, among which a Frankfurt press by Barry, M (1991), define LRT as “it is a mode of urban transportation that uses predominantly reserved, but not necessarily grade-separated, right-of-way.” Furthermore, the press reveals that Light Rail Transit was electrically propelled and it provides a wide range of passenger capabilities with performance characteristics at moderate cost [3].
LRT can also be defined According to American transport research board as it is “A metropolitan electric railway system characterized by its ability to operate single cars or short trains along exclusive rights-of-way at ground level, on aerial structures, in subways, or occasionally, in streets and to board and discharge passengers at track or car floor level” [4].
Manual on uniform traffic control device (MUTCD) discloses that Light rail transit is a mode of metropolitan transportation that employs light rail transit cars (commonly known as light rail vehicles, streetcars, or trolleys) that operate on rails in streets in mixed traffic, in semi-exclusive rights-of-way, or in exclusive rights-of-way. Furthermore, the manual describes the groups of Light rail alignments in to the following three types [5]:
A. Exclusive: A light rail transit right-of-way that is grade-separated or protected by a fence or traffic barrier. Motor vehicles, pedestrians, and bicycles are prohibited within the right-of-way. Subways and aerial structures are included within this group. B. Semi-Exclusive: A light rail transit alignment that is in
a separate right-of-way or along a street or railroad
right-of-way where motor vehicles, pedestrians, and bicycles have limited access and cross at designated locations only.
C. Mixed-Use: An alignment where light rail transit operates in mixed traffic with all types of road users. This includes streets, transit malls, and pedestrian malls where the right of-way is shared.
1.2. Traffic Control Devices at Highway-Rail Intersections
Intersections near highway-railroad grade crossings involve multiple types of traffic: vehicles, trains, and pedestrians. These intersections require special traffic control devices to properly coordinate the movements of these various types of traffic. There are several levels of traffic control at highway-railroad grade crossings. According to the Research report of Texas Transportation Institute (2000), those traffic control devices at highway-railroad grade crossings divided primarily into passive and active control devices. The most basic of these devices, passive devices, provide static messages of warning, guidance, and perhaps action required by the driver. Among these passive devices are signs and pavement markings. For more advanced traffic control, active control devices are necessary; these devices give warning of the approach or presence of a train and are activated by the passage of a train over a detection circuit in the track. Active control devices are supplemented by the same signs and markings used in passive control [6].
Once a train enters an at-grade crossing area, the right-of-way of the crossing is given to the train, and then vehicle traffic must stop until the train leaves the crossing. Depending on train speed, train length, and traffic control type, this process may take a few minutes or much longer. During this period, both through movements at adjacent intersections are blocked, as are turning movements heading to the crossing. When the traffic volume is high at nearby intersections during peak periods, long queues will form at adjacent intersections, and vehicles do not have sufficient time to get through the crossing and must wait in the queue until the train leaves. In that case, an elongated queue will not only block the traffic at nearby intersections, but also will result in the slowdown or full termination of the mobility of the intersection, or even the entire roadway network in proximity to the railroad [7].
the following characteristics [5]:
The crossing roadways should be secondary in character (such as a minor street with one lane in each direction, an alley, or a driveway) with low traffic volumes and low speed limits.
The road user has sufficient sight distance at the stop line to permit the vehicle to cross the tracks before the arrival of the light rail transit vehicle.
If at an intersection of two roadways, the intersection does not meet the warrants for a traffic control signal. According to Californian path Research Report (2009), a typical Rail-road signalized intersections should be designed in such a way that the crossing controller will receive a train approaching signal from detection equipment. This initiates the warning devices and the necessary traffic signal events including the clearance of tracks, while during the time of train crossing the warning devices will be activated for at least a minimum amount of time prior to the arrival of the train at the crossing. When the automatic crossing gates are lowered and all movements towards the track have stopped, the traffic signal may implement a limited phasing sequence. Finally, after the train crossing, the railroad crossing controller will trigger the automatic gates to rise and stop the flashing signals and horns, and then the traffic is allowed to move normal [8].
1.3. Traffic Characteristics and Traffic Performance
Traffic performance study is a crucial factor for the traffic management, most literatures verify this, among which Nicholas J., Garber & Lester A., Hoel L. reveals that traffic performance has a fundamental importance in developing and designing strategies for intersection control, rural highways, and freeway segments [9].
The traffic characteristic of developing countries is composed of the large number of pedestrians and cyclists compared to European conditions which influences the capacity of the roads as well as the flow of traffic [10]. Comprehensive and updated traffic counts will only rarely be available, and the traffic engineer will have either to conduct extensive traffic surveys or to make do with some rough estimates, depending on the actual need. Often the only data available are the number of passenger cars and other motor vehicles, hence traffic engineering models or measures cannot be applied without a careful analysis of the local conditions [10].
According to Highway and Traffic Engineering in Developing Countries there are three major factors that affect the flow of traffic and road safety conditions, which are composition of traffic, the behavior of road users and the condition of vehicles [10].
1.4. Previous Research Studies on Effect of LRT on Traffic Performance
A research report on “Effects of Light Rail Transit on Traffic Congestion” by Chad Chandler (2004), examines the effects of light rail crossings on average delays experienced
by vehicles using the VISSIM 3.70 computer simulation model. The study examined the following four scenarios:
Isolated crossings of two-lane,
Isolated crossings of four-lane roads,
A case in which light rail transit is located in the median of a street and,
A larger network that includes four crossings.
On this study the effects of variable traffic volumes and light rail crossing frequencies were studied in the isolated intersection scenarios. The scenario with LRT in the median and the larger network examined the effects of different crossing frequencies as well as full traffic signal preemption. The results of the simulated test scenarios indicate that the average additional delays from light rail transit crossings increase with increasing light rail crossing frequencies and increasing traffic volumes up to the roadway’s capacity. As the road enters an over saturated condition, the average total delays continue to increase, but the difference in total delays with and without light rail decreases from the unsaturated condition. The result from this study also revealed that the preemption of traffic signals near light rail crossings increases the total delay experienced by vehicles that are in conflict with the light rail crossing, but it tends to improve travel times for the no conflicting movements due to the increased green time [11]. Based on the results, it was determined that traffic volumes at crossings and the frequency of light rail crossings are important variables that affect the average additional delays experienced by vehicles [11].
[12].
This research has included the following specific objectives:
To characterize the traffic volume of the existing condition at the selected junctions.
To determine the level of service of the selected road-rail at grade intersections.
To evaluate an additional delay experienced by vehicles due to some of the factors that affects the traffic performance on road-rail at grade intersection.
To recommend the possible remedies that will be undertaken to minimize the existing traffic performance problems and for future planning.
2. Materials and Methodology
2.1. Description of the Study Area
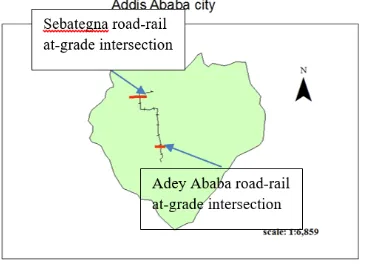
The study area is Addis Ababa city which is the capital city of Ethiopia and the seat of many national and international organizations including the head office of African Union. With an urban population of over 3,400,000, this takes 24 % of the total population of Ethiopia. The urban area is 530. 14 km2, and the density reached 6413.4/km2 [13]. The study corridor is Addis Ababa LRT South-North line, Phase1 which has total length of 16.97km. From this corridor the most congested intersections were selected as study junction purposively, which are located at Sebategna and Adey Ababa based on which their respective names have been used in this study.
Figure 1. Addis Ababa North-south LRT route (source satellite image digitized by GIS software)
2.2. Study Design
In this study both descriptive and explanatory type of survey has been applied, in order to answer this research question. The descriptive one is used to describe the existing condition, while explanatory type is used to determine the effect of at grade road-rail crossing on traffic performance.
The simulation modeling software so called “PTV VISSIM” version 9.0 developed by PTV group has been used for modeling delay of vehicles in different scenarios and for determination of the level of service analysis. It also shows realistic and accurate in every detail.
Generally, VISSIM is a microscopic, time step oriented, and behavior-based simulation tool for modeling urban and rural traffic as well as pedestrian flows, which creates the best conditions to test different traffic scenarios before their realization [14]. Accordingly, three scenarios have been considered in this study, each of them have almost similar procedures except the difference in the volume entry.
2.2.1. Scenario One (Road-Rail at Grade Intersection “with Light Rail Vehicle and Pedestrian Crossing” Model for Actual Case)
This scenario used to indicate the total delay of vehicles due to high volume of vehicles, LRV crossing, pedestrian crossing but excluding the effects of traffic operation problems since every traffic operation condition have been programed and managed by the VISSIM software itself. The level of service of existing intersection have been determined by this scenario, since the simulation in VISSIM were considered and treated as actual case except that traffic operation problems were not to be shown in VISSIM.
2.2.2. Scenario Two (Road-Rail at Grade Intersection “without Light Rail Vehicle Crossing”)
This scenario is similar with the first scenario except that in this scenario light rail vehicle crossings were not considered in order to know the vehicle delay due to high volume of vehicles and pedestrian crossing only. Therefore, both the effects of LRV crossing and traffic operation problems were not shown in this scenario.
2.2.3. Scenario Three (Road-Rail at Grade Intersection “without Pedestrian”)
This scenario is conducted in similar way with the first scenario, Except that pedestrians were not considered in this scenario. This scenario used to determine the effect of pedestrian and total delay of vehicle due to high vehicle volume and LRV crossing only.
Using the above listed three scenarios and with their respective procedure the effects of LRV crossing, and pedestrian crossing were determined as follows.
Additional delay of vehicle due to LRV crossing = vehicle delay of scenario one-vehicle delay of scenario
two
Additional delay of vehicle due to pedestrian crossing = vehicle delay of scenario one-vehicle delay of scenario
three
2.3. Traffic Volume Count
2.4. Road Way and Rail-Way Cross Sectional Geometric Data
Table 1. Road cross sectional geometric data for Sebategna intersection
Direction of
movement Median type
No. of
lane Lane width (m)
North bound Divided by LRT 2 3.5, 3.3
South bound Divided by LRT 2 3, 3.3
West bound Divided 2 3.5
East bound Undivided 1 3.5
Table 2. Road cross sectional geometric data for Adey Ababa intersection
Direction of
movement Median type No. of lane
Lane width (m)
North bound Divided by LRT 2 3.5, 3.3
South bound Divided by LRT 2 3, 3.3
West bound Undivided 2 3.5
East bound Undivided 2 3.5
Table 3. Railway cross sectional geometric data for N-S Addis Ababa’s LRT line
Direction of
movement No. of lane
Width of rack gauge (mm)
Sleepers width(m)
North bound 1 1524 2.4
South bound 1 1524 2.4
3. Results and Discussions
3.1. Traffic Volume Result and Character
3.1.1. Traffic Volume Characteristics of Sebategna Intersection
Figure 2. General Traffic volume characteristics of Sebategna intersection
Figure 3. Traffic volume characteristics of Sebategna intersection in north bound movement
Figure 4. Traffic volume characteristics of Sebategna intersection in south bound movement
Figure 5. Traffic volume characteristics of Sebategna intersection in west bound movement
Figure 6. Traffic volume characteristics of Sebategna intersection in east bound movement
Figure 7. Traffic volume characteristics of Sebategna intersection by vehicle type
Figure 9. Traffic compositions having direct conflict with LRT at Sebategna intersection
3.1.2. Traffic Volume Characteristics of Adey Ababa Intersection
Figure 10. General Traffic volume characteristics of Adey Ababa intersection
Figure 11. Traffic volume characteristics of Adey Ababa intersection in north bound movement
Figure 12. Traffic volume characteristics of Adey Ababa intersection in south bound movement
Figure 13. Traffic volume characteristics of Adey Ababa intersection in west bound movement
Figure 14. Traffic volume characteristics of Adey Ababa intersection in east bound movement
Figure 15. Traffic volume characteristics of Adey Ababa intersection by vehicle type
Figure 17. Pedestrian volume characteristics of Adey Ababa intersection
3.2. Result of Level of Service
The normal level of service for both study junctions have been analyzed through scenario one of this study; in which both LRV and pedestrians were considered for the analysis in order to fit the model with the actual condition of the study area and to estimate the level of service of the actual operating condition.
3.2.1. Sebategna Intersection Level of Service (LOS)
The following acronyms could be used for 3rd column of table 4,5 and for 1st column of table 6.
EB: east bound
EBL: east bound left turn EBP: east bound pedestrians EBR: east bound right turn EBT: east bound through NB: north bound
NB-rail: north bound light rail vehicle NBL: north bound left
NBR: north bound right NBT: north bound through NBU: north bound U-turn PED: pedestrian
SB: south bound SBL: south bound left SBR: south bound right SBT: south bound through SBU: south bound U-Turn
SB-rail: south bound light rail vehicle WB: west bound
WBL: west bound left Turn WBP: west bound pedestrian WBR: west bound right Turn WBT: west bound through
Table 4. VISSIM output of Level of service and average delay for Sebategna intersection
No Movement type
Movement
direction volumes LOS
Average Vehicular Delay (Sec.)
1 Through EBT 142 LOS_E 24.85
2 Right Turn EBR 157 LOS_E 24.43
3 Left Turn EBL 143 LOS_E 63.37
4 Through SBT 178 LOS_F 89.25
5 Right Turn SBR 204 LOS_F 90.01
6 U-Turn SBU 151 LOS_F 114.7
7 Left Turn SBL 186 LOS_F 111.5
8 Through SB_rail 9 LOS_A 0
9 Left Turn WBL 47 LOS_F 85.8
10 Through WBT 53 LOS_E 69.27
11 Right Turn WBR 69 LOS_E 17.83
12 Right Turn NBR 49 LOS_F 382.2
13 U-Turn NBU 56 LOS_F 354.2
14 Left Turn NBL 53 LOS_F 317.4
15 Through NBT 61 LOS_F 338.8
16 Through NBrail 9 LOS_A 0.337
17 Through EBPT 2507 LOS_D 53.41
18 Through WBT 2691 LOS_D 52.49
19 Total/ average 1567 LOS_E 65.5
3.2.2. Adey Ababa Intersection level of Service (LOS)
The level of service for Adey Ababa intersection is better than that of Sebategna intersection with almost similar geometry and an equal LRV volume, but with different volumes of pedestrians and vehicles.
Table 5. VISSIM output of Level of service and average delay for Adey Ababa intersection
No Movement type
Movement
direction volumes LOS
Average Vehicular Delay (Sec.)
1 Through EBT 60 LOS_F 12.38
2 Right Turn EBR 81 LOS_E 6.307
3 Left Turn EBL 79 LOS_E 59.51
4 Through SBT 171 LOS_F 82.93
5 Right Turn SBR 197 LOS_F 85.19
6 U-Turn SBU 145 LOS_F 100.9
7 Left Turn SBL 175 LOS_F 112.2
8 Through SB_rail 9 LOS_A 0
9 Left Turn WBL 81 LOS_D 36.08
10 Through WBT 93 LOS_D 40.12
11 Right Turn WBR 105 LOS_D 19.99
12 Right Turn NBR 64 LOS_F 342.1
13 U-Turn NBU 75 LOS_F 316.8
14 Left Turn NBL 77 LOS_F 298.2
15 Through NBT 75 LOS_F 311
16 Through NBrail 9 LOS_A 0
17 Through EBPT 2679 LOS_D 53.89
18 Through WBPT 2854 LOS_D 52.85
19 Total/ average 1496 LOS_E 66.45794
3.3. Result and Analysis of Average Additional Delay
3.3.1. Additional Delay of Sebategna Intersection
crossing and pedestrian effect have been indicated. At this scenario most of the north and south bound vehicle
movements experience highest delay which corresponds to the level of service LOS_F.
Table 6. Result summary of additional delay due to both LRV and pedestrian crossings at Sebategna intersection
movement
No. of simulated
vehicles
Scenario_1 veh. Delay (Sec./Veh)
Scenario_2 veh. Delay (Sec./Veh)
Scenario_3 veh. Delay (Sec./Veh))
Additional delay due to LRV
crossing (Sec./Veh)
Additional delay due to pedestrian
crossing (Sec./Veh)
EBT 142 0.17 0.37 1.33 -0.2 -1.15
EBR 157 0.16 0.33 1.06 -0.17 -0.9
EBL 143 0.44 0.64 1.43 -0.2 -0.99
SBT 178 0.5 0.48 0.91 0.02 -0.41
SBR 204 0.44 0.41 0.85 0.04 -0.4
SBU 151 0.76 0.67 1.28 0.09 -0.52
SBL 186 0.6 0.56 1.1 0.04 -0.5
WBL 47 0.34 0.41 2.07 -0.08 -1.74
WBT 53 0.36 0.46 0.9 -0.09 -0.53
WBR 69 0.26 0.37 0.23 -0.11 0.03
NBR 49 7.8 7.01 1.19 0.79 6.61
NBU 56 6.32 5.6 1.43 0.73 4.9
NBL 53 5.99 5.62 1.6 0.37 4.39
NBT 61 5.55 5.32 1.12 0.23 4.43
Average Total Delay 29.69 28.25 16.5 1.46 13.22
In the second Scenario (road-rail at grade intersection “without LRV crossing” model for actual case) the average vehicular delay result varies slightly with that of the first scenario. On the other hand, the result of the third scenario has a considerably large variation from the first scenario which shows that the effect of pedestrian on traffic performance have large severity than the effect of LRV crossing. The existence of those high volumes of pedestrian is due to the concentration of pedestrian from the neighborhood surrounding area which was blocked by the route of LRT passes through at ground level. Therefore, the effect of pedestrian on traffic performance would be reflected as the effect of road-rail at-grade crossing.
Figure 17. The composition of additional delay due to pedestrian and due to LRV crossing at Sebategna intersection
In determining the effect of LRV crossing by subtracting vehicle delay of scenario two from scenario one, some of the results get negative value but it doesn’t mean that the absence of LRV add an additional delay, the reason for this
would be since the traffic simulation have been different with different time and hence the vehicular delay will vary at different time. The main thing to be considered should be the additional total average delay which was 1.46 sec./veh.
In similar manner the effect of pedestrian crossing has been determined by subtracting vehicle delay of scenario three from scenario one. Again the negative value in this result doesn’t mean the absence of pedestrians add severity on vehicular delay, instead the total average additional delay of 13.22 sec./veh shows existence of pedestrian add greater severity on vehicular delay than that of LRV crossing.
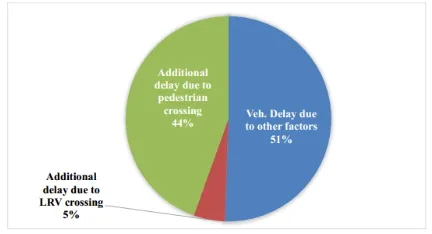
As shown from the figure below the additional delay due to LRV crossing have a considerable less effect on the existing traffic performance problems. Pedestrians contribute greater severity than LRV crossing for the vehicular delay.
Out of the total delay experienced by vehicles, 44% of total delay was due to pedestrian crossing, and only 5% of total delay has been contributed by LRV crossing while other 51% of total delay was due to other factors mainly high volume vehicles.
3.3.2. Additional Delay of Adey Ababa Intersection
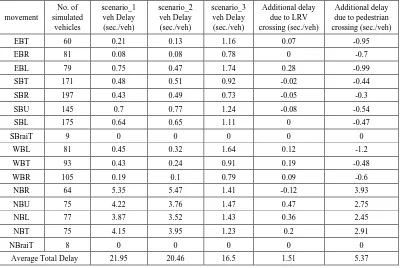
Table 7. Result summary of additional delay due to both LRV and pedestrian crossings for Adey Ababa intersection
movement
No. of simulated
vehicles
scenario_1 veh Delay (sec./veh)
scenario_2 veh Delay (sec./veh)
scenario_3 veh Delay (sec./veh)
Additional delay due to LRV crossing (sec./veh)
Additional delay due to pedestrian crossing (sec./veh)
EBT 60 0.21 0.13 1.16 0.07 -0.95
EBR 81 0.08 0.08 0.78 0 -0.7
EBL 79 0.75 0.47 1.74 0.28 -0.99
SBT 171 0.48 0.51 0.92 -0.02 -0.44
SBR 197 0.43 0.49 0.73 -0.05 -0.3
SBU 145 0.7 0.77 1.24 -0.08 -0.54
SBL 175 0.64 0.65 1.11 0 -0.47
SBraiT 9 0 0 0 0 0
WBL 81 0.45 0.32 1.64 0.12 -1.2
WBT 93 0.43 0.24 0.91 0.19 -0.48
WBR 105 0.19 0.1 0.79 0.09 -0.6
NBR 64 5.35 5.47 1.41 -0.12 3.93
NBU 75 4.22 3.76 1.47 0.47 2.75
NBL 77 3.87 3.52 1.43 0.36 2.45
NBT 75 4.15 3.95 1.23 0.2 2.91
NBraiT 8 0 0 0 0 0
Average Total Delay 21.95 20.46 16.5 1.51 5.37
Figure 18. The composition of additional delay due to pedestrian and due to LRV crossing at Adey Ababa intersection
4. Conclusions and Recommendations
4.1. Conclusion
In this study the following major conclusions were drawn:
The average peak hour traffic volume results of both study junction shows that out of total peak hour volume of 2369veh/hr and 2645veh/hr, the car category took 2022veh/hr and 2364veh/hr for Sebategna and Adey Ababa intersections respectively. Most movements were north and south bound through movements for both intersections. The west bound left turn and north bound right turn movements were greater in volume than other left and right turn movements at sebetegna intersection, while the east
bound left turn and U-turning movement were greater than other turning movements at Adey Ababa intersection. The reason for both cases would be due to existence of market place around Sebategna intersection and absence of the nearby east-west vehicular crossing location around Adey Ababa intersection. Based on the average peak hour traffic volume data, 35% of the average peak hour traffic volume for Sebategna intersection has a direct conflict with N-S Addis Ababa’s LRT, while for Adey Ababa intersection about 48% of all vehicles pass through the junction have a direct conflict with N-S Addis Ababa’s LRT. Accordingly, the total delay due to high vehicular volume and other factor for Adey Ababa intersection became 69% which was greater than 51% of Sebategna intersection.
The level of service for different movements at Adey Ababa intersection was between LOS_D and LOS_F while that of Sebategna intersection was under the capacity of LOS_E and LOS_F except LRV and pedestrian’s movements which were under capacity of LOS_A and LOS_D respectively, since first priority was given for LRV and second priority was for pedestrians. This shows that the level of service of Adey Ababa intersection was relatively better than that of Sebategna, and the reason could be the pedestrian volume of 5772 ped/hr. for Sebategna intersection is more than that of Adey Ababa which is 4472 ped/hr.
reduced to 24% from 44% of Sebategna intersection. On the other hand, additional delay due to LRV crossing effect for Adey Ababa intersection has been increased to 7% from 5% of Sebategna intersection. For both intersections most of delay experienced by vehicles was contributed from high volume of pedestrian crossing. Therefore, more of the effect of road-rail crossing on traffic performance was due to absence of nearby pedestrian overpass crossing facility along the LRT route.
4.2. Recommendations
4.2.1. Recommendation for Existing facility
Based on the result of this study and findings the following recommendations have been given by the researcher.
Another alternative road way should be used by vehicles whose destination was Merkato market center from southern and western part of the city for Sebategna intersection.
The Addis Ababa city transport planning management office has to provide separate and clearly marked lane for pedestrian and vehicles at both study junctions.
As it was indicated from the result of this study most of vehicular delay was encountered due to high volume of pedestrian crossing. Therefore, the Addis Ababa city transport planning management office and the Addis Ababa city road authority should be responsible to construct pedestrian overpass crossing facility along N-S Addis Ababa’s LRT, particularly in business and commercial area where large number of pedestrians demanding to cross the LRT route like around Sebatena and Adey Ababa.
Further research should be carried for further investigation and to improve the existing result by collecting more data. Among those data traffic volume is the one and it is recommended to count for seven days. And also by collecting the actual travel time data, an additional delay due to traffic operation problem could be determined and hence the effectiveness of the existing traffic operation method could be evaluated quantitatively.
4.4.2. Recommendation for Future Planning and Design
Road-rail crossing having high volume of vehicle and pedestrian should be designed as grade separated.
Pedestrian crossing facility should be separated from road-rail crossing.
An adequate pedestrian overpass crossing facility should be provided along LRT line on town section
where it`s route pass at ground level with in 100m to 200m distance depending on the purpose of surrounding area and density of population living around.
REFERENCES
[1] African development bank; report on tracking Africa’s Progress in Figures 2014.
[2] Jemere Y. (MSc. CEng), Railway Development in Ethiopia. Presentation on Horn of Africa Nairobi, Kenya; 12 – 13 March 2012.
[3] Barry, M.: the revolution in Light Rail, Frankfort press, 1991. [4] Transportation Research Board, this is Light Rail Transit;
Washington, D.C, November 2000.
[5] US Department of transportation; manual on uniform traffic control devices (MUTCD), United States of America, December 2000.
[6] Mark D. Wooldridge & et al; at-grade intersections near highway-railroad grade crossings. Research report, Texas Transportation Institute, January 2000.
[7] Pei-Sung L, Zhenyu W & et al; Coordinated Pre-Preemption of Traffic Signals to Enhance Railroad Grade Crossing Safety in Urban Areas and Estimation of Train Impacts to Arterial Travel Time Delay Coordinated Pre-Preemption of Traffic Signals to Enhance Railroad Grade Crossing Safety in. 2014. [8] Li M, Wu G, & et al; Analysis toward Mitigation of
Congestion and Conflicts at Light Rail Grade Crossings and Intersections. 2009.
[9] Nicholas J. Garber Lester A. Hoel. Traffic and Highway Engineering. Fourth Edition University of Virginia; 2009. [10] Boye-Moller JC, Jan K, J.de V, Jorgen K.Highway_and_Tra
ffic_Engineering in Developing Countries.pdf. 1996, editor. Chapman & Hall; 1996.
[11] Chandler C, Hoel L A. Effects of Light Rail Transit on Traffic Congestion. Research report, University of Virginia, 2004. [12] Endeshaw Y. Harmonization of Light Rail Transit and
Principal Arterial Streets. Adiss Ababa: 2013.
[13] https://en.wikipedia.org/wiki/Addis_Ababa downloaded on oct.2, 2017 at3:20 pm.
[14] PTV Group, VISSIM 9 user manual. Karlsruhe; 2017. [15] Y. Wiseman. In an Era of Autonomous Vehicles, Rails are