available algorithms will be a bit sluggish in processing the data. The proposed algorithm uses parallel processing engine to resolve this delay problem in the current scenario. The algorithm in parallel finds out the superior seed set in the network and expands it in parallel to find out the community. The work shows amazing improvement in the runtime and also detects quality groups in the network.
Key words: Overlapping community detection, Seed selection, Graph parallel processing, seed expansion
AMS subject classifications. 65Y05, 68R10, 91D30
1. Introduction. Complex networks are commonly utilized for modeling the synergies in real-world sys-tems in various areas, such as sociology, biology, knowledge dispersion and many different fields. One important feature of this complex network is that the nodes are tightly connected with each other in groups and in turn, the groups will be loosely connected to each other. The tightly connected groups are called as communities. The communities usually have common properties. Therefore, finding the communities from a complex network could give many insights about the network. The community detection can be done in two different ways: Firstly, the network partition can be calculated to cut the graph into partitions. Secondly, the selection of seed nodes will be done and the local communities will be centered around these seeds.
The proposed work is of the latter category where, the most important nodes in the community will be identified using a parallel superior seed set selection (P4S) algorithm. The identified superior seeds will be ex-panded by their neighborhood till it reaches the next seed. Since the algorithm expands using the neighborhood, it will form the closely knitted group around the seed nodes.
Seed selection process is an important process in the field of network science. Usually, the measures for calculating the important nodes from the target network is named as centrality measures [24, 25]. There are many centrality measures, to name a few, Degree [31], Betweenness [34], Closeness [18], Eigen vector [35], Page Rank [32] and so on. These seed nodes play an important role in finding a good community in community detection problem and fast spreading in information diffusion application.
2. Related Works. Data nowadays is huge and need to be processed as fast as possible. There is a need of parallel algorithms to process the volume of data which comes in high velocity. Processing the data in the faster may fetch the organizations a good profit. There are lots of seed selection algorithms available for different applications. Each application might have to adopt different seed selection algorithms which match the application requirement. For example, if the application is a marketing application, the out-degree centrality or the page rank centrality may be used for the seed selection process. So, each centrality measures[9, 10, 2] will have their own limitations with various applications. The proposed method finds out a generic seed by combining various centralities.
There are some related works available in the literature. There are some diffusion models [40, 28, 21, 7] and community detection algorithms [36, 3, 26, 14, 11] which will have a seed selection part in their model [22, 12, 27, 6]. Some of the algorithms selects the seeds in random and optimize its result at the end of the process [15]. There is a excellent study on seed nodes in [13]. Evolutionary algorithms are used to find out the seed nodes in some cases [34].
∗Department of Computer Science and Engineering, Karunya institute of technology and sciences, Coimbatore, Tamilnadu, India. ([email protected], [email protected]).
There are several graph computations algorithm available for large-scale graphs, various parallel modules have been developed, e.g., Pregel [20], GraphLab [19] Giraph++ [8], GraphX [37], GRACE [30], GPS [23] and Blogel [38] ,based on MapReduce [5] and BSP (Bulk Synchronous Parallel) models [29].
The proposed algorithm uses GraphX to process the graph in parallel. Our previous work Superior seed set selection algorithm (4S) [1] was extended to parallel processing in this article. The experiment result proves that the proposed parallel algorithm can find out the good clusters fastest then the available algorithms.
3. Problem Statement. Some of the seed selection algorithms which are already available are using random nodes for selecting the seed node. The selection of a seed node or a seed set is really important in the algorithms which use seeds to find out communities. Since, the community detection algorithm needs to work in unsupervised way the seeds should be excellent to obtain a perfect local community. The selection of excellent seeds will reduce the number iterations in the community detection algorithm.
Nowadays the data need to be processed is large because of the growing use of internet and social media. Reducing iterations will not be enough to make the algorithm work faster. There is a need of parallel algorithms which can process the data in a synchronized manner. Parallel processing algorithms are modern nowadays. The uses of these kinds of algorithms will be fast and effective.
4. Problem Formulation. Assuming an undirected graphG = (V, E). The nodes of the graph G be n=|V|nodes and the edges of the graphGbem=|E|. The overlapping community detection algorithm is used to determine the communityC=C1, ...., Cxof all the nodes ofG. |C|be the number of communities identified.
In the proposed work,|C|is the number of seed node selected from parallel superior seed set selection algorithm. Various centrality measures µi for a node i can be calculated which will be the importance measure of
node i. Let us assume the graph to be undirected. The traditional methods uses any one of the centrality measures with respect to the use case, to define its seed set S(G) = si, sj, . . . , sκ where si, sj, . . . , sκ ∈ V.
Some models pick seed set randomly and gets the parameter κ as input, to decide the number of seeds in the set. The difficulty in the conventional methods is that, the seed set need to be adjusted according to the circumstances of the problem. The proposed parallel, unified model determines the superior seed setS(G) from the centrality measures collectively. This article introduces a threshold valueτ, which limits the number of seed nodes selected for the S(G).
A community may be basically described as a collection of nodes that may share common features, or engage in similar roles in the network. Also, it is tightly knitted groups with a high density of inter community ties and a low density of intra-community ties. The proposed algorithm produces results that are composed of one of two types of assignments, crisp assignment of nodes or fuzzy assignment of nodes. With crisp assignment, the relationship between a node and a cluster is binary. That is, a node ieither belongs to community C or does not. With fuzzy assignment, each node is associated with two or more communities. Throughout the article, the terms set, cluster, and community are used interchangeably.
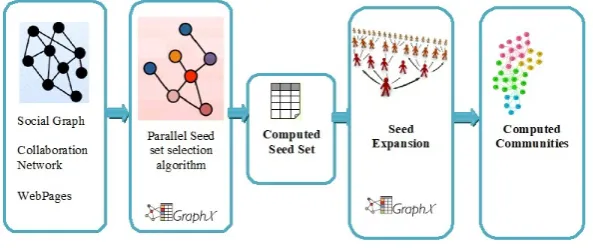
5. Proposed work. The main idea of this work is to use the parallel processing architecture to find out the best seeds and subsequently the best seeds from P4S algorithm will be used to find out the communities hidden in the network. The work has been done with GraphX a module in spark parallel processing engine. The algorithms for the Parallel seed selection and parallel community detection has been explained below in the following sections. The parallel community detection framework is depicted in the Fig 5.1. The input of the algorithm will be the unlabeled network, for example, social graph or collaboration networks or the network of web pages. The output of the work will be the expanded communities from the selected seeds. The goodness of the communities is tested by comparing the inter-density and intra-density of the communities along with the graph density. The algorithm for the P4S has been given in the Algorithm 1. Algorithm 2 shows the parallel seed set expansion algorithm which finds out the communities.
Fig. 5.1.Parallel community detection framework
Algorithm 1Parallel Superior Seed Set Selection Algorithm (P4S)
1: procedureP4S(g, τ) ◃ Parallel Superior Seed set selection(P4S)
2: READ graphG(V, E)
3: COMPUTE
4: degree centrality d 5: eigen value centralitye 6: local clustering coefficientl
7: page rank centralityp ◃ Parallel
8: SORT d, e, l, p
9: forδdo ◃ Parallel
10: Thresholdτ ←vertex count/δ
11: Fetchτ count of top nodes from list ofd, e, l, p 12: Intersect (d, e, l, p)
13: returnSuperiorSeedsSetS(g) ◃top seeds
Algorithm 2Parallel community detection using neighborhood expansion
1: procedureSeedExpansion(g, S(g)) ◃ Parallel Seed Expansion
2: COM P U T E
3: DistanceMatrix/S(g)
4: MaximumExpansionThresholdExM ax τ
5: forS(g)do ◃ Parallel
6: while(do!ExM ax τ )
7: NeighbourhoodExpansion
8: DETERMINE nor selected nodes V φ
9: forV φdo ◃ Parallel
10: DETERMINE Neighbors ofV φ−N eiV φ
11: DegreeN eiV φ
12: Assign node to the max degree nodes community
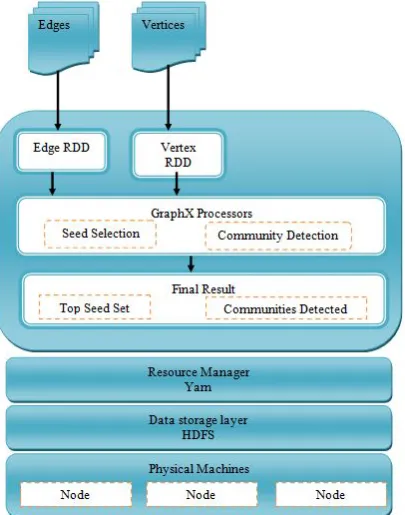
Fig. 5.2.Implementation of Parallel 4S and Parallel community detection algorithm in Spark architecture
The GraphX processors will be used to compute the superior seed set and the seed expansion of the node to form community in parallel. Three node clusters was used for computing the communities in parallel.
5.1. Parallel Superior Seed Set Selection (P4S). Parallel superior seed set selection algorithm ex-tracts the very important nodes in the input graph. The input data will be stored in the distributed file system for further processing. Centrality measures are used to coin out the important nodes in the network. Each centrality measure will have its own importance and use cases to work on. Combining these centrality measures can identify good seeds across all the centrality measures. For the experiment done for this work Page rank, Degree, Eigen value, Local clustering coefficient centralities was used. The centralities measure calculation will automatically run in parallel when GraphX is used. Sorting according to the centrality ranks will be done for all centrality measures used. A threshold value will be used to split the top ranks for all measures. Finally, set intersection of the top nodes from each centrality measure will be done to get the superior seed set. Fig. 5.3 depicts the process of finding the superior seed set.
5.2. Parallel Community Detection. Community detection from seed by expanding greedily through neighbors is a classical process. The proposed work is the modified version of the seed expansion in a parallel way. Since we have multiple seeds the algorithm will expand in parallel from the seeds till it reaches the next seed and stops expanding. The distance between the seeds will be calculated by the distance matrix. The ExM ax
τ defined in the Algorithm 2 is the maximum expansion limit. The nodes which are not selected in the
first iteration will be picked and added to its neighbors community. In case of more than one neighbor the highest degree node will add the ungrouped node to its community.
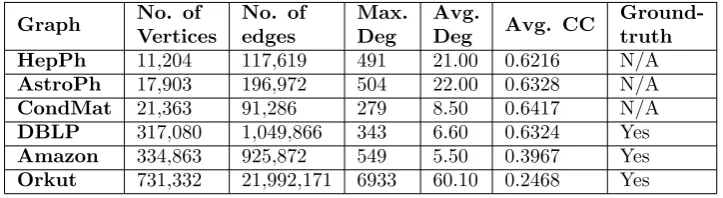
6. Experiment. The real-world datasets used for the experiments are from [17]. All the datasets are connected, undirected graphs. The datasets are from various categories like collaboration networks and product networks. The detailed information about the datasets is given in the Table 6.1.
Fig. 5.3. Parallel 4S algorithm for finding top seed set
Table 6.1
Summary of real-world networks used
Graph No. of
Vertices
No. of edges
Max. Deg
Avg.
Deg Avg. CC
Ground-truth
HepPh 11,204 117,619 491 21.00 0.6216 N/A
AstroPh 17,903 196,972 504 22.00 0.6328 N/A
CondMat 21,363 91,286 279 8.50 0.6417 N/A
DBLP 317,080 1,049,866 343 6.60 0.6324 Yes
Amazon 334,863 925,872 549 5.50 0.3967 Yes
Orkut 731,332 21,992,171 6933 60.10 0.2468 Yes
by n authors, then their relationship will be represented as a clique in the network. HepPh, AstroPh, and CondMat networks are formed based on the journal submitted to High Energy Physics (Phenomenology) group, Astrophysics group, and Condensed Matter Physics group under the arXiv e-print service, respectively. The DBLP network is formed based on the DBLP computer science bibliography website.
Product network. In the Amazon product network, vertices denote products and edges denote co-purchasing information. If products u and v are frequently co-purchased, then there will be an undirected edge between them.
Social networks. In a social network, vertices denote users of the social network and the edges denote social communications between them. Users can construct a friendship relationship with each other in this web application.
7. Community Evaluation.
7.1. Intra-Density, Inter-Density and Graph Density. The cohesiveness of the edges in a graph G can be readily attained by calculating the graph density ρ.
ρ= |E| n(n−1)/2 (7.1)
Consider c is a community in the given network G where|G|=n and |c| =nc. Internal edges are edges which have it both sides situated inside the community c and the external edges of communityc refer to the edges which connect a vertex in c to the rest of the graph. The internal degree of vertexv in communityc is denoted bykint
v is the number of edges connectingvto other vertices incand the external degree ofvdenoted as
kext
v is the number of edges connectingvto the rest of the graph. The intra cluster densityδi(c) of a community
c is the ratio between the number of internal edges ofc and the number of all possible internal edges:
δi(C) = |Ei|
nc(nc−1)/2
(7.2)
where |Ei|is the count of internal edges in the community.
Similarly, the inter-cluster densityδe(c) is the ratio between the number of inter-cluster edges ofc and the
number of all possible inter-cluster edges:
δe(C) = |Ee|
nc(n−nc)
(7.3)
where|Ee|is the count of inter community edges in the community.
The proposed parallel seed set selection algorithm has been implemented in the real-world datasets and has given a better result. The goodness of the community has been tested with the inter-cluster and intra-cluster density. Usually For overlapping communities, internal and external metric values will be used. Because, combination metrics and modularity scores will result in confusing values that should be inconsistent[15]. The goodness of the community using graph densityρ, intra-cluster densityδi(c) and inter cluster densityδe(c) can
be given as:
δi(C)> ρ > δe(C)
(7.4)
The comparison of inter-cluster density, intra-cluster density and graph density of the real datasets are plotted in the result and discussion section. The experiment was done for the seed sizes 71, 84, 114, 128, 152, 172, 207, 240 and 270.
7.2. Clustering Coefficient. A clustering coefficient is a measure of the degree to which nodes in a graph are inclined to tie together. Research results suggests that in most real-world networks, and in some social networks, nodes are likely to create tightly connected groups characterized by a pretty high density of ties; this likelihood will greater than the average probability of a connection randomly established between two nodes [33].
The local clustering coefficientli for a vertexiis then given by the ratio of links between the nodes within
its neighbors divided by the number of edges possible between them. The local clustering coefficient for an undirected graph is given as:
Ci=
2|ej,nei:vj, vnei∈Ni, ej,nei∈E|
neii(neii−1)/2
(7.5)
where vertex vj, has neii neighbors,
neii(neii−1)
2 edges will be the maximum possible edges exist among the
vertices within the neighborhood.
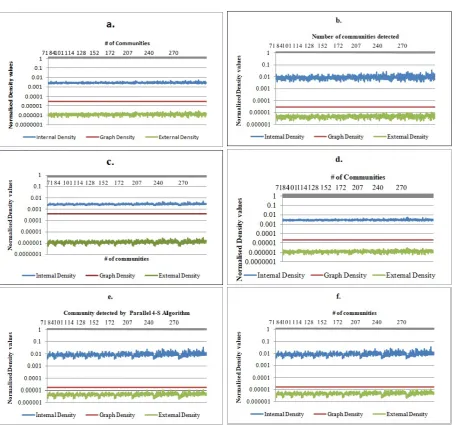
8. Result and discussion. The problem of community assessment is still an open and difficult problem in spite of huge sum of work addressing this topic [13]. The experiment done on the real-world datasets are given on the summary Table 6.1. The values of inter-density, intra-density and graph density are compared to find the goodness of the cluster. The result from the six real-world datasets specified in Table 6.1 has been plotted in the Fig 8.1. Every dataset used for the experiment passes the test and it goes hand in hand with the Eq. (7.4). In all cases the intra-cluster density δi(c) from Eq. (7.2) of all the communities identified is greater
than the graph density ρand the inter-cluster densityδe(c) from Eq. 7.3 of nodes after finding communities is
Fig. 8.1.Data comparison between the inter-cluster density, intra-cluster density and graph density: (a) Amazon dataset (b)
AstroPh (c) CondMat (d) DBLP (e) HepPh (f ) Orkut
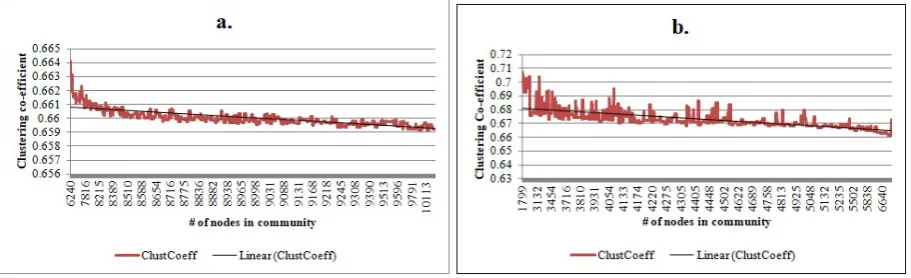
The clustering coefficient can be a measure to find out the closely connected groups. The clustering coeffi-cient equation is given the Eq. 7.5. The comparisons of clustering coefficoeffi-cient with the number of communities are given in the Fig. 8.2. The clustering coefficient of two datasets namely Amazon Fig. 8.2a and AstroPh Fig. 8.2b are shown. The result shows an increasing trend in the clustering coefficient as the number of seeds increases. This shows that the larger the seed set higher the density of the community. Fig. 8.3 shows the comparison of clustering coefficient and number of nodes in each community. The result of comparison of av-erage clustering coefficient of the entire network and the avav-erage community clustering coefficient is compared in the Fig. 8.4a and the comparison of average degree of the entire graph and the average degree of all the communities detected are shown as a bar plot in Fig. 8.4b. The plots clearly show that the density of the sub graphs increases after the community detection.
Fig. 8.2.Number of communities VS Clustering Coefficient (a) Amazon (b)AstroPh
Fig. 8.3. Number of nodes in the community VS Clustering Coefficient (a) Amazon (b)AstroPh
the Table 8.1. OSLOM [16], DEMON [4], Big Clam [39], nise-sph-fppr and nise-grc-fppr from [35].
As it can be clearly seen in the Table 8.1 the proposed P4S algorithm with seed expansion algorithm works faster than the other algorithms compared. Since it is parallel execution, the algorithm finishes its execution faster than the other algorithms compared.
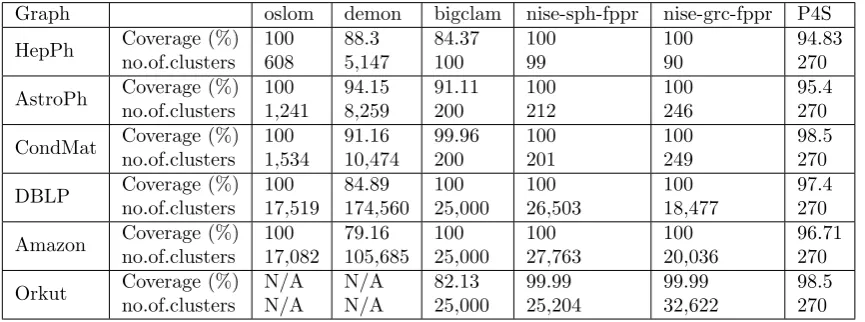
The details in the Table 8.2 depict the coverage (%) of each algorithm. In this case the proposed algorithm doesnt gives 100% as nise-sph-fprr and nise-grc-fppr [35]. When the number of communities is considered the proposed P4S method gives better result than the algorithms compared.
Fig. 8.4.(a) Comparison of average clustering coefficient of nodes before and after community detection. (b) Comparison of average degree of nodes before and after community detection.
Table 8.1
Running times of different methods on our test networks in (Minutes)
Graph oslom demon bigclam nise-sph-fppr nise-grc-fppr P4S
HepPh 19.26 0.45 11.383 0.36 2.8 0.3
AstroPh 38.05 0.7 48.016 0.6 2.43 0.483
CondMat 20.65 0.83 7.35 0.6 1.23 0.45
DBLP 350 233 433 18.33 29.733 12.6
Amazon 175 115 85 37.6 42.716 20.3
Orkut N/A N/A 4199 43.916 236 31.83
Table 8.2
Returned number of communities and graph coverage of each algorithm
Graph oslom demon bigclam nise-sph-fppr nise-grc-fppr P4S
HepPh Coverage (%)
no.of.clusters 100 608 88.3 5,147 84.37 100 100 99 100 90 94.83 270
AstroPh Coverage (%) no.of.clusters 100 1,241 94.15 8,259 91.11 200 100 212 100 246 95.4 270
CondMat Coverage (%) no.of.clusters 100 1,534 91.16 10,474 99.96 200 100 201 100 249 98.5 270
DBLP Coverage (%)
no.of.clusters 100 17,519 84.89 174,560 100 25,000 100 26,503 100 18,477 97.4 270
Amazon Coverage (%)no.of.clusters 10017,082 79.16105,685 10025,000 10027,763 10020,036 96.71270
Orkut Coverage (%)
REFERENCES
[1] R. Belfin, G. E., and P. Br´odka. Overlapping community detection using superior seed set selection in social networks. Computers and Electrical Engineering, 2018.
[2] P. Bonacich. Power and Centrality: A Family of Measures. American Journal of Sociology, 1987.
[3] T. Chakraborty, S. Srinivasan, N. Ganguly, A. Mukherjee, and S. Bhowmick. Permanence and Community Structure in Complex Networks. 11(2), 2016.
[4] M. Coscia, G. Rossetti, F. Giannotti, and D. Pedreschi. DEMON: a Local-First Discovery Method for Overlapping Commu-nities. 2012.
[5] J. Dean and S. Ghemawat. MapReduce: Simplified Data Processing on Large Clusters. Communications of the ACM, 2008. [6] S. Dhamal, P. K. J., and Y. Narahari. Information Diffusion in Social Networks in Two Phases. IEEE Transactions on
Network Science and Engineering, 4697(c):1–1, 2016.
[7] F. Erlandsson, P. Brd´oka, and A. Borg. Seed selection for information cascade in multilayer networks.Studies in Computational Intelligence, 689:426–436, 2018.
[8] W. Fan, J. Xu, X. Luo, Y. Wu, W. Yu, and R. Xu. GRAPE: Conducting Parallel Graph Computations without Developing Parallel Algorithms. pages 30–41.
[9] L. C. Freeman. Centrality in Social Networks. Social Networks, 1978.
[10] L. C. Freeman. Centrality in social networks conceptual clarification. Social Networks, 1978.
[11] J. Han, W. Li, Z. Su, L. Zhao, and W. Deng. Community detection by label propagation with compression of flow. 2016. [12] L. G. S. Jeub, M. W. Mahoney, P. J. Mucha, and M. A. Porter. A Local Perspective on Community Structure in Multilayer
Networks. volume 5, pages 144–163, 2015.
[13] R. Kanawati. Seed-Centric Approaches for Community Seed-Centric Algorithms : A Classification Study. pages 197–208, 2014.
[14] R. Kanawati. YASCA: An Ensemble-Based Approach for Community Detection in Complex Networks. Algorithmica, 76(4):657–666, 2014.
[15] A. Lancichinetti and S. Fortunato. Community detection algorithms: A comparative analysis.Physical Review E - Statistical, Nonlinear, and Soft Matter Physics, 80(5):1–11, 2009.
[16] A. Lancichinetti, F. Radicchi, J. J. Ramasco, and S. Fortunato. Finding statistically significant communities in networks. PLoS ONE, 6(4), 2011.
[17] S. Large and N. Dataset. Stanford Large Network Dataset Collection, 2013.
[18] Y. Li, Y. Wang, J. Chen, L. Jiao, and R. Shang. Overlapping community detection through an improved multi-objective quantum-behaved particle swarm optimization. Journal of Heuristics, 21(4):549–575, 2015.
[19] Y. Low, J. Gonzalez, A. Kyrola, D. Bickson, C. Guestrin, and J. M. Hellerstein. GraphLab: A New Framework for Parallel Machine Learning. The 26th Conference on Uncertainty in Artificial Intelligence (UAI 2010), 2010.
[20] G. Malewicz, M. H. Austern, A. J. Bik, J. C. Dehnert, I. Horn, N. Leiser, and G. Czajkowski. Pregel: a system for large-scale graph processing. Proceedings of the 2010 international conference on Management of data - SIGMOD ’10, 2010. [21] R. Michalski, T. Kajdanowicz, P. Br´odka, and P. Kazienko. Seed selection for spread of influence in social networks: Temporal
vs. static approach. New Generation Computing, 32(3-4):213–235, 2014.
[22] C. H. Mu, J. Xie, Y. Liu, F. Chen, Y. Liu, and L. C. Jiao. Memetic algorithm with simulated annealing strategy and tightness greedy optimization for community detection in networks.Applied Soft Computing Journal, 34:485–501, 2015.
[23] S. Salihoglu and J. Widom. GPS : A Graph Processing System. SSDBM Proceedings of the 25th International Conference on Scientific and Statistical Database Management, 2013.
[24] A. Sol, S. G. e-Ribalta, Manlio De Domenico, and A. A. Omez. Random walk centrality in interconnected multilayer networks. Physica D: Nonlinear Phenomena, 323-324:73–79, 2016.
[25] L. Sol´a, M. Romance, R. Criado, J. Flores, A. Garc´ıa del Amo, and S. Boccaletti. Eigenvector centrality of nodes in multiplex networks.Chaos, 23(3):1–11, 2013.
[26] G. Song, Y. Li, X. Chen, X. He, and J. Tang. Influential Node Tracking on Dynamic Social Network: An Interchange Greedy Approach. IEEE Transactions on Knowledge and Data Engineering, 29(2):359–372, 2017.
[27] A. Srivastava, C. Chelmis, and V. Prasanna. Social influence computation and maximization in signed networks with compet-ing cascades. Proceedings of the 2015 IEEE/ACM International Conference on Advances in Social Networks Analysis and Mining, ASONAM 2015, pages 41–48, 2015.
[28] V. Tejaswi, P. V. Bindu, and P. S. Thilagam. Diffusion models and approaches for influence maximization in social networks. In2016 International Conference on Advances in Computing, Communications and Informatics, ICACCI 2016, pages 1345–1351, 2016.
[29] L. G. . V. . Valiant. A Bridging Model for Parallel Computation.Communications of the ACM, 1990.
[30] G. Wang, W. Xie, A. Demers, and J. Gehrke. Asynchronous Large-Scale Graph Processing Made Easy. Cidr, 2013. [31] M. Wang, C. Wang, J. X. Yu, and J. Zhang. Community Detection in Social Networks : An In-depth Benchmarking Study
with a Procedure-Oriented Framework.Proceedings of the VLDB Endowment, pages 998–1009, 2015.
[32] Y. Wang, B. Zhang, A. V. Vasilakos, and J. Ma. PRDiscount: A Heuristic scheme of initial seeds selection for diffusion maximization in social networks. InLecture Notes in Computer Science (including subseries Lecture Notes in Artificial Intelligence and Lecture Notes in Bioinformatics), volume 8588 LNCS, pages 149–161, 2014.
[33] D. J. Watts and S. H. Strogatz. Collective dynamics of small-world’ networks.Nature, 393(6684):440–442, 1998. [34] M. Weskida. Evolutionary Algorithm for Seed Selection in Social Influence Process. pages 1189–1196, 2016.