Impact Factor: 5.515
GEO IP DETECTION OF CREDIT
CARD FRAUD USING K-NEAREST
NEIGHBOR ALGORITHM
P.Gayathiri
1, M.Punithavalli
21
Research Scholar, Bharathiar University,
[email protected]
2
Associate Professor, Bharathiar University,
[email protected]
Abstract
In modern retail market environment e-commerce has rapidly gained a lot of attention and also provides
instantaneous transactions. Nowadays credit card frauds are increasing day by day due to the development of
information technology around the world. This paper focus on K-Nearest Neighbor Euclidean distance can
categorize the data whether the transaction data is fraud or genuine. The geo location data track the customer
behavior is help to reduce the fraud for online merchants. IP Geo Location implement in K-Nearest Neighbor
and analysis of result given the higher performance accuracy.
Keywords
: Credit Card Fraud, K-Nearest neighbor, IP Geo Location, Euclidean Distance, Latitude, Longitude
1.
Introduction
Credit card a fraud resulted in losses amounting to $11.27 billion during 2012. Card issuers and merchants incurred 63% and 37% of those losses, respectively, with the following transactional breakdown. Card losses occur from the counterfeit cards through the Card Not Present Fraud . Fraud losses accounted for roughly 5.22₵ per $100 in total volume, up from 5.07₵ per $100 in 2011.In 2012, US accounted for 47.3% of the worldwide payment card fraud losses but generated only 23.5% of total volume. Identity theft is a form of fraud that often results in unauthorized credit card transactions. In 2014 to 2015 identity theft cases increases at 58%.Retailers’ revenue lost to online fraud increased over the past two years to reach an estimated $3.5 billion, up 3% from $3.4 billion in 2011 and 30% from $2.7 billion in 2010. The average valid orders ticket value dipped to $149 in 2012 from $150 in 2011.When looking at the percentage of fraudulent orders in the context of total revenue of online fraud average rate is low. The average percentage of online revenue lost to fraud was 0.9% last year, down from 1.0% in 2011.As a result financial institutions and merchants assume responsibility for most of the money lost as a result of fraud. For example, card issuers bore a 63% share of fraudulent losses in 2012 and merchants assumed the other 37% of liability, according to the Nilson Report August 2013.
Impact Factor: 5.515
transaction if it is fraud or Non Fraud. The experimental result shows the performance analysis of K-Nearest Neighbor Algorithm and also compared on the basis of misclassification and correct classification rate. In terms of performance accuracy and the required amount of data for generating the robust model. This paper focus on online credit card fraud detection and evaluate various techniques that can be used in detecting fraudulent transactions of card-not-present payment systems. Further analysis is thus required to be able to isolate fraudulent usage. K-Nearest Neighbor Algorithm can analyse the data and Detect Long IP Distance. This Research investigate online orders of each customer should be legitimate or fraudulent.
2.
Literature Survey
Olszewski (2014)Knowledge-Based Systems proposed the matrices visualization on the SOM grid, which constitutes the main contribution of this paper. A common major difficulty associated with all those fraud detection fields is that there is a large amount of data that needs to be analyzed, and simultaneously Training data contains small number of fraudulent samples. So supervised techniques inhibs and limit the application. Soltani Halvaiee and Akbari (2014) proposed credit card fraud detection using Artificial Immune Systems (AIS), and introduce a new model called AIS-based Fraud Detection.Model (AFDM) an immune system inspired algorithm (AIRS) improve the performance accuracy . The problem with FP and FP parameters is that they do not represent the efficiency of the fraud detection system which includes the processing cost, the cost of reputation loss, and the amount of money involved in each fraudulent transaction. Bhattacharyya et al. (2011) proposed feature selection, and performance metrics for credit card fraud. patterns to understand complex problems, and exploiting this fact can be a powerful tool in comprehending the results of data mining problems. Humpherys et al. (2011) proposed This study is the first to propose a systematic textual feature set for FSF detection. Second, this research introduces new constructs for Financial Status Fraud detection literature. The average testing accuracy, recall, Fscore, and FPR of combination method are better than that only using analytic framework while average precision and FNR are a little bit worse. Cecchini et al. (2010) proposed empirical risk minimization—it focuses solely on reducing the error over the training set. As is well known, empirical risk minimization often results in over fitti ng.
3.
Methodology
The Nearest Neighbor is a simple classification technique used for pattern recognition, which says that a point
belongs in the same category as the point nearest to it. A variation of the nearest neighbor rule classifies a point
as belonging in the category of the majority of a certain number of nearest neighbors. The Credit card fraud
dataset has been obtained from the real time database.
Impact Factor: 5.515
Table 1 for Euclidean distance between locations
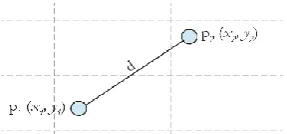
Figure1 for latitude and longitude distance
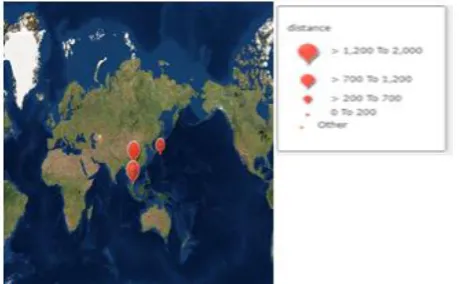
IP Location test with K=3 and K=7 If K=3 calculate the distance with training samples can compute Square
distance. It can check whether distance is short or long. Short distance contains certain limits in the distance
takes below 500 miles shows the genuine transaction otherwise more than 500 miles for fraud transaction
shown in Figure 2.
The Standarized Euclidean Distance between two j- Dimensional vectors can be written as
Latitude
Longitude
X1
Y1
X2
Y2
X3
Y3
X4
Y4
Impact Factor: 5.515
Sort the distance and determine Nearest Neighbors based on the Kth minimum distance
The mean and standard deviation of the IP Distances are shown in table 2
Mean=724
Standard Deviation=0.5074
Standardized Value=(original value-Mean)/Standard Deviation
Table 2 for mean, median mode and standard deviation of IP Distance
IP Distance have contributions of largest role in the particular example. Euclidean Distance calculated on
standardized data. We can repeat this calculation for all pairs of samples. Standardized Euclidean Distance
between the 98 samples calculate the distance between two locations.
Impact Factor: 5.515
4.
Experiments & Results
Accuracy rate and false positive rate as the performance criteria based on the following metric shown in Table
3 & 4 below. True Positive (TP) is a condition when no fraud and False Positive (FP) is a failure of detect the
fraud.
A.
Cross validation
we first use the 10-fold cross validation technique which only needs training data. In 10-fold cross-validation
the original training data is randomly partitioned in to 10 subsamples. In 10 subsamples a single sub sample is
retained as the validation data for testing the model, and the remaining 9 subsamples are used as training data.
In subsamples the validation process is repeated 10 times with the validation data. The 10 results from the
folds then can be averaged to produce a single estimate. The results of the first experiment are given in Table
4. We apply K-Nearest Neighbor algorithm in the fraud detection module in order to find the best method for
detecting credit card fraud based on accuracy false positives and speed (computation time).
B.
Confusion Matrix
The confusion matrix is used as an indication of the properties of a classification rule. It contains correctly or
incorrectly classified for each class. we can see on its main diagonal the number of observations that have
been correctly classified for each class, the off diagonal elements indicate the number of observations that have
been incorrectly classified shown in table 3.
Table 3 for Confusion Matrix
Predicted (a)
Fraud
Predicted (b)
Non Fraud
26.53%
1.02%
0%
72.45%
C.
Precision&Reca1l
A measure of a classifiers exactness and A measure of a classifiers completeness Shown in fig 3.
Kappa: Classification accuracy normalized by the imbalance of the classes in the data.
Impact Factor: 5.515
Fig 3 Precision&Reca1l accuracy result
Table 4 for Accuracy improvement on 10 fold cross validation experiment
Accuracy
Correctly Classified Instances
99
Incorrect Classified Instances
1
Kappa Statistics
0.9741
Mean Absolute Error
0.0100
Root Mean Squared Error
0.0711
Relative Absolute Error
2.7241
Root Absolute Squared Error
15.9076
Each input classifier computes predicted classifications using cross validation from which overall
performance characteristic can be computed. The experiment results are given in the Table 4.
Impact Factor: 5.515
5.
Conclusion
The result of the nearest neighbors shown in Table 4 is 99% genuine and 1% of fraud. The distance of the test
data K=3 and K=7 gives higher performance accuracy show in figure 3. It can achieve good results with the
highest accuracy being 99%. K-Nearest Neighbor algorithm as a weak classifier achieves the highest accuracy
which is 99.% with a false positive (FP) achieves the lowest FP rate of 0%. Unfortunately the computation
time of K-Nearest Neighbor algorithm is very high. This work examined the performance of data mining
techniques of K-Nearest Neighbor algorithm credit card fraud detection to test data with lower fraud rate
shows 99% correctly classified instances and incorrectly classified instances 1%.
References
[1] Lijun Cao, Xiyin Liu, Tiejun Zhou , Zhongping Zhang Aiyong Liu; Based on the flow of anti-k nearest neighbors algorithm for data mining outliers; In Proceedings of IC-BNMT2010
[2] Yufeng Kou, Chang-Tien Lu, Sirirat Sinvongwattana , Yo-Ping Huang; Survey of Fraud Detection Techniques; in Proceedings of the 2004 IEEE International Conference on Networking, Sensing & Control Taipei, Taiwan, March 21-23, 2004
[3] Y. Dora Cai, David Clutter, Greg Pape, Jiawei Han. MAIDS; Mining alarming incidents from data streams; In SIGMOD, Paris, 2004:919-920
[4] Charu C. Aggarwal, Philip S. Yu; An effective and efficient algorithm for high-dimensional outlier detection; In The VLDB Journal (2005) 14: 211–221 [
[5] Aleksandar Lazarevic, Vipin Kumar; Feature Bagging for Outlier Detection; In Proceedings of KDD’05, August 21–24, 2005, Chi cago, Illinois, USA
[6] Jiaheng Lu,Ying Lu, Gao Cong; Reverse Spatial and Textual k Nearest Neighbor Search; in proceedings of SIGMOD’11,June 12–16, 2011, Athens, Greece.
[7] Wen Jin, Anthony K. H. Tung, Jiawei Han and We Wang; Ranking Outliers Using Symmetric Neighborhood Relationship; PAKDD 2006 LNAI 3918 pg 577-593,2006.
[8] Yufeng Kou, Chang-Tien Lu, Sirirat Sinvongwattana Yo-Ping Huang; Survey of Fraud Detection Techniques; Proceedings of the 2004 IEEE International Conference on Networking, Sensing & Control Taipei, Taiwan, March 21-23, 2004
[9] Philip k.chan, WeiFan,Andreas Prodromidis,andSalvatore J.Stolfo; Distributed Data Mining in Credit Card Fraud Detection; Submitted to IEEE Intelligent Systems Special Issue onDataMining,1999.
[10] Pokrajac D, Lazarevic A ; Incremental local outlier detection for data streams; IEEE CIDM,2007:S04-S1S
[11] Z. Ning, A.J. Cox, J.C. Mullikin, "SSAHA: A Fast Search Method for Large DNA Databases," Genome Research, Vol. 11, No. 10, pp.1725- 1729, 2001.
[12] Lam, Bacchus, "Learning bayesian belief networks: An approach based on the MDL principle," Computational Intelligence, Vol. 10, Issue No. 3, pp.269-293, August 1994.
[13] Manoel Fernando Alonso Gadi, Xidi Wang, Alair Pereira do Lago, "Credit Card Fraud Detection with Artificial Immune System," Lecture Notes in Computer Science, Vol. 5132/2008, pp.119-131, 2008.
[14] Tom Madden, "The BLAST Sequence Analysis Tool", 2003.
[15] Dipti D. Patil, V.M. Wadhai, J.A. Gokhale ―Evaluation of Decision Tree Pruning Algorithms for Complexity and Classification Accuracy‖. International Journal of Computer Applications, (2010). Volume 11– No.2; (23- 30). [16] E.W.T. Ngai, Yong Hu, Y.H. Wong, Yijun Chen, Xin Sun ―The application of data mining techniques in financial
fraud detection: A classification framework and an academic review of literature‖. Elsevier-Decision Support Systems(2011). 50; (559–569).
[17] Ekrem Duman, M. Hamdi Ozcelik ―Detecting credit card fraud by genetic algorithm and scatter search‖. Elsevier, Expert Systems with Applications, (2011). 38; (13057– 13063).
[18] Eugene Charniak ―Bayesians networks without tears‖. AI Magazine. (1991). [19] Forrest, S., Perelson, A.S., Llen, L. & Cherukuri, R. ―Self-nonself discrimination in a computer‖. Proceedings of the IEEE Computer Society Symposium on Research in Security and Privacy; (1994). (202–212).