International Journal of Sciences
Research Article
(ISSN 2305-3925)
Volume 2, Issue August 2013
http://www.ijSciences.com
Applications of the New Remote Sensing
Method to the Forest Biomass Estimation in
an Old – Growth Chamaecyparis Obtusa
Stand, in the Akazawa Forest Reserve
Nan Wang
1
, Masato Katoh
1
, Shinichi Yamamoto
2
, Naoyuki
Nishimura
3
, Daisuke Hoshino
4
1Forest Measurement and Planning Laboratory, Forest Science Department, Agriculture Faculty, Shinshu University,
8304, Minamiminowa-Vill., Kamiina-Dtrct., Nagano Pref. 399-4598, Japan.
2Okayama University, Tsushima-Naka, Kita-ku, 1-1-1, Okayama 464-8601, Japan 3Gunma University, maebashi 371-8150, Japan
4Japan international Research Center for Agricultural Sciences, Headquarters1-1, Ohwashi, Tsukuba, Ibaraki
305-8686, Japan
Abstract:For accurate measurement of forest biomass in the Akazawa Forest Reserve, this study analyzed texture measures derived from GeoEye-1 satellite data using the individual tree crown (ITC) method. On this basis, canopy area, tree tops and tree species of individual trees were delineated. Canopy area was used to calculate the DBH of trees in canopy layer based on canopy-DBH curve in this stand. In this study, the estimation models, between DBH and height, and between canopy area and DBH were developed by linear regression using forest survey data. Then according to the results of satellite data interpreted the biomass of every tree was calculated by biomass expansion factor (BEF). This method was verified against the survey data from old–growth Chamaecyparis obtusa stand composed of various cover types. For Chamaecyparis obtusa, the accuracy of biomass estimation was higher than 84%. However, the accuracy of Chamaecyparis pisifera was less than 60%, because some Chamaecyparis pisifera
trees were misidentified as Chamaecyparis obtusa, and canopy area of Chamaecyparis pisifera was underestimated in the high-density stand. For Thujopsis dolabrata,the accuracy ranged from 22.4 % to 78.9%, and from 63.4% to 84.6% for broad-leaved trees, because many of them were understory. These results indicated that estimation of old-growth forest biomass based on high resolution satellite data, might be validated for estimating biomass at the individual tree level improved by developing and applying forest stratum–specific models with the ITC-survey data as a bridging reference in addition to spectral information. This approach is useful for biomass estimation whether is used to calculate biomass of individual tree or forest.
Keywords: Biomass estimation; Individual Tree Crown (ITC) method; High resolution satellite data; Old-growth forest;
Introduction
Forest is the largest ecosystem on Earth's land and plays a important role in retaining ecological balance. Forest biomass is the most direct expression of forest ecosystem structure and function, and it is the comprehensive reflection of the environmental quality, from tree health, forest regeneration and biological balance to energy conversion. The biomass-associated studies are helpful for reflecting the situation of tree growth, the decrease of local carbon dioxide, the expansion of plant diseases, and
developed long before from ground-based destructive weighting (Houghton, 2005), biomass expanding coefficient method (Katoh et al., 2007), airborne sensor system (Bortolot, 2005), optical remote sensing (RS) (Hese et al., 2005) to synthetic aperture radar (SAR) (Jalal and Josaphat, 2011), which are involved with different contexts, e.g., spatial resolutions or earth surfaces.
However, the measurement of forest aboveground biomass involves extensive field surveys. The destructive weighting method is conducted by removing the leave and branches from trees step by step, and then weighting the cut-off materials successively. This direct measurement means is accurate, but it can obtain only single tree in general, and it is not suitable for research on the spatial distribution of biomass and changes. Moreover, destructive weighting biomass is forbidden in most environments. Biomass expanding coefficient method is small error, but laborious and expensive. Wide range of forest biomass estimation is complicated, and it is also one of the challenges in forest research. Satellite data make it possible to monitor and map tropical forest deforestation and degradation and thus also allow tracing changes in forest biomass. Furthermore, the spectral information of remote sensing images has integrated and realistic characteristics. Estimation of forest biomass by satellite data is an effective way on large regional scales, and it has become an important means of using remote sensing information to estimate forest biomass in global change research area. The correspondences between biomass and pixel values have been tested with convincing results, and the utilized parameters such as reflectance, greenness, canopy density, brightness temperature, and their combinations. Satellite images are applicable for estimating biomass at large region-wise scales, while the before measurement method cannot be accurate to individual tree level. The radar-based methods are less weather-dependent and capable of producing data from large areas with high temporal resolutions (Curtis and Wing, 2011), but for individual tree level the related accuracies generally are not satisfactory. Although the airborne sensor system can provide satisfactory accuracy, it cannot be used for observation on large regional scales. And it is laborious and expensive.
On the other hand, there are numerous approaches to estimate aboveground dry biomass from satellite data. Regression analysis is the most common modeling approach, using most studies relating vegetation indices based on red and near-infrared
(NIR) wavelengths with their field measurements. However, apart from the enhanced vegetation index (EVI), which was proved to be sensitive to canopy variations, and have achieved moderate success in old-growth forest, where biomass levels are high and forest canopy is closed with multiple layers. The method can capable of producing data at large areas, but it is just a rough estimate, for individual tree level the related accuracies generally are not satisfactory.
Therefore, this study focuses on the concrete methods for acquiring biomass. For accurate measurement of forest biomass in the Akazawa Forest Reserve, this study analyzed texture measures derived from GeoEye-1 satellite data using the new remote sensing method. The goal is to develop improved biomass estimation models whether analysis objects is individual tree or large areas of forest, and evaluating both spectral and textural information.
Materials and Methods Study area and vegetation
The study area is situated in the Akasawa Forest Reserve with an area of about 1046 ha, Kiso town of Nagano Prefecture, central Japan (35°43'57"N, 137°37'50"E) (Figure 1), which was the birthplace of forest bathing and known as one of three most beautiful forests in Japan (NRFO, 1985). The altitude ranges from 1080 to 1558 m above sea level. Annual precipitation is about 2500 mm, and snow accumulation is 50~100 cm per year. The reserve is on an elevated peneplain with a gentle slope. The geology is dominated by acidic igneous rocks such as granitite, granitite porphyry, and rhyolite. Soils are mainly dry and wet podzolic soils, although brown forest soils appear on hillsides and along mountain streams (NRFO, 1985).
(Figure 1)
Chamaecyparis obtusa generally dominates the canopy layer within the reserve, with occasional associates of Thujopsis dolabrata and some hardwoods, while on lower slopes or along mountain streams, Chamaecyparis pisifera frequently occurs and dominates in some stands. Old-growth
Chamaecyparis obtusa stands on this reserve, like other Chamaecyparis obtusa forests in the Kiso District, might have been established after the severe cutting during the years 1688-1703 (NRFO, 1985). Since that period most stands have been protected from clear-cutting, although selection cuttings have been made for purposes of forest management.
Satellite Data
27 October 2011 during clear weather conditions. The sensor provides panchromatic image at a geometric resolution of 0.41 m and 1.65m multi-spectral image in 15.2 km swaths. The multi-spectral ranges of the four bands are 0.45–0.51 μm (band 1, coastal blue), 0.51–0.58 μm (band 2, green), 0.655– 0.69 μm, (band 3, red), 0.78–0.92 μm (band 4, near-infrared), stored as 16-bit data. The spacecraft is intended for a sun-synchronous orbit at an altitude of 681 km and an inclination of 98 degrees, with equator crossing time. GeoEye-1 can image up to 60 degrees off nadir. The original images with sensor orientation, topographic relief displacement, and systematic errors were rectified by ortho-correction based on X, Y, and Z values for sensor positions derived from a GPS system and the principal points and focal length of the sensor. The geographic projection was converted to WGS84 north Zone 54. The ground resolution of the multi-image was 2 m,
and the ground resolution of panchromatic image was 50 cm after correction. Image processing and analysis were performed using ortho-correction processing in ERDAS IMAGINE 8.6 (ERDAS, 2012) and a tree-based stand map of field data, which was processed in ArcGIS 9.1. Treetop detection and tree-crown delineations were performed using the Individual Tree Crown (ITC)-Suite (Gougeon and Leckie, 2003) in Geomatica 9.1(Geomatica 9, 2005).
Field Data Collection
In 1988, one permanent plot with size of 200 × 200 m was established in an old-growth Chamaecyparis obtusa stand with clear-cutting in 350 years ago and selective-cutting in 60 years ago. Field data were collected from 1988 to 2008 of every five years except 1993. All of trees whose DBH was larger than 5 cm were surveyed, including species, DBH, height, crown size, clear bole height and coordinate in 1988, 1998, 2003 and 2008 (Hoshino et al., 2002; Hoshino et al., 2003; Yamamoto, 1993) (Figure 2). The location of plot was confirmed by a handheld GPS device in 2012. Additional Survey was held in 2012. 15 trees of each species were surveyed in different layers, including DBH, height and crown size. And the data was used for regression analysis. Additionally, trees of DBH≥ 5 cm had been confirmed as live or dead and all of live trees were selected to biomass estimation in this study. The positions of all trees in forest from the field survey were registered in the forest database using ArcGIS 9.1.
(Figure 2)
Biomass estimation based on survey data
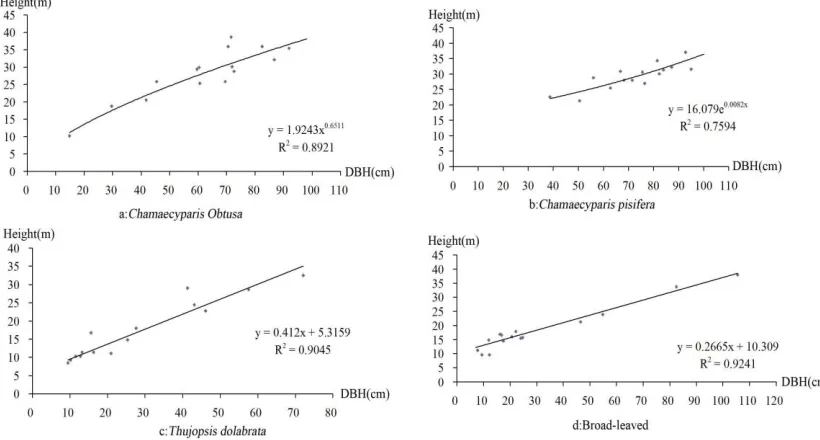
Height-diameter curve explains the relationship of
height and DBH which were measured in the same stand and time. Some sample trees of each diameter class were used to determine height curve based on DBH and height. Change of height-diameter curve is small and stable during tree growth in natural forest (Oosumi, 1987). Tree height can be used to estimate DBH with height-diameter curve. In order to generate regressions for the height-diameter equations, height and DBH of 20 trees were collected respectively distrnguishing species Chamaecyparis obtusa,
Chamaecyparis pisifera, Thujopsis dolabrata and broadleaved trees. The data were used to carry out regression analysis in Excel 2007(Figure 3), and then height-diameter equations were obtained respectively as follows: 6511 . 0 o . C o .
C
1
.
9243
D
H
(1)Hc.o is height of Chamaecyparis obtusa, DC.o is DBH
of Chamaecyparis obtusa, and correlation coefficient R2 is 0.8921.
p . C D 0082 . 0 p .
C
16
.
079
e
H
(2)HC.p is height of Chamaecyparis pisifera,DC.p is DBH
of Chamaecyparis pisifera, e is constant 2.7183, and correlation coefficient R2 is 0.7594.
3159
.
5
D
412
.
0
H
T
T
(3)HT is height of Thujopsis dolabrata, DT is DBH of
Thujopsis dolabrata, and correlation coefficient R2 is
0.9045.
309
.
10
D
2665
.
0
H
B
B
(4)HB is height of broadleaved trees, DB is DBH of
broadleaved trees, and correlation coefficient R2 is
0.9241.
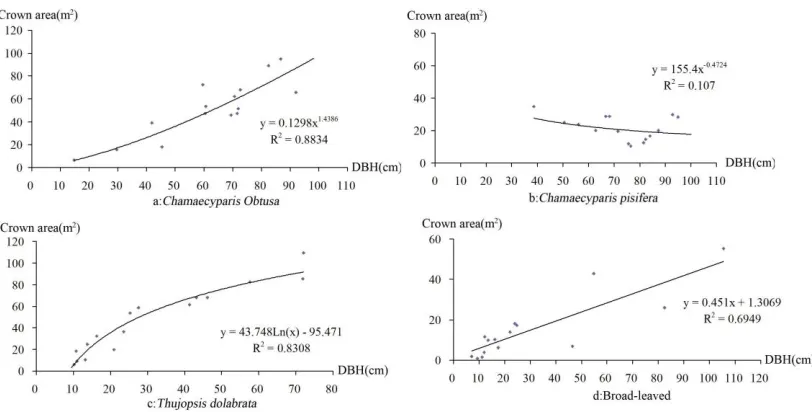
The canopy is the main part for tree photosynthesis. The crown development directly affect the growth of trees, which related significance the most to the DBH. Crown radius was measured from four directions of east, south, west and north. And the average crown radius was calculated by the formula:
4
)
R
R
R
R
(
R
e s w na
(5)Ra is average crown size, Re, Rs, Rw andRn were
crown radius which were measured in four directions. Then crown projection area can calculate by the formula:
2 a
R
S
(6)S is crown projection area, π is constant 3.14, Ra is
average crown radius.
respectively as follows: 4386 . 1 o . C o .
C
0
.
1298
D
S
(7)Sc.o is canopy area of Chamaecyparis obtusa, DC.o is
DBH of Chamaecyparis obtusa, and correlation coefficient R2 is 0.8834.
4724 . 0 p . C p .
C
155
.
4
D
S
(8)SC.p is canopy area of Chamaecyparis pisifera,DC.p is
DBH of Chamaecyparis pisifera, and correlation coefficient R2 is 0.107.
471
.
95
)
D
ln(
748
.
43
S
T
T
(9)ST is canopy area of Thujopsis dolabrata, DT is DBH
of Thujopsis dolabrata, and correlation coefficient R2
is 0.83.08.
3069
.
1
D
451
.
0
S
B
B
(10)SB is canopy area of broadleaved, DB is DBH of
broadleaved, and correlation coefficient R2 is 0.6949.
Through regression analysis, numerical relationships of height-DBH and crown size-DBH curve were obtained, which would be used to calculate tree height and crown projection area of each tree. In addition, volume can be calculated with formulas of stem volume table (Forestry Agency Planning Division, 1970).
According to the estimation data of DBH and height, the biomass of each tree can be calculated with expanding coefficient method:
D
BEF
V
B
(11)B is biomass, V is volume of tree, BEF is biomass expanding coefficient and D is bulk density.
(Figure 3) (Figure 4)
Estimation Error
Estimation error for the four levels: all trees, the trees with DBH ≥35 cm, DBH ≥ 50 cm and DBH ≥ 65 cm distinguishing species, may be calculated by the formula as follows:
100
×
X
÷
M)
-(X
=
φ
(12)where is estimation error, X is the biomass of trees calculated by survey data, and M is estimated biomass.
Satellite data processing
The geographic projection was converted to WGS84 north Zone 54, and study area was extracted from the multi-image and panchromatic-image respectively with GPS data and software ERDAS IMAGINE 8.6. Pixels classification on the extraction image was used to species classification. The training areas with
Chamaecyparis obtusa, Chamaecyparis pisifera,
Thujopsis dolabrata and broadleaved trees were selected from the field survey.
On the other hand, ITC (Individual Tree Crown) method was used for tree tops, tree-crown delineations and species classifictiion of delineated tree-crown. ITC method is a new method of digital remote sensing data analysis with the purpose of extracting individual tree crown based forestry parameters as automatically as possible, such as individual tree species and canopy area, crown and tree top extraction, stem density, crown closure and gap distribution. GeoEye-1panchromatic image was used to delineate forest area and non-forest area based on THR (thresholding Image to bitmap) method. This method creates the boundary of each segment based on the spectral values which was specified range of non-forest area. It was important to separate non-forest regions in the image, such as roads and gap of crown. On this basis, the valley-following method from the NIR band of GeoEye-1 multi-color image was used to delineate tree crown (Gougeon 1995). This method compares the spectral values of each pixel, and then it treats the spectral values of the imagery as topography with shaded and darker areas representing valleys and bright pixels of the tree crowns. It produces a bitmap of segments of valley and crown materials. A rule-based system follows the boundary of each segment of crown material to create isolations, which are taken to represent tree crowns. The ITC image was classified into species using a supervised classification process of multi bands based on comparing crown signatures (Katoh 2009). Tree top detection method was used to detect tree tops of canopy tree and count their numbers automatically. Bitmap of tree tops was created based on the highest spectral values of pixels within delineated crown. It confirmed the number of canopy trees. Canopy area can be used to calculate the DBH using the result of image analysis and crown size-DBH regression equation. Then, projection results of DBH can be used to calculate the height based on height-diameter equations. Finally, the volume and biomass can be calculated based on volume formula and expanding coefficient method respectively.
Results and Discussion
Basic characteristics of the forest
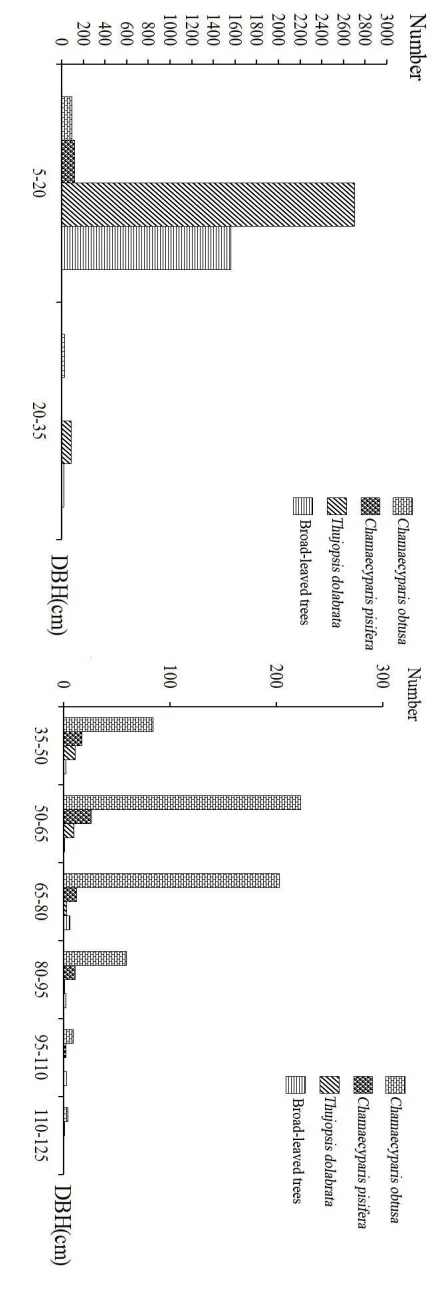
Total numbers of live trees of the stand in study area was 4811 stems in 2008. Chamaecyparis obtusa was 702, accounted for about 14.6%. Chamaecyparis pisifera was 179, accounted for about 3.7%.
where Chamaecyparis obtusa did not distributed, such as Chamaecyparis pisifera, Thujopsis dolabrata
and broad-leaved trees. On the other hand, Thujopsis dolabrata was absolutely dominant in middle layer and understory (Figure 5). And they were distributed in the under layer of forest together with broad-leaved trees. Additionally, in order to promote the recruitment of Chamaecyparis obtusa, most individuals of Thujopsis dolabrata and broad-leaved tree with large size were cut by clear-cutting in 350 years ago and by selective-cutting in 60 years ago. (Figure 5)
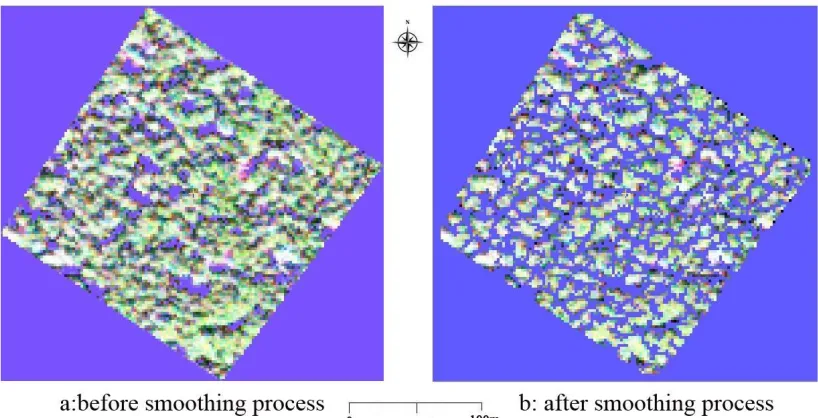
Tree tops and crown extraction
Panchromatic image was necessary to do smoothing based on their own ranges in the illumination image before crown extraction, which was done twice to smooth using an averaging filter of 3× 3 pixels (1.5 by 1.5 m). And the non-forest mask was established after the smoothing process. Typically, it smoothed the small tree areas with a 3x3 average filter, and the big tree areas with a 5x5 filter on top of the 7x7 smoothing. However smoothing process was done by 3x3 average filters, although it is 350 years old-growth forest. Because tree crown old-growth was affected by high canopy density in this old-growth forest, and the diameter of the tree crowns ranged from 3 to 5 m, a filter size of 3 × 3 pixels was more suitable than 5×5 or 7× 7 pixels. The process was used to mask non-forest areas of the image, such as road and gap between crowns. The ITC isolation image was formalized the outlines of tree crowns and tree clusters partially delineated using valley-following approach producing an output bitmap representing lines and areas of shaded material between tree crowns depending on the non-forest mask. This is done by the valleys of shaded material (dark) between brighter tree crowns. Processing on details can be conducted aiming at some special areas, and the unnecessary or erroneous points can be revised or deleted (Figure 6). Some errors were generated from the automatic extraction in the tree crown delineation image, such as tree crown cross and split. The crown delineation processes may have difficulties with these trees which crowns were split up or merged. But this has little influence on this study, as the total number of trees is concerned for biomass estimation. Furthermore, tree tops extraction was used to detect number of these delineated crowns in medium to densely populated areas where some crowns had not been extracted yet apparently visible trees. This program moves a window of a given size on ITC isolation image and detects the local “centered” grey-level maximum of each window's instance. Delineated crowns in the images corresponded well to dominant trees in the
high-density field. In this study, 282 of tree crowns and 352 of tree tops were extracted (Figure 7). The number of crowns from the image analysis was fewer than the stems from the field survey, primarily because some trees in the image were misidentified as one large tree crown rather than a cluster of trees. (Figure 6) (Figure 7)
Tree species classification and identification
Two methods were used to classify tree species as
Chamaecyparis obtusa, Chamaecyparis pisifera,
Thujopsis dolabrata and broadleaved trees. Firstly, pixel based classification of the extraction image from multi-spectral images was fed into a supervised classification process, with training some areas of
Chamaecyparis obtusa, Chamaecyparis pisifera,
Thujopsis dolabrata, broadleaved trees and gaps based on the field survey (Figure 8). According to the results of the pixel based classification, the accuracy of Chamaecyparis obtusa was higher than other species, and the Chamaecyparis pisifera had a lowest accuracy (Table 1). Because Chamaecyparis obtusa
dominated in this field. On the other hand,
Chamaecyparis obtusa and Chamaecyparis pisifera
belong to the same cupressaceae, and they have similar spectrum characteristics and are difficult to be distinguished in the multi-spectral images. Therefore, some pixels of Chamaecyparis pisifera might be misclassified into Chamaecyparis obtusa mutually in the classification process. Additionally, some
Thujopsis dolabrata were misclassified into gaps, because small Thujopsis dolabrata distributed in these gaps.
Secondly, the ITC isolation image and multi-spectral images were fed into a supervised classification process with training areas as the same classes as above (Figure 9). Results of indicated that
Chamaecyparis obtusa had highest accuracy of classification, while that of broad-leaved trees was lowest (Table 2). Because crown size of broad-leaved trees is small in the high-density forest.
(Figure 8) (Figure 9) (Table 1) (Table 2)
Crown of species identification
maxima filtering within the smoothed image, crowns identified using the ITC delineation and both treetops and crowns identified using pixel classification and crown classification. The number of crown was 282, tree tops was 352. These results showed that the number of trees by species determined by the new tree top method were less accurate than the total number of trees using the new method. This may be due to the underestimation of Chamaecyparis Obtusa,
Chamaecyparis.Pisifera and Thujopsis dolabrata. Thus, the method can be used effectively to extract the number of stems of upper and intermediate canopy trees in pure conifer plantations when multiple layers or high densities are not involved.
Estimation accuracy
In order to examine the accuracy of estimated biomass using the new method, the biomass of estimation had been compared with field survey at four levels, including all trees, the trees with DBH ≥35 cm, DBH ≥ 50 cm and DBH ≥ 65 cm distinguishing species (Table 3). The errors for all trees, DBH ≥ 35 cm, DBH ≥ 50 cm and DBH ≥ 65 cm of Chamaecyparis Obtusa were 16.1%, 11.94%, 12.36%, and -12.63% respectively. For
Chamaecyparis pisifera, they ranged from-7.69% to 41.67%. The error for biomass estimation of
Thujopsis dolabrata ranged from -370.58% to 78.67%, and these of broad-leaved trees ranged from -36.36% to 34.78%. The results indicated that biomass estimation of Chamaecyparis pisifera was inferior to Chamaecyparis Obtusa owing to their large crowns and same spectrum characteristics resulted in one crown being sometimes misidentified as a cluster of crowns. Furthermore, Chamaecyparis pisifera and broad-leaved treesweredisadvantage of competition with Chamaecyparis Obtusa, which makes canopy area of Chamaecyparis pisifera
smaller. Therefore, a large error of estimated DBH were produced using DBH-crown curve. The biomass estimation error for total of Thujopsis dolabrata was
relatively large, because Thujopsis dolabrata was absent in the large classes, while occurred in the small classes. And multilayered stands have some intermediate or understory trees that are difficult to be extracted using image analysis.
(Table 3)
Conclusion
In this study, a new remote sensing method was used to explore the potential of GeoEye-1 data for biomass estimation of old-growth forest. The new method might be workable for the biomass estimation whether research object is individual tree or forest in canopy layer. Three kinds of errors were generated
from biomass estimation. Firstly, tree height is necessary to calculate volume and biomass. Height-diameter curve was used to estimate each tree height based on survey, and error was generated in this estimation process. LIDAR (Light Detection and Ranging, Laser Imaging Detection and Ranging) data may resolve shortcomings in tree height estimation, which had been demonstrated potentially in measuring forest biomass. Secondly, the error was emerged in step of crown extraction. These errors because of the crown cross and split up, it was caused in canopy area calculation. In order to reduce the error, separation processing or connection was done manually by delineating crowns on the screen using the image editor of the Geomatica software. For the crown which can not be divided, canopy area was calculated as one crown. But this has little influence on this study, as the total number is concerned for biomass estimation. Because the DBH will change with the canopy area. Additionally, the crown of some trees couldn't be extracted in middle layer or under layer such as Thujopsis dolabrata. Because multilayered stands have some intermediate or understory trees that are difficult to extract using image analysis. Thirdly, the pixel based classification and object based classification produced errors in species classification and tree crown identification. Because Chamaecyparis obtusa and Chamaecyparis
pisifera have similar spectrum characteristics, which led to one crown was sometimes misidentified as a cluster of crowns.
The precision of biomass estimation for some species is not satisfied, and the main reasons are the poor precision of some species in satellite image and canopy area estimation. New instruments of higher resolutions in spatial, temporal and spectrum are devised for determining reliable forest aboveground biomass. With the development and improvement of the theories and models for biomass estimation by using of remote sensing data, great progress will be taken in the research of forest biomass on large scales.
Ackonwledgements
Firstly we gratefully acknowledge some students of Nagoya University and all the staffs of Forest Measurement and Planning Laboratory for their support in the field and plot survey. We would like to thank Mr. S.Q. Deng and S.K. Wang for their advices on the research. We also thank Mr. M.ABDULLAH AL FARUQ for his revision on the paper. Finally we acknowledge helpful comments of anonymous reviewers and editor.
Literature Cited
[1] Bortolot, Z.J.; Wynne, R.H., 2005. Estimating forest biomass using small footprint lidar data: An individual tree-based approach that incorporates training data. ISPRS J. Photogramm. 2005, 59, 342-360.
[2] Curtis Edson and Michael G. Wing., 2011. Airborne Light Detection and Ranging (LiDAR) for Individual Tree Stem Location, Height, and Biomass Measurements. Remote Sens. 2011, 3, 2494-2528pp.
[3] ERDAS, 2012. ERDAS Imagine 8.6 On-Line Help Manual;
Available online:
http://www.erdas.com/service/support/ERDASSupport.aspx (accessed on 6 March 2012).
[4] Forestry Agency Planning Division., 1970. Stem volume table of east Japan.261-283pp, Japan forestry investigation committee, Tokyo
[5] Geomatica 9. EASI User Guide; PCI Geomatics Enter., 2005. Inc.: Richmond, ON, Canada,
[6] Gougeon, F.A., 1995. A crown following approach to the automatic delineation of individual tree crowns in high spatial resolution aerial images. Can. J. Remote Sens. 1995, 21, 274–284. [7] Gougeon, F.A.; Leckie, D.G., 2003. Forest Information Extraction from High Spatial Resolution Images Using an Individual Tree Crown Approach; Information Report BC-X-396; Canadian Forest Service, Pacific Forestry Centre, Victoria, BC, Canada, 2003.
[8] Hese, S.; Lucht, W.; Schmullius, C.; Barnsley, M.; Dubayah, R.; Knorr, D.; Neumann, K.; Riedel, T.; Schröter, K., 2005. Global biomass mapping for an improved understanding of the CO2 balance—The Earth observation mission carbon-3D. Remote Sens. Environ. 2005, 94, 94-104.
[9] Hoshino D, Nishimura N and Yamamoto S., 2002. Dynamics of major conifer and deciduous broad-leaved tree species in an old-growth Chamaecyparis obtusa forest, central Japan Forest Ecology and Management. 159:133-144.
[10] Hoshino D, Nishimura N and Yamamoto S., 2003. Effects of canopy conditions on the regeneration of major tree species in an old-growth Chamaecyparis in central Japan Forest Ecology and Management. 175:141-152.
[11] Houghton, R.A., 2005. Aboveground forest biomass and the global carbon balance. Glob. Chang. Biol 11, 945-958.
[12] Jalal Amini and Josaphat Tetuko Sri Sumantyo., 2011. SAR and Optical Images for Forest Biomass Estimation.5-15pp. Earth and Planetary Sciences
[13] Masato Katoh., 2007. Forest remote sensing- From fundamentals to applications Revision, In: Nobuyuki Abe (Eds), Forest environment, 12th ed. Japan forestry investigation committee, Tokyo, pp.180.
[14] Masato Katoh, Gougeon, F.A. and Leckie, D.G., 2009. Application of high-resolution airborne data using individual tree crowns in Japanese conifer plantations. Journal of Forestry Research 14(1): 10-19
[15] NRFO (Nagano Regional Forest Office)., 1985. Report on the management of the Akasawa Chamaecyparis obtusa forest (enlarged). 102 pp, Nagano Regional Forest Office, Nagano, in Japan.
[16] Oosumi, S., 1987. Forest Metrology Lecture. 287pp, Yokendo, Tokyo
[17] UNFCCC., 2010. Outcome of the Work of the Ad Hoc Working Group on Long-Term Cooperative Action under the Convention—Policy Approaches and Positive Incentives on Issues Relating to Reducing Emissions from Deforestation and Forest Degradation in
Figure1 The location of Akazawa Forest Reserve
Figure 2 Tree stand map with stratum from field-survey data
F
igur
e 5
S
tand
Ove
Figure 6 Distinction of forest and non-forest
Figure 7 Crown and tree tops extraction
F
igur
e 5
S
tand
Ove
Figure 8 Tree species classification with pixel
Table 1 Accuracy of tree species classification by pixel
Class name
Class
NO. 1 2 3 4 5
Producter,s accuracy(%)
Chamaecyparis
obtusa 1 64 1 1 1 0 95.5
Chamaecyparis
pisifera 2 16 15 0 2 0 45.5
Thujopsis
dolabrata 3 4 0 34 0 3 82.9 Broad-leaved
trees 4 1 1 0 9 0 81.8
Gap 5 1 0 2 0 24 88.9
User,s
accuracy(%) 74.4 88.2 91.9 75.0 88.9
Table 2 Accuracy of classification of tree crown by species
Class name Class
NO. 1 2 3 4 5
Producer's Accuracy (%)
Chamaecyparis
obtusa 2 12 86 0 2 0 86.8
Chamaecyparis
pisifera 1 32 6 0 0 0 84.2
Thujopsis
dolabrata 3 0 2 56 0 4 90.3
Broad-leaved
trees 4 0 0 2 20 0 91
Gap 5 0 0 6 0 36 85.7
User's
accuracy(%) 72.7 91.5 87.5 91 90
Table3 Accuracy of biomass estimation
Species
Field survey data (t/ha)
Estimation data(t/ha)
Error (%)
All trees
DBH above 35cm
DBH above 50cm
DBH above 65cm
All trees
DBH above 35cm
DBH above 50cm
DBH above 65cm
Chamaecyparis
Obtusa 10.31 10.22 9.87 7.68 8.65 16.10 11.94 12.36 -12.63
Chamaecyparis
Pisifera 0.24 0.22 0.2 0.13 0.14 41.67 36.36 30.00 -7.69
Thujopsis
dolabrata 0.75 0.132 0.085 0.034 0.16 78.67 -21.21 -88.24 -370.59 Broad-leaved