METHODOLOGY
A method for real-time classification
of insect vectors of mosaic and brown
streak disease in cassava plants for future
implementation within a low-cost, handheld,
in-field multispectral imaging sensor
Joseph Fennell
2, Charles Veys
1, Jose Dingle
1, Joachim Nwezeobi
3, Sharon van Brunschot
3, John Colvin
3and Bruce Grieve
1*Abstract
Background: The paper introduces a multispectral imaging system and data-processing approach for the iden-tification and discrimination of morphologically indistinguishable cryptic species of the destructive crop pest, the whitefly Bemisia tabaci. This investigation and the corresponding system design, was undertaken in two phases under controlled laboratory conditions. The first exploited a prototype benchtop variant of the proposed sensor system to analyse four cryptic species of whitefly reared under similar conditions. The second phase, of the methodology devel-opment, employed a commercial high-precision laboratory hyperspectral imager to recover reference data from five cryptic species of whitefly, immobilized through flash freezing, and taken from across four feeding environments. Results: The initial results, for the single feeding environment, showed that a correct species classification could be achieved in 85–95% of cases, utilising linear Partial Least Squares approaches. The robustness of the classification approach was then extended both in terms of the automated spatial extraction of the most pertinent insect body parts, to assist with the spectral classification model, as well as the incorporation of a non-linear Support Vector Classi-fier to maintain the overall classification accuracy at 88–98%, irrespective of the feeding and crop environment. Conclusion: This study demonstrates that through an integration of both the spatial data, associated with the multispectral images being used to separate different regions of the insect, and subsequent spectral analysis of those sub-regions, that B. tabaci viral vectors can be differentiated from other cryptic species, that appear morphologically indistinguishable to a human observer, with an accuracy of up to 98%. The implications for the engineering design for an in-field, handheld, sensor system is discussed with respect to the learning gained from this initial stage of the methodology development.
Keywords: Multispectral imaging, Real-time, Virus, Disease, Insect, Whitefly, Cassava, Bemisia tabaci, Begomoviruses
© The Author(s) 2018. This article is distributed under the terms of the Creative Commons Attribution 4.0 International License (http://creat iveco mmons .org/licen ses/by/4.0/), which permits unrestricted use, distribution, and reproduction in any medium, provided you give appropriate credit to the original author(s) and the source, provide a link to the Creative Commons license, and indicate if changes were made. The Creative Commons Public Domain Dedication waiver (http://creat iveco mmons .org/ publi cdoma in/zero/1.0/) applies to the data made available in this article, unless otherwise stated.
Open Access
Background
The paper reports the design of a novel instrumental technique based on active close-proximity multispec-tral imaging (MSI), to deliver real-time non-destructive identification of insect viral vectors. The engineering approach utilised has been designed to be translated into a rapid, portable, non-destructive and low-cost unit for use by semi-skilled field workers, notably in Sub-Saha-ran African countries. The focus of the investigation has been to address autonomously identifying the species and number of whitefly (Bemisia tabaci) insects on a leaf surface, or similar environment, in order to identify and quantify the vectors of the damaging plant viruses that cause epidemics of cassava mosaic disease (CMD) and cassava brown streak disease (CBSD) in Sub-Saha-ran African cassava (Manihot esculenta). However, the underlying technical approach may be extended by future studies to insect viral vectors of a broad range of crop, livestock and human diseases. This technology will also have applications in whitefly research generally and will, for instance, make the rearing of colonies of pure spe-cies for experimentation much less labour-intensive and expensive. As such, it is a technology that is highly appro-priate for adoption in Development Assistance Commit-tee (DAC) listed countries.
The work to-date, has been undertaken within two phases. These provide evidence as to the suitability of the technique to autonomously segment the insect vec-tor information from within MSI datasets, with respect to their host plants. This is achieved through the modu-lation of narrowband semiconductor light sources, i.e. light emitting diodes (LEDs). It should be noted that throughout this paper the latter approach is referred to as multispectral, which indicates a reduced number of dis-crete wavebands, as opposed to hyperspectral, that com-monly implies hundreds of measurements bands [1]. This is deliberate as the methodology has been developed to minimise the number of wavelengths required and, as a consequence, the ultimate system cost and complexity. Phase-1 of the study illustrated how, through coupling with a suitably modified broadband imaging detector the latter may then enable high signal-to-noise image data to be recovered such that the insect species can be clas-sified from the picture elements (pixels). Phase-2 of the investigation then extends the concepts, by collecting a higher spatial and spectral resolution reference data-set from a broader range of insects, than in the earlier phase, and immobilising those under controlled con-ditions to ensure image integrity. The Phase-2 dataset includes both a wider range of vector species, as well as variations in the feeding environments of the insects. The latter is a particularly significant element of the analy-sis, as it points towards the utility of the tool to provide
meaningful sensor data under the variations found within real-world field environments.
This research has built upon prior learning gained from insect classification using single-point vibrational spectroscopy of insect species, typically in the near to mid-infrared regions of the electromagnetic spectra. The originality of the reported work is in:
• The extension of such concepts into the visible to near-infrared bands, i.e. ~ 400–1100 nm wavelengths,
combined with
• The utilisation of the spectral information from each pixel within a multispectral ‘datacube’ to segment the dataset into the most significant elements upon which to base the classification.
The above methodology requires the sensor system to recover the spectral information, per image pixel, at an appropriately high signal-to-noise ratio (SNR). By virtue of the availability of mass-produced, high-frame rate, sensitive silicon imaging detectors, as a consequence of the digital camera sector, such a system may now be engi-neered at a relatively low-cost within a handheld package. This paper presents the laboratory evidence to sup-port the viability of such a system design and discusses the ongoing work to realise a practical in-field engineered unit. The study to-date has been undertaken on adult whiteflies, and excludes the identification and discrimi-nation of other life stages, i.e. crawlers, nymphs and eggs. The extension to include the latter is theoretically achiev-able and the approach is particularly aligned to delivering that due to its ability to extract the insect tissue elements from within the background host leaf structure.
Importance of B. tabaci to cassava and global development Cassava is a uniquely important food-security crop for one-third of the world’s low-income, food deficit coun-tries and is the world’s third largest source of calories in the human diet [2]. After 15 years of global increases, however, cassava production is predicted to fall due to droughts and diseases. CMD and CBSVD in particular, destroy an estimated 35 million tonnes of African cas-sava annually [2]. B. tabaci, and the greater than 200 plant-viruses it transmits, have an undeniable impact on the world’s food security, directly affecting a broad range of staple crops such as cassava, common bean and sweet potato. In Africa, over 200 million people obtain close to 50% of their daily food intake from cassava [2].
Disease management programmes for B. tabaci
a CMD pandemic caused widespread famine in East Africa. This was driven by unusually high B. tabaci pop-ulations generated, in part, by a virus-vector-host plant interaction that increased B. tabaci fecundity on CMD infected cassava, boosting vector numbers and driving disease spread [3]. The disease was contained through developing and distributing CMV-resistant cassava varieties to farmers and the variety TMS 30572 (Migy-era) was adopted rapidly and more than 11,338 ha were being grown by 1996 [4]. However, in more recent years resistant strains of the virus have resulted in a contin-ued spread of CMD and CBSD across Africa [5] requir-ing further containment and eradication programs to be instigated.
Motivation behind sensor development for in‑field viral vector identification
Bemisia tabaci is not a single species [6], but consists of a group of more than 34 closely-related cryptic species. At present, these can only be identified using molecular markers. Although Africa is the evolutionary origin of B. tabaci, its diversity there remains poorly studied and so the number of species will continue to increase as more are identified. Several African B. tabaci species feed on cassava and the rapid spread of CMD and CBSD has been associated with high whitefly populations of the species now called, SSA1 and SSA2. As well as B. tabaci, other whitefly species such as Bemisia afer also colo-nise cassava [7] and due to their similar size, they can be confused easily with B. tabaci [8]. Current survey and epidemiological research in sub-Saharan Africa focussed on B. tabaci borne viruses relies on destructive sam-pling of the subjects followed by a multi-step molecular sequencing technique, of partial mtCO1 sequences, to identify the whitefly species present. The costs and time taken to undertake the necessary steps for this diagnostic method are often prohibitive, when thousands of indi-vidual whitefly need to be typed accurately. The complex-ity of the analysis also necessitates that it is undertaken within centralised laboratory facilities using compara-tively expensive instrumentation, with the corresponding delays in analytical lead times and the requirements for servicing and support infrastructure.
As a consequence, with existing technology, it is not possible to do detailed landscape ecological research in cassava-based agro-ecosystems, because of the magni-tude of the species identification problem. The delivery of the real-time, portable and non-destructive sensor system, as introduced within this paper, would enable the spread of insect viral vectors to be mapped in a reli-able and timely manner. This may be achieved by exploit-ing the sensor data alongside the accurate positional and time data as derived from a linked smartphone
handset and then using the latter to relay just the relevant extracted information to a central data-base, so minimis-ing bandwidth usage. Furthermore, the approach pro-posed may be undertaken rapidly by semi-skilled field operatives, as it requires no pre-treatment of the leaf or insect samples. Such a tool offers the potential for virolo-gists and plant breeders to deliver a paradigm shift in the eradication of CMD and CBSD, through targeted con-trol measures and introduction of new varieties, with the consequent impact on cassava production in Africa and broader implications for deploying variants of the tech-nology-platform for viral disease control elsewhere.
Prior research for rapid assessment of viral vectors
Previous research has been undertaken to identify the symptoms of CMD and CBSD, on cassava leaves, through visual imaging algorithms that are compatible with the modest processing power within mobile phone handsets [9, 10]. More recently it has been reported that similar approaches have been adapted to count the numbers of B. tabaci on the underside of cassava leaves (Mwebaze, E., Makerere University, Kampala, Uganda; unpub-lished) but, due to the morphological similarity of the species, such techniques have not so far been capable of identifying the separate B. tabaci species from their visual images. An additional problem in getting accurate population counts of African cassava B. tabaci nymphs arises in the field, because they are pale and silvery in colour and so do not stand out against the green leaf background.
low-cost, silicon detectors are limited to a wavelength upper limit of 1125 nm, due to the bandgap of silicon. This compares to a similar wavelength limit for InGaAs of 3540 nm.
Rationale for undertaking the research
As minor pigment variations between the whitefly spe-cies have been observed under laboratory conditions the hypothesis was that detection of species differences could be automated using a miniaturised MSI systems, combined with morphological and spectral processing of the data. The resulting system could then be exploited in the field to identify and count autonomously, in real-time and non-destructively, known viral-vectors from their non-virus-carrying neighbours.
An existing prototype MSI instrument, which was developed primarily for the commercial arable agri-cultural industry was adapted for the whitefly duty. This system utilises active, close proximity, MSI based on proprietary components from the consumer elec-tronics industry. This is based upon narrowband LEDs which are then integrated with modified colour silicon-CMOS imaging detectors, such that their spectral range is extended from the visible (Vis) region (400–700 nm wavelengths) out into the near infrared (NIR), up to the bandgap of silicon (wavelengths up to 1125 nm). Such an approach offers the potential to deliver cellular/wire-less network-connected handheld sensors for in-field use at US$10–100’s as opposed to the non-portable labora-tory near to mid-infrared equipment used in the previous entomological species identification work which cost in excess of US$30,000 (2016) [10–18].
The ability to use whole image rather than gross single-point spectral measurements also opens up the possibil-ity of greater discrimination accuracy, without the need for skilled preparation of the insect samples. The latter is by virtue of being able to use combined image and spec-tral feature extraction to automatically extract the insect features from the background, correct for insect orienta-tion and then use parts of the structure of the insect, as opposed to the whole body, to provide specific species identifier markers.
This technology has to-date been developed with industrial partners, for duties ranging from protein assessment, weed control and early detection of fungal diseases [19]. Through a ratio analysis of images taken under far-red and infrared illumination [20] non-vegeta-tive material, within the images, may be simply extracted from the data allowing more detailed spectral analysis to be undertaken on the remainder.
This paper is differentiated from the prior-art as it exploits both the spatial and spectral data from actively illuminated viral vectors to generate significantly greater
differentiation of the insects, and their eggs, from the background leaf structure. It further enhances the in-field capabilities from such a unit by generating spec-trally-enhanced images, using linear multivariate analysis techniques, which have been demonstrated to be capa-ble of distinguishing species of whitefly, and potentially other insects, that are known viral vectors (carriers) of CMD and CBSD, versus their benign counterparts. This is based on low-cost, miniaturised and low-power com-mercial electronic components operating across the Vis to NIR wavelengths of light.
Methods Phase‑1 trial
The first phase of study utilised a prototype 63 wave-band, 380–940 nm wavelength, prototype bench-top MSI unit so as to image the relatively small whitefly features (c.1–2 mm in length) versus the larger supporting leaf structure [21]. This system also enabled the much smaller nymphs (c.500 µm) and eggs (c.100 µm) to be imaged. The latter are extremely challenging to identify by eye within the fibrous texture of cassava leaves even with the aid of a lab microscope.
The LEDs within the unit were conventional sources providing non-coherent light across wavelength range of 365–940 nm at 5–10 nm Full Width Half Maximum (FWHM) resolution, in a virtually continuous cover-age of the spectra with the exception of the 530–585 nm bands. The latter was due to the lack of availability of suitable LEDs at the time. Subsequently this range, as well as that from 940 to 1050 nm, has been included within the prototype unit, but such systems post-date the trials reported within this paper. LED control and image capture was achieved through a proprietary sin-gle board computer (Raspberry PI Model 2, Raspberry PI Foundation, UK), interfaced to a bespoke driver card. The approach provided a cost-effective and flexible platform, for initial proof-of-concept studies, prior to developing a more optimised portable dedicated unit for rapid in-field measurements. The spectral output and illumina-tion power of each of the LEDs was characterised using a laboratory spectrometer (Ocean Optic USB4000, Ocean Optics Inc., USA) and the intensity balanced, across the wavelength range, using Pulse Width Modulation of the drive signals. A barium sulphate reference tile was used to calibrate the spectral intensity of the light output from each of the LEDs.
SSA2, SSA3 and MED Uganda ASL, see Table 1, the first three being CMD insect vectors and the last is not. After removal the leaves were chilled, so as to partially immobi-lise the insects. This was necessary for these preliminary studies as the prototype MSI instrument was not opti-mised for rapid image capture and so required between 2 and 5 min, per leaf, to accumulate the necessary spectral images and then store them to memory.
The raw multispectral image data were processed using the Optimised Soil Adjusted Vegetative Index approach [20] to mask-out the background supporting leaf structure. This was selected as the inclusion of a scal-ing parameter (r = 0.16) in the denominator reduces the influence of incident light reflected from non-plant sur-faces onto the leaf surface. The MSI data was then further processed to exclude the smaller items (speckles) which were predominantly a consequence of specular reflec-tance errors. The resulting multispectral data were then autoscaled (mean centred and each variable scaled to unit standard deviation) and processed using the super-vised multivariate classification technique, Partial Least Squares Discriminative Analysis (PLS-DA), by using 20 randomly selected samples of each species of whitefly as the training set. This, and the pre-conditioning of the data, was undertaken using custom code written within the MatLab environment (MatLab R2015a, Mathworks, USA).
Phase‑2 trial: B. tabaci species and experimental host plants
Prior to the second phase of trials in May 2017, labora-tory colonies of five different cryptic species of B. tabaci, see Table 1, were reared and maintained separately on a range of experimental plant hosts. These included: (1) cassava (Manihot esculenta cv. MCol22; Euphorbiaceae), (2) eggplant (Solanum melongena cv. Black Beauty; Solanaceae), (3) kale (Brassica oleracea cv Dwarf Green Curled; Brassicaceae), and (4) sweet pepper (Capsicum annuum cv. California Wonder; Solanaceae). The ability
of each cryptic species to reproduce and develop on each host differed (due to known variation in host-plant range). Due to their inability to survive, colonies could not be established for every B. tabaci/experimental host-plant combination. Due to fluctuations in colony size, 1 population of the African cassava mosaic virus (ACMV) vector (SSA1 SG3) and 2 non-vectors of ACMV (MED Q1 and Asia II 1) were present in large enough numbers (> 100 insects) to establish a reliable training and testing set. In total, 7 combinations of insect and diet were pre-sent in large enough numbers for use in the classification process. The species purity of colonies was confirmed by standard molecular methods [22]. In brief, the 3′ partial mitochondrial cytochrome oxidase 1 gene of ≥ 3 individ-uals of each cryptic species of B. tabaci was sequenced (haplotype Gene Bank accessions are provided in Table 1, column GB). The experimental B. tabaci species were reared on eggplant for several generations prior to the experiments, to ensure they were ACMV-free (eggplant is not an ACMV host). Their virus-free condition was confirmed by their inability to infect healthy cassava with ACMV. The B. tabaci colonies were reared under stand-ard conditions of 28 ± 2 °C, 60% humidity and a 14:10 h light:dark cycle, respectively.
Phase‑2 trial: sample preparation
Due to the partial immobilisation of the whitefly on cool-ing durcool-ing Phase-1, combined with the higher heat levels from the halogen source and the longer scan times of the Headwall instrument, an alternate technique was applied during Phase-2. Cohorts of adult whiteflies (mixed gen-der, different ages) were collected from each colony using custom-made aspirators which transfer whiteflies directly into separate 1.5 mL Safe-Lock micro-centrifuge tubes (Eppendorf, Hamburg, Germany). Tubes were imme-diately flash-frozen in liquid nitrogen and maintained under liquid nitrogen until use. Three alternative meth-ods for killing whiteflies for analysis were trialled, includ-ing conventional slow-freezinclud-ing to − 20 °C, exposure to
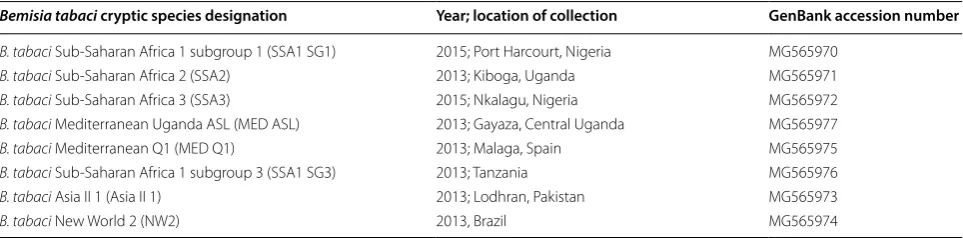
Table 1 Details of laboratory colonies of cryptic B. tabaci species
The table include the suspect viral vectors species designation, its sample date and location and the specific accession number in the GenBank
Bemisia tabaci cryptic species designation Year; location of collection GenBank accession number
B. tabaci Sub-Saharan Africa 1 subgroup 1 (SSA1 SG1) 2015; Port Harcourt, Nigeria MG565970
B. tabaci Sub-Saharan Africa 2 (SSA2) 2013; Kiboga, Uganda MG565971
B. tabaci Sub-Saharan Africa 3 (SSA3) 2015; Nkalagu, Nigeria MG565972
B. tabaci Mediterranean Uganda ASL (MED ASL) 2013; Gayaza, Central Uganda MG565977
B. tabaci Mediterranean Q1 (MED Q1) 2013; Malaga, Spain MG565975
B. tabaci Sub-Saharan Africa 1 subgroup 3 (SSA1 SG3) 2013; Tanzania MG565976
B. tabaci Asia II 1 (Asia II 1) 2013; Lodhran, Pakistan MG565973
tri-chloromethane vapour and submersion in 90% etha-nol. These methods, however, damaged the specimens significantly (unpublished data).
Microscopy viewing arenas consisted of standard plas-tic petri dishes (60 mm internal diameter) with custom-made black rigid plastic stages inserted. Microcentrifuge tubes were removed singly from liquid nitrogen and frozen whitefly tipped onto the stage. Whiteflies settled with a mostly uniform positioning (dorsal surface facing upwards), but with differing side-to-side orientations.
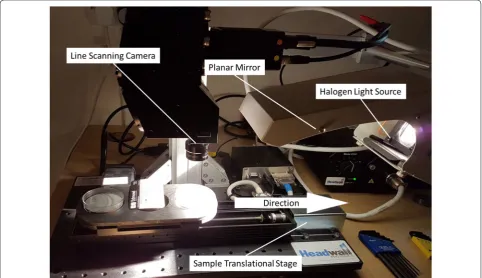
Phase‑2 trial: measurement instrumentation and protocol A commercial line-scanning MSI imaging unit was used (1003B-10143, Hyperspec® VNIR A-Series, Headwall Photonics Inc., Massachusetts, USA), capable of oper-ating across a wavelength range of 380–1000 nm with a spectral resolutions of 0.74 nm. This was fitted with a 23 mm focal length lens (1004A-21445 VNIR lens, Head-wall Photonics Inc., Massachusetts, USA). The instru-ment uses a halogen source for illumination, which is reflected via a concave mirror to reduce the lux intensity variation across the sample. This was operated at ~ 60% of power with the distances from: lens-to-sample = 70 mm, mirror-to-sample = 150 mm and mirror-to-centreline-of-lens = 80 mm. With respect to Fig. 1, this provided a
compromise between SNR achievable from the instru-ment whilst minimising the potential for heat damage of the whitefly.
The whitefly samples were located in a custom laser cut mount, which accepted up to three petri dishes along the direction of travel of the line-scanner’s linear motorized stage. Into the base of each dish was inserted an optically neutral ‘grey-card’ disc, again laser cut, upon which mul-tiple immobilised whitefly were located. The exact num-ber being dependent upon the survival rate of the various species when reared on the differing host plants, between 5 and up to 50. The resulting arrangement provided a field of view of the width of the petri dish with a spatial resolution of 60 microns. The speed of the linear stage being then adjusted to generate square aspect ratio pix-els. The system was calibrated for variations in the spatial light intensity, using a white barium sulphate optical ref-erence tile.
Phase‑2 trial: spatial image handling and segmentation method
All analyses in Phase-2 were written using the Python-3 programming language, utilising the ‘SciKit-Learn’ [23] toolbox (www.sciki t-learn .org) with ‘NumPy’ [24] (www. numpy .org) to handle large array operations. The imaging
system outputs flat binary files with associated header files. In addition to this, colour (RGB) preview images were saved during the experimental image capture phase. Large areas of the master MSI frames did not contain any insects, and so to reduce processing times a rapid cropping stage was used to extract the relevant portions of the data from the raw MSI files, which were in excess of 16 GBytes in size. These cut-out portions of the MSI data typically contained between 1 and 20 individual whiteflies. In total 566 cut-outs were used for training and testing. These were then saved in the same format as the master images and named with the whitefly category encoded in the filename.
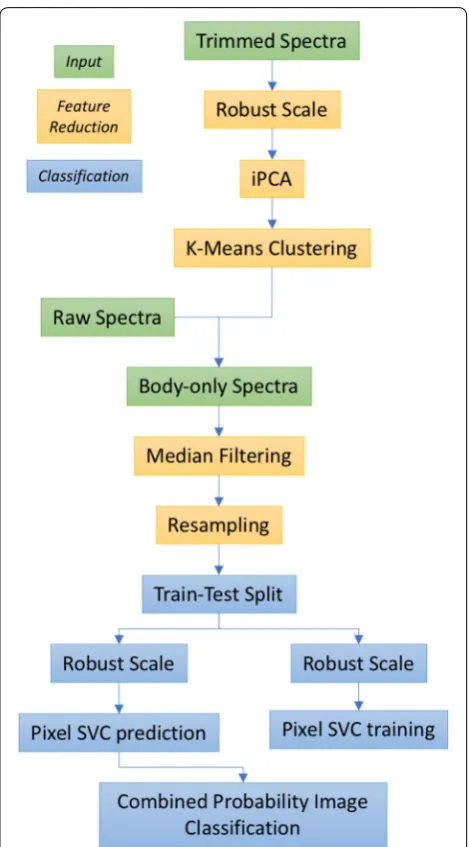
With reference to the flowchart of Fig. 2, to separate different body components, across all species the spectra were clustered using unsupervised classification. Manual inspection of the images showed increased image noise below 420 nm and between 900 nm and 1030 nm. The dataset was trimmed to exclude bands in these regions as the Principal Component Analysis (PCA) method is sen-sitive to Gaussian noise, which reduces the robustness of the resulting classification. The robust scaling algorithm (sklearn.preprocessing.RobustScaler), from the ‘SciKit-Learn’ package, was used to mean-centre each raw pixel spectrum. In order to process the large dataset (800,000 observations of 700 spectral bands) Incremental Princi-pal Component Analysis (iPCA—sklearn.decomposition. IncrementalPCA) was performed on the dataset. Each pixel was treated as a separate observation, i.e. spatial information not incorporated into the model.
The spectra were clustered into broad classes, using the K-Means clustering algorithm (sklearn.cluster.KMeans, ‘SciKit-Learn’) on the decomposed dataset. We hypothe-sised that each pixel in the cleaned dataset would be a mem-ber of either ‘wing’, ‘body’ or ‘background’ and so set the number of clusters a priori to three. All other parameters in the clustering function were held at the default values. Images were checked manually to identify the anatomical clustering. These steps can be considered a semi-supervised segmentation tool, preventing the need for manual annota-tion of the images to identify the body region.
As the objective of this study was to classify insect spe-cies, the body pixels identified in the previous step were used for training a support vector classifier (SVC). This uses the support vector machine algorithm implemented as a classifier (as opposed to a regressor in Support Vec-tor Regression).
Results Phase‑1 trial
This initial study indicated that an 85 to 95% correct clas-sification for whitefly species may be achieved for the four species studied, with respect to the others, using
just 11 of the available 63 wavebands. The chosen wave-lengths being selected based upon their relative contribu-tion to the model (loadings) so as to achieve the highest classification accuracy for the data-set without including additional noise from non-contributing wavebands. The Phase-1 trial was limited to adult whitefly all of a simi-lar age and cultivated under controlled laboratory con-ditions with similar diets and environments. However,
it provided adequate evidence as to the effectiveness of using active MSI for extracting B. tabaci, and other leaf borne pests, from the host plant images to lead into the Phase-2 investigation. Furthermore it demonstrated that through spectral analysis of only the pixels corresponding to the pests the technique provided adequate information within the image date across the 380–980 nm wavelength range to classify B. tabaci, and so verified the viability of using proprietary, low-cost, silicon sources and detectors for this type of duty.
The initial trails also showed that the optical arrangement within the test instrumentation resulted in reduced image fidelity, and potential errors in species classification, associ-ated with specular reflectance and inhomogeneous illumi-nation of the leaf samples. The latter aspects of the system design have now been addressed, through exploiting a vari-ant of system design for plvari-ant leaf analysis. However, pend-ing the realisation of the revised active MSI system, the Phase-2 trials were undertaken with a high spectral resolu-tion commercial reference hyperspectral imaging unit.
Phase‑2 trial: image segmentation and semi‑automated pixel labelling
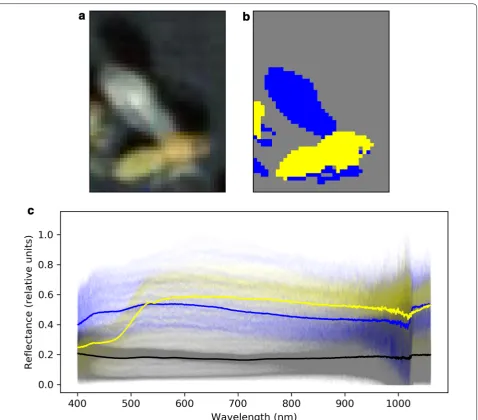
The first 3 principle components explained 99.0% of the variance in the data (see Fig. 1) and so only the first 3 principle components were used for K-means cluster-ing. Classes were colour-coded and manually inspected in a random subset of the data. A typical example is pre-sented in Fig. 3b where the three classes can be seen to broadly corresponded to insect body, insect wing and background. From this, a class which described the insect body pixels was selected and the array describing the centroid of each of the 3 classes was stored to remove the need for manual identification of each class every time the code was run. As such, this allowed rapid identifica-tion of body pixels in our dataset, preventing the need for manual labelling of body regions in every image.
Phase‑2 trial: multivariate classification of spectral data Only the insect body pixels, segmented as described above, were included in the next stage of analysis as these body regions where expected to be important in spectrally differentiating the species types. Each pixel spectrum was median filtered (scipy.signal.medfilt, ‘SciKit-Learn’) and resampled to between 4 and 60 equal wavebands to both reduce the dimensionality of the data-set and better represent the sensor information likely to be acquired from future, bespoke instrumentation. The data were then labelled as either ‘SSA1’ or ‘Other’. Two-class support vector Two-classifiers (SVCs—sklearn.svm. SVC, ‘SciKit-Learn’) were then fit to ~ 50% of the data and scored against the remainder. Data were split such that subset images were not split across training and test
sets. For testing, all body-pixels were classified by the trained SVC classifier, giving a pixel classification accu-racy (Fig. 4). The median probability of class member-ship was used to determine the final classification for any given image, i.e. for a given image, if Median (P(1)) > 0.5 then Class = 1.
With reference to Fig. 4, pixel classification accuracy increased with the number of features between 4 and 20 features, however above this number there was no improvement in classification with increased numbers of features. For image classification, images with 50–200 pixels classified with similar accuracy, i.e. 89–91% cor-rectly classified for a 20 feature classifier. However, increasing the minimum threshold to 250 pixels/image improved the classification accuracy to 98% with the same 20 feature classifier. Overall, the optimal classifier had 20 wavebands and required a minimum of 250 pixels to classify at an accuracy of 98%.
Background pixel reflectance was relatively uniform across all diet-by-species classes indicating that there was no variation in illumination intensity between different image captures. With reference to Fig. 5, the biggest dif-ferences in spectral reflectance were between SSA1 SG3, as reared on cassava and eggplant, and the other classes. B. tabaci Asia II 1and MED Q1 had similar reflectance spectra, independent of diet. SSA1 reared on Kale appeared similar to Asia II 1 and MED Q1.
Discussion
Body reflectance spectra for B. tabaci identification
For the first time, this initial study demonstrates that through an integration of both the spatial data, associ-ated with the multispectral images being used to sepa-rate different regions of the insect, and subsequent spectral analysis of those sub-regions, a key viral vector (SSA1 SG3) can be differentiated from other cryptic spe-cies, that appear indistinguishable to a human observer, with an accuracy of up to 98%. Findings were consistent between the two phases which showed that populations of SSA1 (subgroups 1 and 3) could be separated from populations of MED (ASL and Q1) using different instru-mentation and classification methods. Furthermore, in the case of insects reared on eggplant, SSA1 SG3 had dif-ferent body reflectance spectra to Asia II 1 and MED Q1 when reared on the same diet, as illustrated in Fig. 5. This strongly suggests species-specific body pigmentation occurs independently of plant-host diet.
The large spectral differences between SSA1 SG3 fed on the three different diets, i.e. see Fig. 5, suggest that this does indeed influence body colouration and so further work is needed to understand the effect this may have on a classification system. However this aspect may be read-ily accommodated within a future study through a more extensive training and validation set of sampled insects, which fully reflect the breadth of host plants where the SSA1 SG3 species may be commonly found.
Justification for an imaging system
An important feature of this work is the use of a mul-tispectral imaging sensor rather than taking a single
material, dust, spoil debris, insect wings or legs, in the case of a defocused reflectance-spectra measurement point, or inadequate SNR to gain the classification within appropriate time, for a focused spectral measurement point covering just a small circular area of the relevant insect body part(s). Hyperspectral imaging approaches
have been used to classify closely-related species [25,
26] and different morphs of the same insect species [26], however our approach builds on these through the use of a morphological segmentation pre-processing step. This reduced the noise from non-classifiable body regions, such as the wings, and allowed robust identification Fig. 4 Accuracy of classifier for different degrees of spectral smoothing. The classification score is the proportion of images correctly classified, except for the line labelled ‘pixel’, which represents the proportion of pixels correctly classified. For each degree of smoothing, the minimum number of pixels per image for inclusion in the scoring is shown by different coloured lines
of the viral vector SSA1 SG3. Using an imaging sensor also allows population estimation on individual plants through counting individuals [7, 8]. This could be impor-tant both for farmers in monitoring infestation levels and calculating insecticide dose, as well as for the breeding, epidemiology and virology research community, in seek-ing to understand host diversity for different whitefly species as well as to map and control the spread of the vectors across geographic regions.
Implications for sensor system design
The instruments used within this study are not currently field-compatible, in terms of speed, functionality or cost and so we propose the development of new instrumen-tation based on the findings presented in this paper. In Phase-2, simulating different bandwidth sensitivity showed that a minimum of 20 wavebands, each with a bandwidth of approx. 35 nm, covering the 400–1100 nm region would be needed for optimum classification accu-racy using this technique. Phase-2 findings also suggest a spatial resolution allowing at least 250 pixels per insect would be needed in order to classify at 98% accuracy. As such, future instrumentation should be designed with appropriate spatial and spectral resolution.
This study demonstrates that cryptic species identifica-tion is possible using an imaging system based on low-cost and readily available commercial silicon sources and imaging arrays, combined with relatively modest processing power. In addition to a low cost sensor, there is a requirement to implement the homogenous and dif-fuse (shadow free) optical illumination platform, such as reported elsewhere [27], in order to utilise the more subtle species classifier models of the Phase-2 study within the actively illuminated imaging sensor system architecture of the Phase-1 investigation. Furthermore, to enhance the usability of the system compensation is required for the orientation and distance of the focal plane of the sample with respect to the imaging array lens, across the multiple wavelengths. Similarly, the reli-ance on chilling of the insects to reduce their mobil-ity and potential for reorientation during multispectral imaging has been reduced within the design for the next generation of the ‘Bravo’ unit. This exploits a dedicated FPGA, based on the Altera Cyclone V family of proces-sors, and custom electronics for high-speed data pro-cessing and interfacing to a large-format (16 mm square) full-frame image capture sensors (Sony Pregius IMX250). Additionally, significantly higher intensity and homo-geneous lighting is achieved using a combination of an optical integrating hemisphere with appropriately located LEDs driven by high power current sources, run at very short duty-cycle to prevent overheating of the sources. The resulting system reduces the capture time for a
typical 32 waveband multi-spectral dataset to less than a second, whilst achieving a resolution of 2048 by 2048 pix-els for each wavelength image.
Wider context and further work
A methodology such as that presented in this paper, when translated into handheld sensor system, has the potential to offer much-needed monitoring of food security threats in Sub-Saharan Africa, especially when integrated with other meta-data streams. The projected low-cost and portable nature of a handheld unit based on readily-available components would enable such a system to be viably deployed to a large number of areas for real-time mapping of potential insect disease vectors.
As well as offering in-field diagnostics for farm man-agement, the geographic spread and prevalence of known disease-carrier species would be dynamically mapped on a seasonal basis. Through combination with data from an on-board GPS module and direct or proxy, e.g. via Bluetooth to a cellular phone, wireless connectivity to the external world such networked multispectral sensors may act as direct or pseudo, via back-to-base downloads, real-time feeds to a Geographical Information System (GIS), for disease forecasting and mapping.
Such GIS mapping would be reliant on the access to both the above data as well as additional meta-data on crop, soil, environment and weather conditions, many of which would be derived from remotely sensed aerially or satellite derived information. The latter opens up the potential for the future handheld MSI systems to act as ground-truthing data in support of the remotely sensed disease, and other biotic and abiotic, crop stress models. In the case of CMD, CBSD and sooty moulds, such sys-tems would appear to be viable to support direct auton-omous detection of the early symptoms of the diseases directly upon cassava leaves [28], from Sentinel 2 and other publicly available satellite data sources.
Abbreviations
ACMV: African cassava mosaic virus; CBSD: cassava brown streak disease; CMD: cassava mosaic disease; DAC: Development Assistance Committee; FAOSTAT : Food and Agriculture Organization of the United Nations Statistics; FWHM: full width half maximum; GB: GenBank; GIS: Geographical Information System; iPCA: Incremental Principal Component Analysis; InGaAs: indium gallium arsenide; LEDs: light emitting diodes; MSI: multispectral imaging; NIR: near infrared; PCA: Principal Component Analysis; PLS-DA: Partial Least Squares Discriminative Analysis; RGB: red green blue; SNR: signal-to-noise ratio; SVC: support vector classifiers; Vis: visible.
Authors’ contributions
of the Phase-2 study. Joachim Nwezeobi performed the laboratory work required to deliver the Phase-1 trial data. Sharon van Brunschot designed and expedited the insect immobilization technique and undertook the entomo-logical & molecular work for the Phase-2 trial. Joseph Fennell designed and performed the Phase-2 experiments and delivered the corresponding data analysis. Dingle Jose delivered the engineering design discussion commentary on how the research is to be implemented within the practical field unit. All authors read and approved the final manuscript.
Author details
1 School of Electrical and Electronic Engineering, University of Manchester, Oxford Road, Manchester M13 9PL, UK. 2 School of Physics and Astronomy, University of Manchester, Oxford Road, Manchester M13 9PL, UK. 3 Natural Resources Institute, University of Greenwich, Chatham Maritime, Kent ME4 4TB, UK.
Acknowledgements
The authors would like to acknowledge The Bill & Melinda Gates Foundation for their support in funding the research (African Cassava Whitefly Project, OPP1058938) and the Universities of Greenwich and Manchester for access to their resources and facilities in order to undertake the investigations.
Competing interests
The authors declare no conflict of interest. The Bill & Melinda Gates Founda-tion had no role in the design of the study; in the collecFounda-tion, analyses, or interpretation of data; in the writing of the manuscript, and in the decision to publish the results.
Availability of data and materials
All data generated or analysed during this study is available on request to the corresponding author.
Consent for publication Not applicable.
Ethics approval and consent to participate Not applicable.
Funding
This work was supported by the Bill & Melinda Gates Foundation (African Cassava Whitefly Project, OPP1058938), which provided funds to enable the collaborative investigation to be undertaken by the Universities of Greenwich and Manchester and for arranging the initial collaborative research workshop in Zambia, Tanzania (Cassava and Sweet Potato Breeding, Virology, and Epidemiology Connections Workshop, November 2014), at which the original concepts were identified alongside in-country virologists and cassava breeding scientists in Africa.
Publisher’s Note
Springer Nature remains neutral with regard to jurisdictional claims in pub-lished maps and institutional affiliations.
Received: 30 December 2017 Accepted: 16 September 2018
References
1. Hagen NA, Kudenov MW. Review of snapshot spectral imaging technolo-gies. Opt Eng. 2013;52(9):090901.
2. Patil BL, Fauquet CM. Cassava mosaic geminiviruses: actual knowledge and perspectives. Mol Plant Pathol. 2009;10(5):685–701.
3. Colvin J, et al. Host-plant viral infection effects on arthropod-vector population growth, development and behaviour: management and epidemiological implications. Adv Virus Res. 2006;67:419–52.
4. Otim-Nape G, et al. The current pandemic of cassava mosaic virus disease in East Africa and its control. Chatham: Natural Resources Institute; 2000. 5. Legg JP, Fauquet CM. Cassava mosaic geminiviruses in Africa. Plant Mol
Biol. 2004;56(4):585–99.
6. Maruthi M, et al. Reproductive incompatibility and cytochrome oxidase I gene sequence variability amongst host-adapted and geographically separate Bemisia tabaci populations (Hemiptera: Aleyrodidae). Syst Ento-mol. 2004;29(4):560–8.
7. Maruthi MN, Hillocks RJ, Mtunda K, Raya MD, Muhanna M, Kiozia H, Rekha AR, Colvin J, Thresh JM. Transmission of Cassava brown streak virus by Bemisia tabaci (Gennadius). J Phytopathol. 2005;153(5):307–12. https :// doi.org/10.1111/j.1439-0434.2005.00974 .x.
8. Martin JH. An identification guide to common whitefly pest species of the world (Homopt Aleyrodidae). Int J Pest Manag. 1987;33(4):298–322.
https ://doi.org/10.1080/09670 87870 93711 74.
9. Aduwo JR, Mwebaze E, Quinn JA. Automated vision-based diagnosis of cassava mosaic disease. In: Industrial Conference on Data Mining-Work-shops. 2010.
10. Tuhaise J, Quinn JA, Mwebaze E. Pixel classification methods for auto-matic symptom measurement of cassava brown streak disease. 11. Hassan SNA, et al. Vision based entomology-how to effectively exploit
color and shape features. Comput Sci Eng. 2014;4(2):1.
12. Mayagaya VS, et al. Non-destructive determination of age and species of Anopheles gambiae sl using near-infrared spectroscopy. Am J Trop Med Hyg. 2009;81(4):622–30.
13. Sikulu M, et al. Near-infrared spectroscopy as a complementary age grad-ing and species identification tool for African malaria vectors. Parasites Vectors. 2010;3(1):49.
14. de Lima MG, Moura MO, Arízaga GGC. Barcoding without DNA? Species identification using near infrared spectroscopy. Zootaxa. 2011;2933:46–54.
15. Dowell FE, et al. Identifying stored-grain insects using near-infrared spectroscopy. J Econ Entomol. 1999;92(1):165–9.
16. Aldrich BT, et al. Identification of termite species and subspecies of the genus Zootermopsis using near-infrared reflectance spectroscopy. J Insect Sci. 2007;7(18):1–7.
17. Cole T, et al. Near-infrared spectroscopic method to identify Cotesia flavipes and Cotesia sesamiae (Hymenoptera: Braconidae). Ann Entomol Soc Am. 2003;96(6):865–9.
18. Lazzari S, et al. Intra and interspecific variation assessment in Psocoptera using near spectoscopy. Julius-Kühn-Archiv. 2010;425:139.
19. Jia F, et al. Differentiating tobacco budworm and corn earworm using near-infrared spectroscopy. J Econ Entomol. 2007;100(3):759–64. 20. Junior WA, et al. Intra-and interspecific variation of cuticular hydrocarbon
composition in two Ectatomma species (Hymenoptera: Formicidae) based on Fourier transform infrared photoacoustic spectroscopy. Genet Mol Res. 2008;7(2):559–66.
21. Grieve B, et al. Localized multispectral crop imaging sensors: Engineering & validation of a cost effective plant stress and disease sensor. In: Sensors Applications Symposium (SAS), 2015 IEEE. IEEE; 2015.
22. Rondeaux G, Steven M, Baret F. Optimization of soil-adjusted vegetation indices. Remote Sens Environ. 1996;55(2):95–107.
23. Grieve B, Veys C, Dingle J, Colven J, Nwezeobi J. Portable, in-field, multi-spectral imaging sensor for real-time detection of insect viral-vectors. In: IEEE Sensors 2017. Glasgow, UK; 2017. p. 990–2.
24. Dinsdale A, et al. Refined global analysis of Bemisia tabaci (Hemiptera: Sternorrhyncha: Aleyrodoidea: Aleyrodidae) mitochondrial cytochrome oxidase 1 to identify species level genetic boundaries. Ann Entomol Soc Am. 2010;103(2):196–208.
25. Pedregosa F, et al. Scikit-learn: Machine learning in Python. J Mach Learn Res. 2011;12:2825–30.
26. Millman KJ, Aivazis M. Python for scientists and engineers. Comput Sci Eng. 2011;13(2):9–12.
27. Cao Y, Zhang C, Chen Q, Li Y, Qi S, Tian L, Ren Y. Identification of species and geographical strains of Sitophilus oryzae and Sitophilus zeamais using the visible/near-infrared hyperspectral imaging technique. Pest Manag Sci. 2015;71:1113–21.