R E S E A R C H
Open Access
Algorithmic processing of pressure waveforms
to facilitate estimation of cardiac elastance
David Stevenson
1, James Revie
1, J Geoffrey Chase
1, Christopher E Hann
1, Geoffrey M Shaw
2,
Bernard Lambermont
3, Alexandre Ghuysen
3, Philippe Kolh
3and Thomas Desaive
3**Correspondence: [email protected]
3Cardiovascular Research Center, University of Liege, Belgium Full list of author information is available at the end of the article
Abstract
Background: Cardiac elastances are highly invasive to measure directly, but are clinically useful due to the amount of information embedded in them. Information about the cardiac elastance, which can be used to estimate it, can be found in the downstream pressure waveforms of the aortic pressure (Pao) and the pulmonary artery
(Ppa). However these pressure waveforms are typically noisy and biased, and require
processing in order to locate the specific information required for cardiac elastance estimations. This paper presents the method to algorithmically process the pressure waveforms.
Methods: A shear transform is developed in order to help locate information in the pressure waveforms. This transform turns difficult to locate corners into easy to locate maximum or minimum points as well as providing error correction.
Results: The method located all points on 87 out of 88 waveforms forPpa, to within
the sampling frequency. ForPao, out of 616 total points, 605 were found within 1%, 5
within 5%, 4 within 10% and 2 within 20%.
Conclusions: The presented method provides a robust, accurate and dysfunction-independent way to locate points on the aortic and pulmonary artery pressure waveforms, allowing the non-invasive estimation of the left and right cardiac elastance.
Background
In an Intensive Care Unit (ICU), cardiac disturbances are difficult to diagnose and treat, which can lead to poor management [1,2]. Inadequate diagnosis can be common, and plays a significant role in increased length of stay and death [3-5], despite access to many different cardiac measurements and metrics. Currently, internal measurements are only possible at the locations where catheters are placed. This limited set of data can severely restrict clinical diagnostic capability, and thus these catheters are not necessarily asso-ciated with improved outcomes [6-8]. Overall, a lot of data currently available to ICU clinicians, that could have significant clinical value, is under utilised.
Using modelling techniques, this limited set of data can be expanded to estimate a much greater set of clinically relevant data to enable more accurate diagnosis. For example, acute cardiovascular dysfunction, like pulmonary embolism (PE) and septic shock, severely alter cardiovascular system (CVS) hemodynamics around the heart. These changes can be seen by catheter measurements as a change in the balance of preload and afterload, resulting in an altered cardiac energetic state [9,10]. Detailed cardiac energetics
are too invasive to measure in an ICU setting. However, if the relevant energetics could be captured from a nearby catheter, the clinical potential of such measurements could be realised. To date, no such method achieves this aim.
Time-varying cardiac elastance (TVE) is defined [11]:
e(t)= Pv(t)
Vv(t)−Vd
(1)
where,Vd is assumed to be equal to V0for simplicity, V0 is the intercept of the
end-systolic pressure-volume relation (ESPRV) with the volume axis [12],Pv(t)is the ventricle pressure andVv(t)is the ventricle volume. It thus provides a measure of heart function
and energetics [13-15]. The waveforme(t) is typically normalised to a value of 1.0 [13],
and can also be used as the input or driver function in lumped parameter CVS models [16-20].
There have been several attempts to estimate TVE [14,21-24]. However, none have esti-mated it for its own sake. Most studies present a method using the TVE to estimate a
specific parameter, most commonly end-systolic elastance (Ees) [14,23,24] and ejection
fraction [22]. However, their validation is based on these metrics, not on the resulting TVE waveform.
This research is unique in that the end goal is to produce the TVE function in its own right, validating the TVE waveform on its own accuracy for eventual use as a diagnostic tool. It is unclear to date how much specific information can be obtained from the TVE waveform, other than the highly sought-afterEes[25] (although this cannot be found from the normalised TVE waveform). However, TVE features are highly correlated to clinical parameters [26] and contain similar information to pressure-volume (PV) loops, which are known to contain information on cardiac function [27] including cardiac work [28,29], contractility [13,30], O2consumption [29,31], and all the states of filling, contraction
ejec-tion and relaxaejec-tion [1]. Thus, a TVE waveform reflects cardiac state, cardiac output or blood volume, and net preload and afterload, all of which change with cardiac dysfunc-tion. Hence, the ability to easily and non-invasively obtain TVE waveforms could enable clinically useful diagnostics and metrics.
This paper presents the first step in estimating TVE from already available measure-ments, namely aortic (Pao) and pulmonary artery (Ppa) pressure. This research develops algorithms to process these pressure waveforms to extract specific features and points,
which, in turn, allow the estimation of the end goal, the TVE waveform. ThePao and
Ppa pressure waveforms, as typically measured, are noisy and/or biased, which can
sig-nificantly effect this process. Hence, a method is presented for automatically processing the pressure waveforms to robustly and accurately locate the points required by the cor-relations, that enable accurate, not additionally invasive cardiac elastance estimation and construction.
Methods
Concept
the typically measured waveforms,PaoandPpa, enable construction of continuous
beat-to-beat estimations of TVE with knowledge only of thePaoandPpawaveforms and the
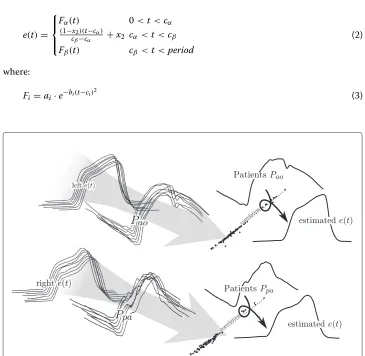
pre-defined correlations. It thus uses typically available data to construct what would oth-erwise require a highly invasive added test. A high level view of this approach is presented in Figure 1, which shows the formation and use of the correlations to generate and esti-mated cardiac elastance waveform. This paper is focused on the left half of Figure 1, that of producing the correlations for later use. A brief overview of the whole method is given for clarity:
1. locate points onPaoandPpa(this paper)
2. correlate points of the pressure waveforms to points on the measured cardiac elastance
3. use these correlations to estimate the points on the cardiac elastance 4. create a continuous functione(t) through the estimated points with (2)-(4) 5. compare the estimated elastance waveform to the measured elastance waveform
e(t)= ⎧ ⎪ ⎨ ⎪ ⎩
Fα(t) 0<t<cα (1−x2)(t−cα)
cβ−cα +x2 cα <t<cβ Fβ(t) cβ <t<period
(2)
where:
Fi=ai·e−bi(t−ci) 2
(3)
and the coefficients of (3), also seen in (2), are fitted for a specific waveform, and are defined:
aα =x2
bα = −
log(x1/x2)
exp(log(−log(x1/x2)·2·(x1/x˙1))·2)
cα = −
log(x1/x2)·2·x1− ˙x1·t1
˙ x1
(4)
where aβ, bβ andcβ are similarly defined by replacing subscript 1 with 3 and setting
x2=1.
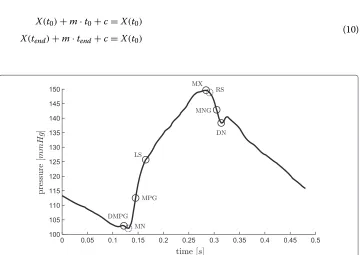
Figure 2 shows an illustrative mapping between points onPaoand TVE. However, this
approach is useful if and only if it is possible to automate the detection of the required points, defined in (5), on thePaoandPpawaveforms, shown in Figures 3 and 4.
This paper focuses on the robust capturing of the points on the pressure waveforms and leaves the specific correlations and methodology of creating the TVE waveforms to a paper in review. The details contained in this paper about the formulation of the correla-tions and there use are illustrative only, and are assumed to be correct for the purposes of demonstrating a potential use for this research.
For describing the methods in this paper, a naming convention is defined:
e(t)≡ time varying cardiac elastance
Pao≡ aortic pressure
Ppa≡ pulmonary artery pressure
DMPG≡ driver maximum positive gradient
MN ≡ minimum point
MPG≡ maximum positive gradient (5)
LS≡ left shoulder
MX≡ maximum
RS≡ right shoulder
MNG≡ maximum negative gradient
DN ≡ dicrotic notch
Shear Transform
This paper uses a shear transform to extract features from thePaoandPpawaveforms,
defined:
S≡(t,X(t))→(t,φshear(X(t))) (6)
where:
φshear(X(t))=X(t)+mt+c, t0<t<tend (7)
Figure 2 Illustrative elastance estimation.An example of what can be done with the identified points on the aortic pressure, and an example of the formation of the estimated cardiac elastance is shown here, while the terms are defined in (5). This figure is not part of the method of this paper, rather as a illustration of what the method as a whole leads to.
and the parameterst0andtendare set depending on the region or period of interest. The
parametersmandcare chosen such that:
φshear(X(t0))=X(t0)=φshear(X(tend)) (9) Equation (9) leads to:
X(t0)+m·t0+c=X(t0)
X(tend)+m·tend+c=X(t0)
(10)
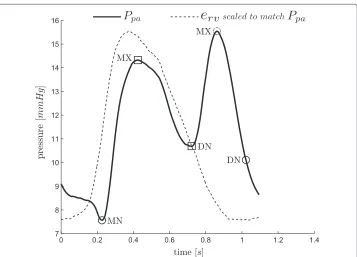
Figure 4 Pulmonary artery pressure waveform and relevant points.A representative pulmonary artery pressure waveform over one heart beat with relevant points (defined in (5)) marked on it. The dashed circle, MXis only used to help find other points.
Solving (10), formandcyields:
m= X(t0)−X(tend) tend−t0
c= −m·t0
(11)
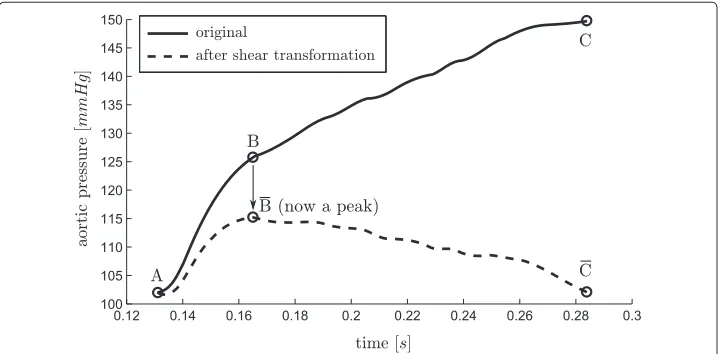
To better visualize how this transformation operates, imagine a line fromAto C in
Figure 5, representing a portion of the waveform in Figure 3, rotated about Aso that
end points align horizontally, while time remains unchanged. Hence, it is a rotation and contraction that projects the line onto a horizontal axis (time). The effect of this
transfor-mation is to transform the difficult to find “shoulder” pointBinto an easily found peak
of a curve, or for the reflection ofA→ Binx, a minimum or the curve. A “shoulder” is
defined as a point at which two near linear lines with different slopes meet, such as the
pointLSin Figure 3. Thus, the use of this transform makes it far easier to, algorithmically, locate aspects of the waveforms which can be otherwise difficult to find.
The transform,S, is used in two ways. First it is used to locate a point of interest based
on the maximum or minimum point ofS. This use is demonstrated in Figure 5. Hence, a
desired pointPis defined:
P=SmaxorSmin (12)
Both local maximum,Smax(local), and minimum,Smin(local), are also required.Smax(local)
exists and is the maximum point ofS, if and only if, there exists a maximum stationary
point that does not fall at the temporal boundary ofS, and similarly forSmin(local).
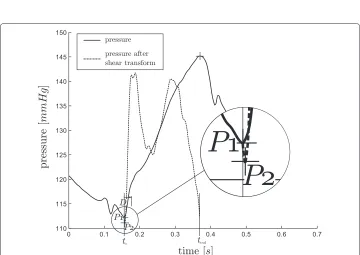
The second way the shear transform of (6) is used relates to the verification of a
par-ticular point given an initial guess. For example, the first guess of the point MN is
the global minimum of the waveform, after which this point is verified using the shear transformation, resulting in confirmation of the point or a new point to use instead.
This works by locating the maximum of minimum point of the shear transform,P2, over
a given range,t, near the first guess,P1, and also defining a threshold time,D. If the point
P2lies temporally withintP1±D, then the correct point is the initial guessP1, otherwise
the correct point isP2.
The choice ofSmaxorSmin, the range of time,t, and the threshold time,D, are defined for the type of point under consideration. The specific values, listed in Section Point loca-tion method, are chosen empirically, based on what features that appear close to the point of interest and the temporal variation that has been observed in these features.
These two situations are graphically shown in Figure 6 and Figure 7 for positive values ofD. However the same applies for negative values, for which the real point lies before the pointP1, instead of after it. The complete process is defined:
P=
P1 iftP2 lies temporally withintP1±D
P2 otherwise
(13)
where:
P1≡initial point to be checked
P2≡SmaxorSmin(chosen separately)
D≡threshold time
t∈ {t:t0<t<tend}
(14)
Combined these two methods of use, shown in Figure 5 - 7, create a robust and computationally fast method for locating certain hard to find points on a waveform.
Point location method
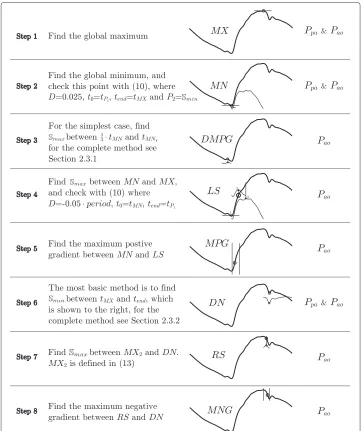
The method for finding the points is described in Figure 8 along with the following two sections (Finding DMPG and Finding DN). Figure 8 gives the full text, reproducible and
ordered method except for the pointsDMPGandDN (which are described in the next
two sections) along with a graphical illustration. The graphical illustrations are the out-working of the method for a representative waveform, and are only intended to aid the reader in their understanding of the method, and not to formally describe the method
Figure 6 Use of the shear transform, A.The desired point forMNisP. However, in this example the global minimum of the waveform isP1, which is the initial guess forMN. A shear transform of the pressure waveform betweenP1andMXreveals a minimum (P2) outside the range ofD, and hence the time ofP2is taken as the time ofMN.
Figure 8 The method.The step by step method for finding the points onPaoandPpa, as labelled on the right. The graphics beside each step are for illustration only and are not meant to be part of the definition of the method, rather to see the method in operation on a representativePaowaveform. Note that the methods described here forDMPGandDNare note complete as these require a more complex method, refer to Sections Finding DMPG and Finding DN for the complete method for these two points.
been described in Figure 8 only for the simplest (as well as the and most common) case, with the full method described in separate sections with relevant figures.
Finding DMPG
There are some cases, whereDMPG, see Figure 3, is equivalent toMN. These cases occur
when:
(tMX−tMN) <period·0.25 (15)
Figure 9 FindingDMPG, A.A straight forward case for findingDMPG, whereP1of (17) exists, hence
DMPG≡P1.
local maximum ofSdoes not exist except at the boundaries of the region, which is not
acceptable if an automated detection method is desired. In this case, a pointP2, is defined
as theSminfrom34·tMNtoMN. IfSmax(local)fromP2toMNexists, this is taken asDMPG,
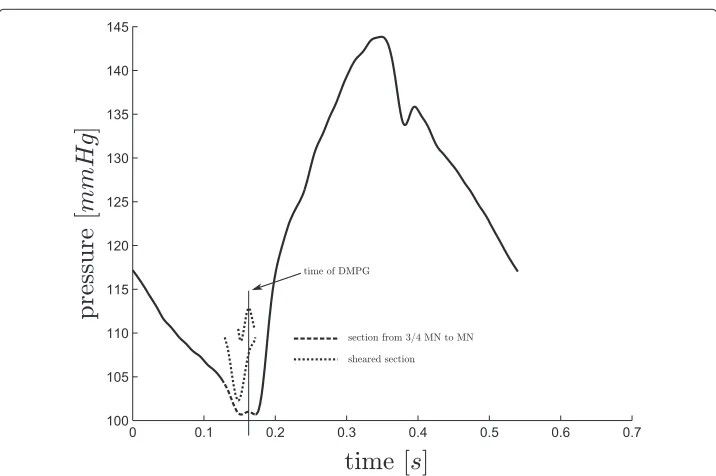
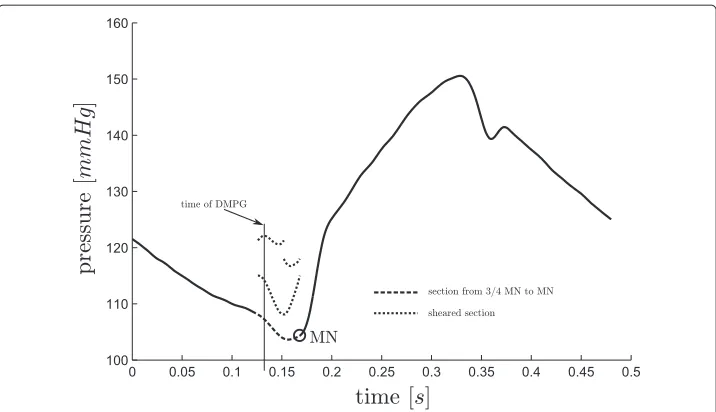
see Figure 10, otherwiseDMPGis defined asSmax(local)from34·tMNtoP2, see Figure 11.
If this final local maximum does not exist,DMPGis defined as34·tMN. These cases occur due to noise, variability and dysfunction and are part of what makes robust algorithmic or automated processing difficult.
Figure 11 FindingDMPG, C.A less common case for findingDMPG, whereP1, andP3of (17) do not exist, butP4does, henceDMPG≡P4.
This process is defined:
P=
⎧ ⎪ ⎪ ⎪ ⎨ ⎪ ⎪ ⎪ ⎩
P1 if∃P1
P3 if∃P3
P4 if∃P4 3
4·tMN otherwise
(16)
where:
P1≡Smax(local), t∈ {t:
3
4 ·tMN <t<tMN}
P2≡Smin(local), t∈ {t:
3
4·tMN <t<tMN} P3≡Smax(local), t∈ {t:tP2<t<tMN}
P4≡Smax(local), t∈ {t:
3
4 ·tMN <t<tP2}
(17)
Finding DN
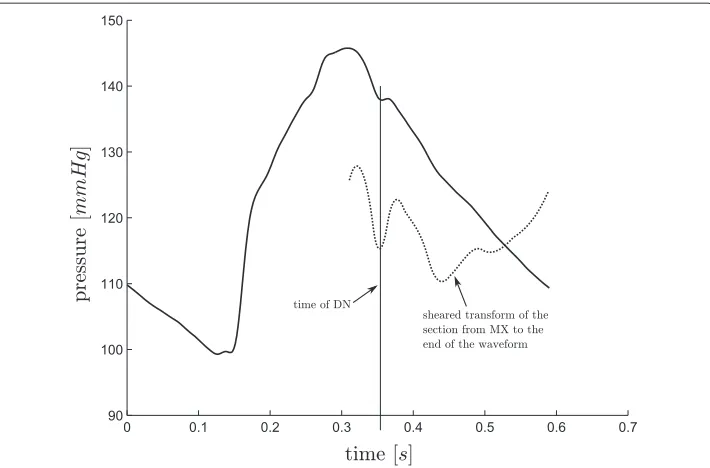
The general approach to find the pointDN, see Figure 3, is to findSmin betweentMX
andtend(orperiod). However, in a number of cases this approach fails due to oscillations towards the end of the waveform, see Figure 12. Also, using only the first local minimum (as is the case in Figure 12) works only in a few cases and therefore is not a robust solution either. Hence a more specific algorithm is required.
A second maximum point is defined:
MX2≡max point ofPao(t), t∈
t:tMN+ period
5 <t<period
Figure 12 FindingDN.An example of where the first local minimum of the shear transform is the correct time for the pointDN.
and two more intermediate points are defined:
DN1≡lowestSmin(local),t∈ {t:tMX2 <t<period} (19)
DN2≡firstSmin(local),t∈ {t:tMX2 <t<period} (20)
FromDN1andDN2, the realDNis chosen, defined:
DN =
DN1 if(CA ∧ CB) ∨ (CC ∧ CD)
DN2 otherwise
(21)
where:
CA≡DN2>MX2
CB≡(tDN2−tMX2) <0.15·period
CC ≡
DN2−DN1
Pao(tMX)
>0.02
CD≡(tDN2−tMX2) <0.11·period
(22)
While using a measuredPpawaveform,DNis defined:
DN =DN1 (23)
Validation Test
The method presented was developed on a set of five pigs (51 waveforms) that were induced with pulmonary embolism [32,33], and then independently tested on a further five pigs (37 waveforms) induced with septic shock, and treated with haemofiltration [34,35].
The points for all waveforms (see Figures 3-4) were identified or checked individually by
eye. The two gradients (MPGandMNG) were first located through simple computation,
location of these points (maximum gradient of a sigmoidal function), they are the two eas-iest and most reliable to find algorithmically, and in fact the algorithmic approach is more
accurate than hand selection. The two shoulders (LSandRS) were first located through
the algorithm developed prior to that which is described in this paper, after which each point was individually checked and corrected. Because there is no formal definition for the location of these “shoulder” points, it was left to an algorithmic definition. For a vali-dation test this definition is self fulfilling. However, asLS(RSis only used to aid in finding MNG, and is hence not included in the validation results) is found as an intermediate step to the estimation of the cardiac elastance, its full and more formal validation would be the results of the cardiac estimation which is not in the scope of this paper. All the remaining points were hand selected.
The automated method was applied to the waveforms and the identified points assessed against the known points for accuracy in time. The use of separate data with different cardiac dysfunction to design and test the method ensures the robustness of the validated method.
Results
For the points (MNandDN) required when usingPpa(Figure 4), the method located both
points in 87 of the 88 waveforms to within the sample frequency of 200Hz (0.005 sec),
missingDN, from one waveform. This missed point is in a waveform at the start of the
third pig of the sepsis cohort and is unique to the data set, both in the measured TVE and
Ppa, as shown in Figure 13, compared to the more typicalPpawaveform in Figure 4. The
failure is due to the unusual second peak ofPpa, and the early decay of the TVE.
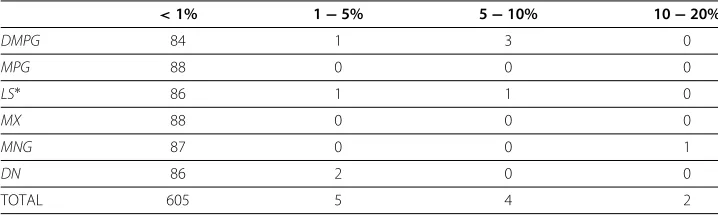
For eachPaowaveform, the method locates eight points,MX,MN,DMPG,LS,MPG, DN,RS,MNG. However,RSandMN are only used to aid the location of other points. These two points were both located sufficiently to enable the method to progress in all 88 waveforms. Results for the other six points are shown in Table 1. Of 616 total points, 605 were found within 1%, 5 within 5%, 4 within 10% and 2 within 20%.
Discussion
The automated, algorithmic method presented enables the mapping between aortic pres-sure (Pao), pulmonary artery pressure (Ppa), and the ventricle TVE (erv(t)andelv(t)), by
accurately processing thePao andPpawaveforms to identify specific points. Once
com-bined, they enable a very useful tool, for clinicians to obtain very accurate TVE without further invasive or risky sensors or procedures.
There are other ways to locate the points on the pressure waveforms, most notably a derivative and second derivative method. However, this becomes problematic in prac-tice due the noise inherent in the waveforms. The method that has been developed in this paper, was designed to work with the level of noise that is typically seen on these measurements, and is therefore more involved than a simple derivative method.
The method presented was robust to the typical and significant variation and noise in
PaoandPpawaveforms. The method was developed on five pigs induced with pulmonary
embolism, and then tested independently with data from another set of five pigs induced with septic shock. The results give confidence that this method will generalize to a wider set of disease states and to human data.
However, while the results were very good, this research needs further validation on a wider cohort of pigs and types of dysfunction to further quantify the limits and accu-racy of this approach. Direct validation on humans is the ultimate goal. However, the results appear robust, and justify and enable a wide range of further more in-depth val-idation studies of both the method and its potential uses when reconstructing TVE for monitoring and diagnosis.
Clinically, it must be noted that for this method to work a Swan-Ganz catheter is assumed. If radial artery pressure was measured instead, there would be more oscillations in the waveform, potentially requiring modifications. However, Swan-Ganz catheters are still commonly used, and this application would add value to their use, which is otherwise sometimes contested [6-8].
Table 1 The error data for each location, grouped by number of points found per error band for each location
<1% 1−5% 5−10% 10−20%
DMPG 84 1 3 0
MPG 88 0 0 0
LS∗ 86 1 1 0
MX 88 0 0 0
MNG 87 0 0 1
DN 86 2 0 0
TOTAL 605 5 4 2
The method developed in this paper shows promise for gaining clinical insight and improving diagnosis. It can enable clinicians to get more information about the current patient state, without the use of more invasive measurements, as well as beat-to-beat tracking of this information. This level of detail is far more than currently available and could potentially lead to better and earlier diagnosis of dysfunction, as well as better knowledge of response to treatment, non-invasively, as it needs no further procedures or sensors required.
Conclusions
This paper has presented a robust, potentially dysfunction-independent method to find the waveform points necessary to use proven methods to non-invasively and automati-cally estimate the otherwise unavailable left and right ventricle TVEs with accuracy well within measurement error. This capability is enabled using standard measurements that are already commonly used in an intensive care setting, thus involving no additional risk to the patient. The results thus justify prospective validation of these conclusions.
Competing interests
The authors declare that they have no competing interests.
Acknowledgements
This work was supported by the Foundation for Research Science and Technology (FRST) of New Zealand, the Fonds de la Recherche Scientifique (FNRS, Belgium) and the French Community of Belgium (Actions de Recherches Concertées Académie Wallonie-Europe)
Author details
1Department of Mechanical Engineering, Centre for Bio Engineering at the University of Canterbury, Christchurch,
New Zealand.2Department of Intensive Care, Christchurch Hospital, Christchurch, New Zealand.3Cardiovascular Research Center, University of Liege, Belgium.
Author’s contributions
DS drafted the manuscript and developed the algorithm. JR and JC participated in the algorithm development with added input from TD. CH participated in the initial mathematical formulation. GS provided physiological understanding and clinical input at all stages. BL, AG, PK and TD provided the porcine data and further clinical input and relevance. JC and TD edited and aided the writing of the manuscript and revisions with DS. All authors read and approved the final manuscript.
Received: 23 December 2011 Accepted: 28 May 2012 Published: 15 June 2012
References
1. Guyton A, Hall J:Textbook of Medical Physiology. Philadelphia: W.B. Saunders Company; 2000. 2. Grenvik A, Ayres SM, Holbrook PR:Textbook of Critical Care. Philadelphia: W.B. Saunders Company; 1989. 3. Angus DC, Linde-Zwirble WT, Lidicker J, Clermont G, Carcillo J, Pinsky MR:Epidemiology of severe sepsis in the
United States: analysis of incidence, outcome, and associated costs of care.Crit Care Med2001,29(7):1303–10. 4. Kearon C:Diagnosis of pulmonary embolism.CMAJ2003,168(2):183–94.
5. Pineda LA, Hathwar VS, Grant BJB:Clinical Suspicion of Fatal Pulmonary Embolism.Chest2001,120(3):791–5. [http://chestjournal.chestpubs.org/content/120/3/791.full]
6. Frazier S, Skinner GJ:Pulmonary artery catheters: state of the controversy.Journal of Cardiovascular Nursing 2008,23:113–21.
7. Chatterjee K:The Swan-Ganz Catheters: Past, Present, and Future.Circulation2009,119:147–152. 8. Cooper A, Doig WJ, Sibbald GS:Pulmonary artery catheters in the critically ill.Crit Care Med1996,12:777–94. 9. Weber KT, Janicki JS:The heart as a muscle-pump system and the concept of heart-failure.Am Heart J1979,
98(3):371–84.
10. Ross JJ:Afterload mismatch and preload reserve: a conceptual framework for the analysis of ventricular function.Prog Cardiovasc Dis1976,18:255–64.
11. Suga H, Sagawa K:Instantaneous pressure-volume relationships and their ratio in the excised, supported canine left ventricle.Circ Res1974,35:117–26.
12. Sagawa K:The end-systolic pressure-volume relation of the ventricle: definition, modifications and clinical use.Circulation1981,63(6):1223–7.
13. Suga H, Sagawa K, Shoukas AA:Load independence of the instantaneous pressure-volume ratio of the canine left ventricle and effects of epinephrine and heart rate on the ratio.Circ Res1973,32(3):314–22.
15. Sunagawa K, Sagawa K, Maughan WL:Ventricular interaction with the loading system.Ann Biomed Eng1984,
12(2):163–89.
16. Smith BW, Chase JG, Nokes RI, Shaw GM, Wake G:Minimal haemodynamic system model including ventricular interaction and valve dynamics.Med Eng Phys2004,26(2):131–9.
17. Starfinger C, Chase JG, Hann CE, Shaw GM, Lambermont B, Ghuysen A, Kolh P, Dauby PC, Desaive T:Model-based identification and diagnosis of a porcine model of induced endotoxic shock with hemofiltration.Math Biosci 2008,216(2):132–9.
18. Chung DC, Niranjan SC, Clark J, Bidani A, Johnston WE, Zwischenberger JB, Traber DL:A dynamic model of ventricular interaction and pericardial influence.Am J Physiol1997,272(6 Pt 2):H2942—62.
19. Revie J, Stevenson D, Chase G, Hann CE, Lambermont B, Ghuysen A, Kolh P, Morimont P, Shaw GM, Desaive T:
Clinical detection and monitoring of acute pulmonary embolism: proof of concept of a computer-based method.Annals of Intensive Care2011,1(33). [http://www.annalsofintensivecare.com/content/1/1/33] 20. Revie J, Stevenson D, Chase JG, Hann CE, Lambermont B, Ghuysen A, Kolh P, Shaw GM, Heldmann S, Desaive T:
Validation of subject-specific cardiovascular system models from porcine measurements.Comput Methods Programs Biomed2011. in-press. [http://www.sciencedirect.com/science/article/pii/S0169260711003014] 21. Guarini M, Urzúa J, Cipriano A, González W:Estimation of caridac function from computer analysis of the
arterial pressure waveform.IEEE Transactions on Biomedical Engineering1998,45(12):1420–8.
22. Swamy G, Kuiper J, Gudur MSR, Bari Oliver N, Mukkamala R:Continuous Left Ventricular Ejection Fraction Monitoring by Aortic Pressure Waveform Analysis.Ann Biomed Eng2009,37(6):1055–68.
23. Shishido T, Hayashi K, Shigemi K, Sato T, Sugimachi M, Sunagawa K:Single-beat estimation of end-systolic elastance using bilinearly approximated time-varying elastance curve.Circulation2000,102(16):1983–9. 24. ten Brinke EA, Klautz RJ, Verwey HF, van der Wall EE, Dion RA, Steendijk P:Single-beat estimation of the left
ventricular end-systolic pressure-volume relationship in patients with heart failure.Acta Physiol (Oxf)2010,
198:37–46.
25. Burkhoff D:Chasing the Elusive Pressure-Volume Relationship.J Am Coll Cardiol Img2009,2:1282–4. 26. Starfinger C, Hann CE, Chase JG, Desaive T, Ghuysen A, Shaw GM:Model-based cardiac diagnosis of pulmonary
embolism.Comput Methods Programs Biomed2007,87:46–60.
27. Sagawa K:The ventricular pressure-volume diagram revisited.Circ Res1978,43(5):677–87. 28. Suga H:Ventricular energetics.Physiol Rev1990,70(2):247–77.
29. Burkhoff D, Sagawa K:Ventricular efficiency predicted by an analytical model.Regu Physiol1986,
250(6):R1021—7.
30. Broscheit JA, Weidemann F, Strotmann J, Steendijk P, Karle H, Roewer N, Greim CA:Time-varying elastance concept applied to the relation of carotid arterial flow velocity and ventricular area.J Cardiothorac Vasc Anesth2006,20(3):340–6.
31. Suga H:Total mechanical energy of a ventricle model and cardiac oxygen consumption.Heart1979,
236(3):H498–5.
32. Desaive T, Dutron S, Lambermont B, Kolh P, Hann CE, Chase JG, Dauby PC, Ghuysen A:Close-loop model of the cardiovascular system including ventricular interaction and valve dynamics: application to pulmonary embolism.12th Intl Conference on Biomedical Engineering (ICBME). Singapore; 2005.
33. Ghuysen A, Lambermont B, Kolh P, Tchana-Sato V, Magis D, Gerard P, Mommens V, Janssen N, Desaive T, D’Orio V:
Alteration of right ventricular-pulmonary vascular coupling in a porcine model of progressive pressure overloading.Shock2008,29(2):197–204.
34. Lambermont B, Ghuysen A, Kolh P, Tchana-Sato V, Segers P, Gerard P, Morimont P, Magis D, Dogne JM, Masereel B, D’Orio V:Effects of endotoxic shock on right ventricular systolic function and mechanical efficiency. Cardiovasc Res2003,59(2):412–8.
35. Lambermont B, Delanaye P, Dogne JM, Ghuysen A, Janssen N, Dubois B, Desaive T, Kolh P, D’Orio V, Krzesinski JM:
Large-pore membrane hemofiltration increases cytokine clearance and improves right ventricular-vascular coupling during endotoxic shock in pigs.Artif Organs2006,30(7):560–4.
doi:10.1186/1475-925X-11-28
Cite this article as:Stevensonet al.:Algorithmic processing of pressure waveforms to facilitate estimation of cardiac elastance.BioMedical Engineering OnLine201211:28.
Submit your next manuscript to BioMed Central and take full advantage of:
• Convenient online submission
• Thorough peer review
• No space constraints or color figure charges
• Immediate publication on acceptance
• Inclusion in PubMed, CAS, Scopus and Google Scholar
• Research which is freely available for redistribution