World Maritime University
The Maritime Commons: Digital Repository of the World
Maritime University
World Maritime University Dissertations Dissertations
2000
Analysis of customers complaints, 1995-1999, for
the improvement of port services in Mombasa
[Kenya]
Rose Atieno Nyalwal
World Maritime University
Follow this and additional works at:http://commons.wmu.se/all_dissertations
This Dissertation is brought to you courtesy of Maritime Commons. Open Access items may be downloaded for non-commercial, fair use academic purposes. No items may be hosted on another server or web site without express written permission from the World Maritime University. For more Recommended Citation
Nyalwal, Rose Atieno, "Analysis of customers complaints, 1995-1999, for the improvement of port services in Mombasa [Kenya]" (2000).World Maritime University Dissertations. 113.
WORLD MARITIME UNIVERSITY
Malmö, Sweden
ANALYSIS OF CUSTOMERS COMPLAINTS
1995 - 1999
For the improvement of port services in Mombasa
By
ROSE ATIENO NYALWAL
The Republic of KenyaA dissertation submitted to the World Maritime University in partial fulfillment of the requirements for the award of the degree of
MASTER OF SCIENCE
in
PORT MANAGEMENT
2000
DECLARATION
I certify that all the material in this dissertation that is not my own work has been identified, and that no material is included for which a degree has previously been conferred on me.
The contents of this dissertation reflect my own personal views, and are not necessarily endorsed by the University.
………
……….
Supervised by: Dr. Shuo Ma
Course Professor, Port and Shipping Management World Maritime University
Assessor:
Dr. Bernard Francou
Associate Professor, Port Management World Maritime University
Co-assessor: Mr. Jacques Sublet Secretary General
DEDICATION
ACKNOWLEDGEMENTS
The Author is greatly indebted to various individuals and organisations that so kindly guided, provided and contributed data in one way or another, directly or indirectly to make this part of my career development an entire success. To mention but a few, special thanks and heartfelt gratitude go to my employers, the Kenya Ports Authority for supporting my scholarship to study at the World Maritime University, to the retired Captain John Martin Odhach, for the guidance and his encouragement to join this institute of higher learning.
Special thanks also go to the rector, Dr. Karl Laubstein, for availing special funds towards my scholarship, staff and my professors of the World Maritime University, for their contribution to my academic experience at the university. I am also indebted to Dr. Shuo Ma for his guidance, patience and understanding, not only in this work but also through out my 17 months stay at the university and similarly to Dr. Bernard Francou for all the knowledge and expertise he imparted on me. My special thanks also go to Mr Jacques Sublet for accepting to co-assess this paper.
A special acknowledgement of gratitude is also due to the students of port management class of the millennium, particularly Andi and Koko from Indonesia, who have been so helpful and usually so patient for their contribution to the success of this paper.
To the Kenyan students of the World Maritime University, not forgetting our dear Mama Fatuma Jeneby and Mrs. Susan Wangeci Eklow, I say “ASANTE SANA” for their guidance and support during my stay in Malmö.
ABSTRACT
Title of Dissertation: Analysis of customers’ complaints 1995 – 1999
Degree Msc
The dissertation is a study of Mombasa port’s customer relationship with reference to Kenya Port Authority’s corporate direction, the customers perception of KPA’s services and how they can be linked to the port of Mombasa through information control.
A brief look is taken at KPA’s reaction in relation to the public outcry on the decline in traffic, with particular reference to Northern Corridor customers. They are said to have shifted their business interests to the neighbouring ports due, to the deplorable state of facilities and unsatisfactory services impeding the customers from using the port.
A broad range of complaints derived from the port users meetings have been analysed as an attempt to expose the response of KPA’s management towards the problems experienced by the customers using the port. Turn around time, productivity, security, costs and other problems are perceived as the contributing factors affecting the shipping industry in Kenya.
An in-depth analysis has been carried out on the above problems by quantifying them using the cost benefit analysis method, from which proposals have been made for KPA to take measures and rectify the situation.
The concluding chapter offers recommendations for KPA’s way forward, to be considered and implemented at all, levels of the organisation.
KEY WORDS: Competition, Customer focus, Cost benefit, Mombasa port,
TABLE OF CONTENTS
Declaration ii
Acknowledgements iii
Abstract iv
Table of Contents v
List of Tables ix
List of Figures x
List of Abbreviations xi
1. Introduction 1
1.1 General overview 1
1.2 Aim and scope of study 2
1.3 Methodology 4
2. Current developments of Mombasa port 5
2.1 Introduction 5
2.2 Kenya Ports Authority’s marketing strategy 5
2.2.1 Port users’ meetings 5
2.2.2 The impact of symposiums 6
2.2.3 KPA’s liaison office 8
2.2.4 KPA’s Objectives 9
2.3 Challenges that face the port of Mombasa 10
2.3.1 Position of Mombasa and Dar es Salaam ports 11
2.4 Port throughput 11
2.4.1 Dry cargo traffic 12
2.4.2 Container traffic 14
2.4.3 Transit traffic 15
2.5 Operational constraints 19
2.6 Conclusion 19
3. Identification of the problems 20
3.1 Introduction 20
3.2 Classification of the problems 20
3.2.1 Problem Group 1: Turn around time 20
3.2.1.2 Undocumented containers 22
3.2.1.3 Lack of storage space 23
3.2.1.4 Pier to pier operations 23
3.2.1.5 Railing of containers 23
3.2.2 Problem Group 2: Productivity 24
3.2.2.1 Equipment availability and efficiency 25
3.2.2.2 Labour productivity 28
3.2.2.3 Berthing delays 29
3.2.3 Problem Group 3: Security 29
3.2.4 Problem Group 4: Cost 30
3.2.4.1 Port charges 31
3.2.4.2 Terminal handling charges 32
3.2.4.3 KRC Tariff rates 32
3.2.4.4 KRA Tariff rates 32
3.2.5 Problem Group 5: Others 32
3.2.5.1 Telephone services 33
3.2.5.2 Treatment of cruise ship passengers 33
3.3 Conclusion 33
4. Critical Analysis of the problems 34
4.1 Introduction 34
4.2 Evolution of the problems 34
4.2.1 Analysis for 1995 meeting 35
4.2.2 Analysis for 1996 meeting 36
4.2.3 Analysis for 1997.meeting 38
4.2.4 Analysis for 1998 meeting 39
4.2.5 Analysis for 1999 meeting 40
4.3 Composition of the problems 43
4.3.1 Turn around time 44
4.3.2 Productivity 45
4.3.3 Security 46
4.3.4 Cost 48
4.3.5 Others 48
4.4 Persistence of the problems 49
4.4.1 Turn around time 49
4.4.2 Productivity 51
4.4.3 Security 52
4.4.4 Cost 53
4.4.5 Others 54
4.5 Consequences of the problems 55
4.5.2 Loss of Uganda cargo 55
4.5.3 Loss of customers 56
4.5.4 Decline in trade 56
4.5.5 Poor services 56
4.6 Summary and conclusion 56
5. Cost benefit analysis 58
5.1 Introduction 58
5.2 Measures 58
5.2.1 Turn around time 58
5.2.2 Productivity 59
5.2.3 Security 60
5.2.4 Costs 60
5.2.5 Others 60
5.3 Strategy 62
5.3.1 Implementation of customer relationship management 63
5.3.1.1 Turn around time 65
5.3.1.2 Productivity 67
5.3.1.3 Security 68
5.3.1.4 Cost 68
5.3.1.5 Others 69
5.3.2 CRM analysis 69
5.3.2.1 Human behavior 72
5.3.2.2 Benefits 72
5.4 Establish joint operating companies 73
5.5 Conclusion 74
6. Conclusion 75
6.1 Results 75
6.1.1 Turn around time 76
6.1.2 Productivity 76
6.1.3 Security 76
6.1.4 Cost 76
6.1.5 Others 77
6.2 Recommendations 77
6.2.1 Objective 77
6.2.2 Resources required 77
6.2.3 Short term 78
6.2.4 Medium – long term 79
References 81
Appendices
Appendix A Horn of Africa 86
Appendix B Mombasa container terminal berthing delays 87
Appendix C Minutes of port users meetings 88
89
Appendix D The composition of customers problems 90
Appendix E The composition of the complainants 91
Appendix F The persistence of the problems 92
Appendix G Major customers in Uganda 93
Appendix H ICD Kisumu potential importers 94
Appendix J ICD Kisumu potential exporters 95
LIST OF TABLES
Table 1. Dry cargo traffic – port of Mombasa 12
Table 2. Dry cargo traffic – port of Dar es Salaam 13
Table 3. Container traffic – port of Mombasa 14
Table 4. Container traffic – port of Dar es Salaam 15
Table 5. Transit traffic – port of Mombasa 16
Table 6. Transit traffic – port of Dar es Salaam 18
Table 7. Problems pertaining to turn around time 21
Table 8. Comparison of transit time 24
Table 9. Problems pertaining to productivity 24
Table 10. Mechanical and electrical engineering sections 25
Table 11. Handling appliances 27
Table 12. Problems pertaining to security 29
Table 13. Problems pertaining to cost 30
Table 14. Problems pertaining to others 33
Table 15. Members of port users meetings 44
Table 16. Comparison of ships’ turn around time 65
LIST OF FIGURES
Figure 1. Dry cargo traffic – Mombasa port 12
Figure 2. Dry cargo traffic – Dar es Salaam port 13
Figure 3. Container traffic – Mombasa port 14
Figure 4. Container traffic – Dar es Salaam port 15
Figure 5. Transit traffic – Mombasa port 17
Figure 6. Transit traffic – Dar es Salaam port 17
Figure 7. Average container movements per shift 27
Figure 8. Comparative container charges 31
Figure 9. The Evolution of the Composition of the problems in percentage 35
Figure 10. The participants for problems related to turn around time 44
Figure 11. The participants for problems related to productivity 46
Figure 12. The participants for problems related to security 47
Figure 13. The participants for problems related to cost 48
Figure 14. The participants for problems related to others 49
Figure 15. Persistence of problems related to turn around time 50
Figure 16. Persistence of problems related to productivity 51
Figure 17. Persistence of problems related to security 52
Figure 18. Persistence of problems related to cost 53
Figure 19. Persistence of problems related to others 55
Figure 20. Unctad’s growth package 61
Figure 21. Terminal operating management system 64
Figure 22. ICD Kisumu importers 70
LIST OF ABBREVIATIONS
ASK Agriculture Society of Kenya
CIF Cost Insurance and Freight
CMT Consultative Meeting of Transit Traffic
COs’ Companies
CRM Customer Relationship Management
DPA Dubai Ports Authority
EDI Electronic Data Interchange
ICD Inland Container Depot
IT Information technology
JMTF Joint Marketing Task Force
KEPHIS Kenya Plant Health Inspectorate Service
KFA Kenya International Freight and Warehousing Association
KPA Kenya Ports Authority
KPP Kenya Port Police
KRA Kenya Revenue Authority
KRC Kenya Railways Corporation
KSA Kenya Ships Agents Association
NTTFC National Trade and Transport Facilitation Committee
RTG Rail tyred gantry
SSG Ship to shore gantry
SWIPCO Swiss Procurement Company
TEUS Twenty feet equivalent units
THC Terminal Handling Charges
TRC Tanzania Railway Corporation
UNCTAD United Nations Conference on Trade and Development
URA Uganda Revenue Authority
URC Uganda Railways Corporation
CHAPTER 1
INTRODUCTION
1.1 General overview
The time where ports could sit down and wait for cargo is long gone. Transformation in the shipping industry has had a tremendous impact on ports worldwide. Today's ports are market-oriented ports, and the market decides their future. Ports are confronted with challenges, as the market demands quality delivery of services at competitive prices.
Marketing of ports is something new which has changed the technological structure of the port industry to a competitive economic environment. Ports are no longer administrative, but commercial entities and must prove to be financially viable. The regional market is changing so fast due to the economic globalisation. The networking approach is vital for market oriented ports since the traditional port to port routes have been replaced by networking of routes, where different trade routes intersect and interconnect they have to look for trade routes and not only the shipping lines. Ports are under immense pressure from their customers' needs and desires to respond with expensive expansion and development projects. Villalon (1998,82) says, " the focus should be on the needs of customers - terminal and warehouse operators, carriers and tenants, as well as importers and exporters who may dictate the routing of cargo through specific routes."
dormant in many ports. Therefore, it is essential not only for ports to acknowledge the basic name and address of their customers but to know how important the individual customer is to their business and the possibility of the same customer conducting business with other competitors instead. Majority of ports have the tendency to believe that customers always want one solution such as low prices while from the customer's point of view they are more interested in flexibility.
In this aspect, the current global trend in international trade and transport envisages port managers to assume the role of customers and determine ways and means of overcoming their difficulties. For instance, the flexibility of the port in assisting problems pertaining to immigration or custom authorities.
1.2 Aim and scope of the study
This paper is designed with a focus to carry out an analysis of preparing a marketing mechanism and commercial strategy, as a solution to the future development of Kenya Ports Authority. This analysis goes in parallel with a practical study of complaints derived from the minutes of port users meetings held in Mombasa. The high rate of complaints from customers calls for a more systematic way of addressing the delivery of service. The paper is organised in three sections covered over four main chapters.
The first section is about the current developments of Mombasa port with particular reference to its concern on the decline in transit traffic. The aim is to study the marketing strategy adopted by the port community to convince customers on the improved services. The analysis on the port will be carried out to determine the performance in terms of cargo throughput for both Mombasa and Dar es Salaam ports and the cause of customers shifting to neighbouring ports.
The second section is divided into two parts. Chapter 3 being the first part identifies the problems derived from the port users meetings to be studied throughout the analysis. The problems are classified and grouped into 5 major groups.
Chapter 4 being the second part, is to carry out an in depth analysis of the problems to determine the evolution of the problems over a period of time. The composition of the complainants is equally important in the sense that customers do not only complain on KPA's inefficiency but other state corporations are affected too. The analysis on persistence determines KPA's effectiveness in solving the problems.
Chapter 6 is to draw conclusions and make recommendations to overcome the current problems facing the customers.
The success of KPA to stand a chance of being a market oriented port is not only dependent on its efficiency, but requires a marketing strategy that will recognise long term relationships with customers and earn them customer ownership. Further more, it will enable KPA to learn its customers in a more consistent manner and provide them with a made to measure service with fast turn around time, reduced costs and a friendly and reliable distribution centre.
1.3 Methodology
CHAPTER 2
CURRENT DEVELOPMENTS OF MOMBASA PORT
2.1 Introduction
The aim of the present chapter is the study of KPA's market strategy used in meeting the customers ever changing demands with particular reference to Northern Corridor. Analysis of the performance for Mombasa and Dar es Salaam ports will be carried out to determine the cause of shifting to neighbouring ports.
2.2 Kenya Ports Authority’s marketing strategy
KPA does not have a well-defined marketing strategy but it ensures customer care services by co-ordinating its activities on a daily basis in liaison with the port users.
2.2.1 Port users’ meetings
depots chaired by the manager in charge of the depots, with the objective to strengthen the relationship and harmonise co-operation between the port and its users. The meetings also serve as familiarisation sessions in those problems experienced by shipping lines; shippers and potential customers are also discussed.
The newly instituted consultative meeting at the port is on a monthly basis for all stakeholders, to help iron out difficulties associated with the movement of transit cargo along the northern corridor. This meeting has been initiated following persistent complaints from the port users who have now turned to the Tanzanian port citing inefficiency, red tape, corruption and dilapidated infrastructure at Mombasa in particular, Uganda coffee exporters and some major cargo handling companies. As at December 1999, four consecutive consultative monthly meetings had taken place.
The consultative group includes senior officers from Kenya Ports Authority, Kenya Railways Corporation, Uganda Railways Corporation, Kenya Revenue Authority, Uganda Revenue Authority, Uganda Clearing and Forwarding Association, Kenya International Freight and Forwarding Association, Kenya Shipping Agency, permanent Secretariat of the Transit Transport and Kenya Police under the chairmanship of Commissioner General of Kenya Revenue Authority. Issues raised in this meeting assume the priority they deserve and have been addressed with all the keenness. The meeting takes place either in the morning or afternoon for approximately 4 hours.
2.2.2 The impact of symposiums
brings together the five principle users of the port of Mombasa namely Kenya, Uganda, Rwanda, Burundi and the Democratic Republic of Congo.
The symposium was also attended by the following participants as illustrated below: • The ministers, permanent secretaries and other relevant senior government officials
in the Ministries of Transport, Public Works and Trade, as well as other relevant state institutions in the five member states;
• Senior officials from the offices of the revenue authorities in the member States; • Senior officials from the security agents such as police and the Central Investigation
Department;
• Senior executives from the Railway administrations; • Senior managers from the Association of Road Transport; • Senior managers from clearing and forwarding agencies;
• Senior managers from insurance and banking institutions providing financial services to transit transport operators;
• Senior managers from relevant export and import companies;
• Senior managers from international shipping agencies including other related agencies involved in the control of export and import companies;
• Senior managers from public information agencies and companies;
• Senior representatives from relevant United Nations agencies and other relevant international and regional organisation.
Basic technical reports were presented to facilitate the deliberations of the symposium covering the following aspects:
• An overview of the current transit transport situation in the sub region;
• Customs transit procedures and regulations;
• Rail transit traffic and road transit traffic including the enforcement of axle load limits.
The symposium was a unique opportunity to attract all stake holders from the public and private sectors involved in activities that are directly or indirectly relevant to the development of the transit traffic operations along the Northern Corridor. It fostered regional co-operation and also provided a forum for the stakeholders to express their views and explain their problems to the decision-makers.
2.2.3 KPA's liaison office
KPA has extended its services by establishing a liaison office in Kampala to cater for Uganda and the Great Lakes region market. An interview with KPA's resident representative based in Kampala, Mboya, I (1999, December) revealed the following: The office opened its doors on the 1st December 1996, and was officially commissioned on the 8th October 1997. Since its inception, the Kampala office has done a great deal in updating port users on latest developments at the port, for example on information about the discharging and loading vessels and dates of arrivals. The office serves as a functional arm of the port users and can always be reached within 24 hours. Claims can now be lodged through this office unlike in the past, when follow up of claims proved to be difficult due to lack and flow of information and communication. Previously, customers had experienced problems for paying for charges that are not related to KPA by various stakeholders, but through this office, they are now conversant with export/import shipping procedures and the port tariffs that are currently on concession.
helped to boost trade by participating in the annual Uganda International Trade Fare. He adds that the office has helped in updating customers on what steps Kenya Ports Authority has taken to improve efficiency at the port, particularly at this time with a lot of speculation on loss of traffic to Dar es salaam. Consultative meetings are held in conjunction with the Kenya Railways, Uganda Railways, shipping representatives and forwarding agents to chart out the strategies on where improvements can be done to match the port users demands. The office also works in close liaison with Kenya’s commercial attaché to Uganda in promoting business between Kenya and Uganda, which has proved beneficial to the business community using the port of Mombasa. The office has also harmonised the complaints, which were initially being channelled to the High Commissioner.
The authority has intentions to establish other liaison offices in Kigali and Bujumbura to educate shippers in cargo documentation and port operations, in an effort to promote regional economic co-operation and integration.
2.2.4 KPA's Objectives.
2.3 Challenges that face the port of Mombasa.
Kenya Ports Authority starts the 21st century with major challenges ahead of it, the toughest being marketing to attract more business through the port and keep the existing traffic too. One of the major challenges facing KPA is the port’s performance levels and its productivity as it has a rated capacity to handle 22 million tonnes per year.
Francou (2000) of the World Maritime University provides information that,
In order to improve the port performance and to cope with the quick development of the shipping industry, there is need to identify indicators to measure how the port operations can be done better. 2/3 of the total maritime cost happen in the ports, mainly wharfage, handling and storage operations hence the port should be a low cost provider by reducing its operational costs. Turn around time should be short in terms of total cost per tonne handled.
Although KPA envisages the possibility of being a world class landlord port handling a minimum of 9.8 million tonnes by the year 2000, its present utilisation is still low at 45%.
2.3.1 Position of Mombasa and Dar es Salaam ports.
Mombasa and Dar es Salaam ports are situated in East Africa along the Indian Ocean. (See map attached in appendix A). For a while the two ports have been resistant to change but today the environment in these ports seems to have changed due to globalisation. Almazan & Mundy (2000) comments on the landmark decision by the port of Dar es Salaam to lease its container terminal on concession to a Manila-based International Container Terminal Services in conjunction with its Tanzanian partner, Vertex Financial Services for a period of 10 years. Prior, to this the two ports have experienced similar operational problems such as cumbersome documentation procedures, backlog of boxes not cleared hence constant congestion at the terminals, and ships not calling the ports directly. Critchton, (1999,41) confirms that, " CMBT which used to run a multipurpose North Europe/East Africa service abandoned it due to poor port conditions in East Africa. Instead, it offered a service to Dar es Salaam via Durban, pre-carrying on Europe/South Africa ships". Turn around time is between 4 to 5 days compared to the standard time in other ports, which is 2 days. The two ports are not fully automated apart from having had new computerised billing systems installed in the revenue departments respectively. However, comparison of the two ports is not the best scenario to assess the current situation at the port of Mombasa. KPA's main concern should be concentrated on the decline of traffic with particular reference to transit traffic.
2.4 Port throughput.
2.4.1 Dry cargo traffic.
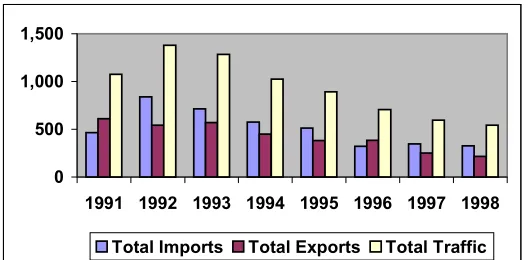
Tables 1 and 2 illustrate the dry cargo traffic through the ports of Mombasa and Dar es Salaam respectively. The total throughput of Mombasa port rose from 7.10 million tons in 1991 to 8.46 million tons in 1998. The highest recorded throughput was in 1996 with a record of 8.58 million tons with an average throughput of 8.05 million tons. The port operations have been dominated by imports with an average share for the period of 73 % while 30 % of the imports is comprised of transit traffic.
Table 1. Dry cargo traffic - port of Mombasa ('000 Tonnes).
1991 1992 1993 1994 1995 1996 1997 1998
Imports 5040 4827 4288 5182 4259 3700 5454 5648
Exports 1535 1854 2503 1391 1722 2041 1461 1680
Transit 528 1210 1131 1706 1938 2835 1344 1127
Total traffic 7103 7891 7922 8279 7919 8576 8259 8455 % change of total traffic 0 11 0 5 -4 8 -4 2
Source: Annual Bulletin of Port Statistics 1998
Figure 1. Dry cargo traffic - Mombasa port 0
2000 4000 6000 8000 10000
1991 1992 1993 1994 1995 1996 1997 1998
Table 2. Dry cargo traffic-port of Dar es Salaam ('000 Tonnes).
1991 1992 1993 1994 1995 1996 1997 1998
Imports 564 678 855 795 836 645 947 901
Exports 266 289 314 252 357 311 294 315
Transit 1075 1379 1284 1024 891 706 596 541
Total traffic 1905 2346 2453 2071 2084 1662 1837 1757 % change of total traffic 0 23 5 -16 1 -20 11 -4
Source: Tanzania Harbours Authority Annual Report, 1998
During the same period, the port of Dar es Salaam recorded the highest throughput of 2.45 million tons in 1993 with an average throughput of 2.02 million tons. The volume is also dominated by imports with an average share for the period of 64 % while 120 % of the imports is comprised of transit traffic.
Figure 2. Dry cargo traffic - Dar es Salaam port
0 500 1000 1500 2000 2500 3000
1991 1992 1993 1994 1995 1996 1997 1998
2.4.2 Container traffic
The port of Mombasa is the main container port in the region serving the landlocked countries of Uganda, Rwanda, Burundi and the Democratic Republic of Congo as well as Kenya itself. Container traffic rose from 135,540 twenty feet equivalent units (TEUS) in 1991 to 248,451 by 1998 indicating a growth rate of 8.13 %. The increase in box throughput has been attributed to containerisation of general cargo as illustrated in table 3.
Table 3. Container traffic-port of Mombasa (TEUS).
1991 1992 1993 1994 1995 1996 1997 1998
Full 107584 107645 112646 126633 153748 165752 172742 183989
Empty 27956 27679 31491 33660 46789 51276 57956 64462
Total traffic 135540 135324 144137 160293 200537 217028 230698 248451 % change of total traffic 0 0 7 11 25 8 6 8
Source: Annual Bulletin of Port Statistics 1998.
Figure 3. Container traffic – Mombasa port
0 50000 100000 150000 200000 250000 300000
The port of Dar es Salaam also shares the same hinterland as the port of Mombasa. Table 4 illustrates between 1991 and 1998 the port recorded a growth rate of 4.88 %. The share of empty containers to the total traffic is relatively high. The average in both ports had a record of 23 % and 22 % respectively, the latter being Dar es Salaam port. This scenario indicates the imbalance of trade.
Table 4.Container traffic- port of Dar es Salaam (TEUS).
1991 1992 1993 1994 1995 1996 1997 1998
Full 60832 67963 74327 75407 73082 69382 71198 83916
Empty 15564 18892 23466 20480 21027 24246 27472 26426
Total traffic 76396 86855 97793 95887 94109 93628 98670 110342
% change 0 14 13 -2 -2 -1 5 12
Source: Tanzania Harbours Authority Annual Report, 19
Figure 4. Container traffic – Dar es Salaam port.
2.4.3 Transit traffic
Today, transit traffic is of major concern to the port of Mombasa. About 18.3 % of Mombasa's traffic comprises of transit cargo with Uganda accounting for 50 %, Burundi is 1.5 %, Rwanda is 17.5 % and D.R. of Congo is 9.4 % of the transit traffic. As illustrated in table 5 the highest recorded throughput of 2.83 million tons was in 1996 the with a share contribution of 33 % of the total cargo throughput. However, since
0 20000 40000 60000 80000 100000 120000
1996 share of transit traffic has considerably dropped to 16.2 % in 1997 and 13.3 % in 1998 respectively. The port of Mombasa is speculated to have lost a substantial amount of this trade to the port of Dar es Salaam.
Table 5. Transit traffic - port of Mombasa (‘000 Tonnes).
Particulars 1991 1992 1993 1994 1995 1996 1997 1998 Uganda Imports 154 321 336 711 910 962 595 651
Exports 149 146 146 205 146 250 277 191
Total 303 467 482 916 1056 1212 872 842 Tanzania Imports 16 10 17 134 76 344 65 41
Exports 2 5 7 9 16 19 24 17
Total 18 15 24 143 92 363 89 58 Burundi Imports 11 33 18 35 45 12 0 1
Exports 2 9 3 1 3 0 0 0
Total 13 42 21 36 48 12 0 1
Rwanda Imports 54 77 56 169 475 770 155 83
Exports 48 37 68 9 19 26 12 11
Total 102 114 124 178 494 796 167 94 Sudan Imports 2 35 36 70 26 11 20 52
Exports 0 0 0 0 0 1 0 0
Total 2 35 36 70 26 12 20 52
D.R. Congo Imports 14 80 44 226 116 259 94 43
Exports 56 31 34 34 27 25 12 17
Total 70 111 78 260 143 284 106 60 Others Imports 20 426 347 93 78 144 44 18
Exports 0 0 19 10 1 12 46 2
Total 20 426 366 103 79 156 90 20 Total Imports 271 982 854 1438 1726 2502 973 889
Total Exports 257 228 277 268 212 333 371 238
Total Traffic 528 1210 1131 1706 1938 2835 1344 1127
%change total traffic 0 129 -7 51 14 46 -53 -16
Figure 5. Transit traffic – Mombasa port
At Dar es salaam, between 1991 and 1998 transit cargo was 7.50 million tons, which accounted for 46.5 % of its total throughput. Uganda accounts for 5.1 %, Burundi is 13 %, Rwanda is 9.7 % and D.R. of Congo is 11.7 % of the transit traffic. From figure and table 6 there is an indication that since 1991 to 1994 the share contribution was above 50 % but declined thereafter to 31 % as recorded in 1998.
Figure 6. Transit traffic – Dar es Salaam port
0 1000 2000 3000
1991 1992 1993 1994 1995 1996 1997 1998
Total Imports Total Exports Total Traffic
0 500 1,000 1,500
Table 6. Transit traffic- port of Dar es Salaam (‘000 Tonnes).
Particulars 1991 1992 1993 1994 1995 1996 1997 1998 Uganda Imports 12 3 3 13 51 30 63 40
Exports 32 14 14 32 5 42 21 12
Total 44 17 17 45 56 72 84 52 Burundi Imports 103 77 121 212 134 46 32 31
Exports 41 47 42 37 38 19 0 0
Total 144 124 163 249 172 65 32 31 Rwanda Imports 47 46 159 99 97 92 103 52
Exports 0 0 0 1 6 12 5 9
Total 47 46 159 100 103 104 108 61 D.R. Congo Imports 46 33 47 49 98 60 65 60
Exports 100 61 89 23 27 93 21 3
Total 146 94 136 72 125 153 86 63 Kenya Imports 0 0 0 1 0 0 2 0
Others Imports 256 679 383 201 131 92 81.00 143 Exports 438 419 426 356 304 220 203.00 191
Total 694 1098 809 557 435 312 284 334 Total Imports 464 838 713 575 511 320 346 326
Total Exports 611 541 571 449 380 386 250 215
Total traffic 1,075 1,379 1,284 1,024 891 706 596 541 % of total traffic 0 28 -7 -20 -13 -21 -16 -9
Source: Tanzania Harbours Authority Annual Report, 1998
extreme bad weather in 1998, which affected the agricultural exports, was felt. Tanzania also suffered from similar economic crisis
2.5 Operational constraints
According to the United Nations Conference on Trade and Development (UNCTAD) (1995, p.5) survey, “when it comes to problems experienced by the port users, the infrastructure and the cargo handling equipment are often the prime elements considered to be at fault. If ports have the right infrastructure and necessary equipment, the cause of the problems may be the lack of appropriate management or of modern management know how.” However, KPA has continually upgraded its facilities, acquired more equipment and rehabilitated the old ones to handle cargo more efficiently and effectively. The same sentiments are also shared in the article, Sudan, Uganda peace deal a boon for port (2000), Mudavadi, the Kenyan Minister for Information, Transport and Communication says that, “no effort should be spared to ensure that the port infrastructure and operations remain at a leading pace in order to continue attracting the business of the sub region.”
2.6 Conclusion
CHAPTER 3
IDENTIFICATION OF THE PROBLEMS
3.1 Introduction
The main objective of this chapter, is to identify the problems derived from the port users meeting covering the period from May 1995 to November 1999 as illustrated in Appendix C. The classification of these problems is vital for the purpose of the analysis to be studied in the next chapter.
3.2 Classification of the problems
These problems are classified and grouped in 5 major groups as will be seen later in the chapter. On going through Appendix C, one will note that not all problems originate from KPA despite the hue and cry common among many port users. There are also problems related to Kenya Railways Corporation, Kenya Revenue Authority and Kenya Police etc. The problems have again been divided into 5 major groups as illustrated by the following tables:
3.2.1 Problem Group 1: Turn around time
Table 7. Problems pertaining to turn around time.
Code Problem Code Problem
UC Undocumented containers SD Stripping delays
RL Railing of containers LS Lack of storage space
DP Documentation procedures TC Tracing containers
OD Operational documents
Source: Appendix C
3.2.1.1 Port procedures and documentation.
In any port environment, the movement of ships and cargoes involve a number of procedures, each involving a number of actors. Most of the procedures involve commercial relationships, administrative functions and government institutions that are outside the scope of the port authority. Due to the financial and legal liabilities involved, 99% of port procedures require documents of some kind. The use of different documents required by the port procedures, means that more time is spent sometimes inside or outside the port community to prepare them, which frequently consists of copying information from one document to another to present it in a different way.
KPA lacks a proper system of handling claims, or rather complicates issues when it comes to compensating the port users. Under normal circumstances, claims will be repudiated due to the delays encountered by the shipper to obtain the out turn reports, motor vehicle inspection reports and short landing certificates. Apparently in the article,
Sh40m cost of port cargo theft (1999), it is believed that KPA pays large sums of money
as compensation for lost goods. The documentation crisis at the port has eased up lately as a result of the new computerised billing system. However, the new system is expected to eradicate the problems but the port users still have to go through many repetitive checks and reconciliation on documents, as well as physical verification before the actual release of cargo to the consignee. Unlike the Southern Corridor, the requirement by KRA for shippers to execute a customs bond on transit traffic is also a bottleneck that increases the cost of transiting through the Northern Corridor. The working hours are not harmonised in such a way that the three teams, KPA, KRA and KPP can work together. A typical example for documentation procedures for transit cargo (Northern corridor) passing through the Mombasa port requires at least 25 different steps with an impressive volume of stamps and numbers affixed on documents. As mentioned earlier the impact of the whole system results in the wastage of time and resources, and reduces the competitiveness of the port.
3.2.1.2 Undocumented containers
3.2.1.3 Lack of storage space
The port is congested as a result of back log of undelivered cargo that builds up, when the rate at which the cargo is discharged from ships into the port area is higher than the rate which the cargo is delivered out. The customs officers have not been able to perform as expected, due to the limited space in the working areas and open storage. Mechanical equipment moving cargo between ship's side and storage on land cannot move freely, turn round is slowed and the discharge of ships is affected, the chance of landed cargo being over stored, and possibly damaged is increased.
3.2.1.4 Pier to pier operations
The above operations are related to the stripping or stuffing of containers, and are carried out in an open area. Some of the delays encountered such as the rains are beyond KPA's control. The delays are normally caused by lack of stripping tallies.
3.2.1.5 Railing of containers
Table 8. Comparison of transit time
Port of Mombasa Port of Dar es Salaam Number of days Number of days Long room processing (KRA) 5 The meeting was KPA Revenue office (KPA) 2 informed that the time Verification (KRA & KPA) 4 it took transit cargo to Loading (KPA & KRC) 3 be cleared at
Mombasa - Malaba (KRC) 3 Dar es Salaam and Delays in Malaba (KRA&KRC) 3 transported by rail Delays in Tororo (URC) 3 to Kampala averaged Tororo - Kampala (URC) 2 fifteen (15) days
TOTAL NUMBER OF DAYS 28 DAYS 15 DAYS
Source: Minutes of Consultative Meeting 1999.
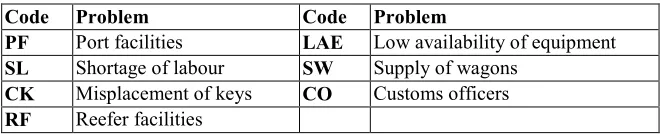
3.2.2 Problem Group 2: Productivity
Table 9. Problems pertaining to productivity
Code Problem Code Problem
PF Port facilities LAE Low availability of equipment SL Shortage of labour SW Supply of wagons
CK Misplacement of keys CO Customs officers RF Reefer facilities
Source: Appendix C
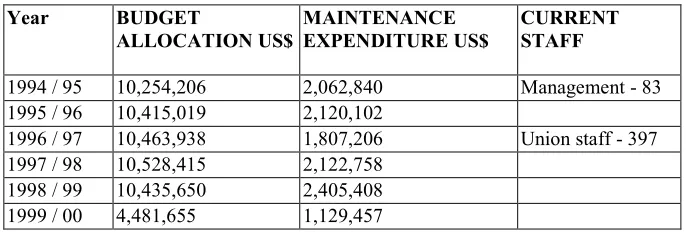
Corporation recommends that the cost of maintenance should not exceed 3 % of the budgeted volume of business.
Table 10. Mechanical and electrical engineering sections.
Year BUDGET
ALLOCATION US$ MAINTENANCEEXPENDITURE US$ CURRENTSTAFF
1994 / 95 10,254,206 2,062,840 Management - 83 1995 / 96 10,415,019 2,120,102
1996 / 97 10,463,938 1,807,206 Union staff - 397 1997 / 98 10,528,415 2,122,758
1998 / 99 10,435,650 2,405,408 1999 / 00 4,481,655 1,129,457
Source: Port Annual Budget Bulletin 1999.
3.2.2.1 Equipment availability and efficiency
KPA has an old inventory of equipment, whose performance has been low on account of age. Table 11 illustrates the position of the handling appliances/equipment with an exception of four reach stackers acquired in early 1999. 3 ship to shore gantry cranes (SSGs) were delivered in December 1982 and commissioned in January 1983, 1 SSG was assembled in Mombasa in 1990 and 7 rail tyred gantry cranes (RTGs) were bought in 1985 respectively. However, the personal assistant to the Managing Director, Ndua (1999 December) comments that the 4 SSGs have never been in service simultaneously. He further confirms the lack of maintenance resulting to poor availability levels: 46 % for RTGs against a target of 65 % and 65 % for SSGs against expected 90 %. One way to reduce time in port is to increase the quantity and quality of port equipment that is available to work a vessel simultaneously. The overall efficiency of the port has adversely been affected due the repetitive occurrence of equipment break down.
Lack of spare parts is a major stumbling block to the maintenance of the old equipment. The ones whose spare parts are available also delay in being serviced due to lengthy tendering procedures for maintenance contracts. This situation increases the equipment’s down time leading to vessel delays and longer cargo dwell time of which have occasionally degenerated in port congestion.
He continues to say that,
KPA’s inventory is unable to cope with the demand for general cargo handling operations such as shore handling, transfer of cargo from quays to warehouses and yards as well as within yards and delivery onto trucks and rail wagons. The old SSG cranes have been one of the major drawbacks on productivity at the container terminal. The poor conditions of the equipment have occasionally compelled the users of the northern corridor to pay for delay surcharges imposed by the shipping industry. Despite the agreement on productivity guarantee between KPA and the shipping lines on the performance of SSG’s, there has never been a record of more than 200 moves per day with an exception of the month of March 1998, with a record of 150 to 170 moves per day.
Table 11. Handling appliances
(a) Container Terminal
No. Type of Appliances Capacity
4 ship-to-shore gantry cranes 40 tonnes 11 rubber tyred gantry cranes 40 tonnes 2 rail mounted gantry cranes 40 tonnes
7 toploaders 40 tonnes
3 Prime movers - PPMs 40 tonnes
64 Tugmasters and 6 shunters (b) General Cargo Berths
53 Portal electrical travelling cranes 3-20 tonnes 9 portal electrical fixed cranes 2-5 tonnes 19 electrical fixed cranes 1-15 tonnes
43 mobile cranes 5-40 tonnes
3 multi-purpose forklift trucks 40 tonnes 2 overhead belt conveyors for bulk soda ash 110 tonnes/hr
Source: Annual Bulletin of Port Statistics 1998
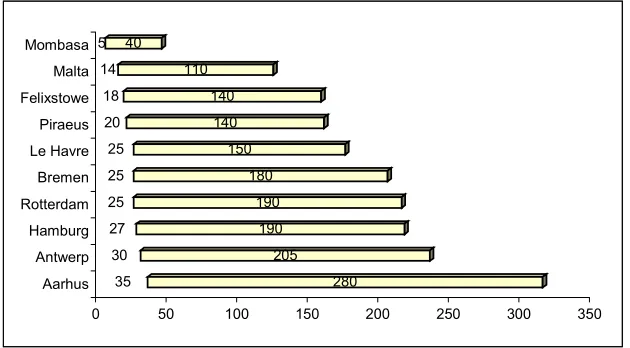
The current performance of Mombasa port in comparison to other ports in Europe in 1991 except for the port of Aarhus, as illustrated in figure 7 is an indication of poor productivity due to lack of maintenance. The current performance of the port of Aarhus has enabled it attain the 2nd position in the Scandinavian region.
Figure 7. Average container movements per gantry per shift. Source: Marconsult SpA, Genoa as given in Hinterland 16 (1), 1994, 9.
35 280 30 205 27 190 25 190 25 180 25 150 20 140 18 140 14 110 5 40
3.2.2.2 Labour productivity
Despite the cash incentives and bonuses paid only to operations and technical staff, as motivation to achieve higher productivity, KPA's average performance is only 23.43 tonnes a day. However, Horck, (2000) of the World Maritime University emphasises on UNCTAD's recommended productivity of 640 tonnes a day that cannot be compared to KPA’S performance. The poor relationship between the stevedores and management staff has seriously affected KPA's productivity.
The system does not adequately reward hard work, for instance the staff processing the documents in the Revenue section. No actions are taken on staff neither for non-performance nor to enforce accountability. The issue of staff misplacing car keys causing delays is a clear indication of poor supervision and laxity in KPA staff.
The situation at Kenya Railways is no better either. Lack of discipline in KRA staff has been observed. The article, New Steps Boost KR Cargo Business (2000) the former Kenya Railways Managing Director, Nyamunga, E, says that, "during the days of monopoly, we became relaxed as we waited for customers to come to us instead of approaching them. Because of the laxity they never bothered to repair wagons and containers." Delays have also been caused at Malaba for Kampala bound train services due to frequent absence of KRC personnel from their place of work.
3.2.2.3 Berthing delays
In the last two years, vessels calling at the Mombasa container terminal have incurred heavy losses due to delays encountered, following the rehabilitation of the container yard and reconstruction of the two berths (Nos16 and 17). There was also repair work of the fenders at berth No 18 which is too small for most vessels that call at the port. The ships operations were constrained due to the civil works at the container terminal. Container vessels were then allocated to conventional berths (Nos13 and 14) which have no proper quay side and back up equipment for container operations. The average waiting time for a berth of a container ship during December 1997 was 60 hours as illustrated in Appendix B.
3.2.3 Problem Group 3: Security
Security for cargo at the port of Mombasa has been a major challenge. Millions of shillings worth of cargo has been reported stolen from the port every year despite the presence of a fully-fledged police division.
Table 12. Problems pertaining to security.
Code Problem Code Problem
RC Rail borne cargo SDC Security on dual carriage PS Port security PE Police escort
EC Excessive checks
Source: Appendix C
One of the key contributory factors to the increase of cargo theft is the introduction of strict measures by the government to curb diversion of transit goods from the port. The syndicate has now resorted to out right theft of cargo from the port hence potential port users particularly Ugandan businessmen are discouraged and have lost confidence in the port services. The security of transit cargo in the port is one of the areas where the stakeholders have called for changes. The following weaknesses have been observed as the main causes of this situation:
• Inappropriate handling causing damage to cargo;
• Verification of containers exposing their content and leading to identifications and targeting high value cargo;
• Inadequate stevedores to handle cargo out of vessels leading to overtime work under lower security conditions;
• Cumbersome procedures delaying cargo within the port and creating congested areas (trucks delivering cargo out of the port) at the exit gates;
• Laxity in port security personnel resulting in a lot of unauthorised persons entering the port.
• Delays on the movement of transit cargo to the border points were caused due to laxity Kenya police force.
3.2.4 Problem Group 4: Cost
Table 13. Problems pertaining to cost.
Code Problem Code Problem
PC Penalty charges KL Kenya Plant Health Inspectorate Service Levy
ANT Application of new tariff THC Terminal handling charges CSD Cost of shipping documents COC Customs overtime costs RT Rail Tariff
3.2.4.1 Port charges
An expensive port is a port offering a poor quality of services, and not necessarily high tariffs. The charges in the port of Mombasa are determined by the 1995 tariff, based more closely on the services provided by KPA and less on the value of cargo being moved. The port users experience difficulties in interpreting the tariff which is denominated in United States dollar (US$) while, the port charges are actually paid in Kenya shillings. As Figure 8 illustrates, KPA's container tariffs are relatively high in comparison to other ports around the world. However, the port users have no option but to comply with the tariff rates due to the monopolistic position of KPA. In most cases the shippers pass on these costs to the customers, as they are more concerned about the port in delivering their goods quickly, rather than cost.
Figure 8. Comparative Container Charges1
1 Report done by Hickling Corporation in association with Mwaniki Associates Consultants
for KPA, 1995.
0 50 100 150 200 250 300
3.2.4.2 Terminal handling charges (THC)
Some shipping agents are still charging their clients' terminal handling charges, which contributes to the cost of shipping through the port of Mombasa. The port users complained that terminal handling charges of US$ 70 per container paid by the users of the northern corridor was making the port of Mombasa more expensive compared to the port of Dar-es-Salaam.
3.2.4.3 KRC Tariff rates
Castellano, T (1999, July), Managing Director of Oceanfreight (K) Ltd confirms that KRC's tariff for transportation of containerised traffic between Mombasa and Malaba is US$ 930, while Tanzania Railways Corportation (TRC's) tariff between Dar es Salaam and Mwanza is US$ 724. However, from Malaba to Kampala and from Mwanza to Kampala the tariff is uniform at US$ 429. Therefore Northern Corridor route is more expensive by US$ 206 hence the diversion of Uganda traffic to Dar es Salaam port.
3.2.4.4 KRA Tariff rates
The port users complained of high customs overtime cost charged per truck carrying export cargo from Uganda at the Malaba border. KRA also charges high warehouse rents at the rate of US$ 30 per day for a 20-ft container and US$ 60 for a 40-ft container.
3.2.5 Problem Group 5: Others
The following issues are not related to problems pertaining to the movement of cargo but were raised in the consultative meeting.
Table 14. Problems pertaining to others.
Code Problem Code Problem
3.2.5.1 Telephone services
Majority of the port users found it difficult to communicate to their offices while at the port due to insufficient telecommunication facilities in the port.
3.2.5.2 Treatment of cruise ship passengers
Harassment of cruise ship passengers is another way of de-marketing the port especially when KPA has intentions to establish a cruise ship hub of Indian Ocean region. It appears that the matter was not even attended to, as there was no feed back from the marketing department.
3.3 Conclusion
CHAPTER 4
CRITICAL ANALYSIS OF THE PROBLEMS
4.1 Introduction
The main objective of this chapter is to carry out an in-depth analysis of the problems discussed in the previous chapter. The first step will be to analyse the evolution of the problems over the period under review. Thereafter, to look at the composition of the problems in relation to the participants of the meetings, then a study to ascertain the persistence of these problems. Finally, to analyse the consequential effects of the problems for the port and the community.
4.2 Evolution of the problems
During the period under review, the problems related to turn around time had the highest recorded number of complaints as illustrated in figure 9.
Figure 9. The Evolution of the Composition of the problems in percentage Source: Appendix D
4.2.1 Analysis for 1995
Two meetings were held in the months of May and November respectively. The year under review had a total of 17 complaints analysed as follows:
1.May 1995 meeting
This meeting had a record of 12 complaints analysed as follows:
7 of the complaints pertained to turn around time, 4 to productivity and 1 to security
respectively. The 1st meeting was concluded with a promise to the port users on the
basis of the following:
KPA was to look into issues of documentation procedures, convert berth no 14 for use of container operations, to rehabilitate the equipment at Mombasa port and ICD Nairobi, additional land for stacking containers and to issue out turn reports and final bills on time.
2.November 1995 meeting
This meeting had a record of 5 complaints analysed as follows:
1 complaint pertained to turn around time and 2 to cost respectively. The remaining 2
complaints, pertained to productivity of the previous meeting. The 2nd meeting was
concluded on the basis of the following:
KPA was to provide a list of undocumented containers to the customs, a committee was established to look into documentation procedures, and the issue of storage space at the CWH would be solved immediately.
4.2.2 Analysis for 1996
Three meetings were held in the months of April, July and November respectively. Internal environment: a new management team including a managing director had been appointed.
External environment: KPA was exempted from the State Corporations Act.
13 of the complaints pertained to turn around time, 3 of each to productivity, security, and cost and 2 to others, respectively.
1.April 1996 meeting
This meeting had a record of 10 complaints analysed as follows:
4 of the complaints pertained to turn around time, 1 to productivity, and 1 of each to cost and others respectively. The remaining complaints pertained to turn around time of the
previous meeting of May 1995. The 1st meeting was concluded on the basis of the
following:
Improvement in equipment availability, KPA and KRA to computerise documentation procedures, there were no immediate plans to convert berth No.14, contracting of management of container terminal, impose higher punitive charges for the shippers to curb on dwell time of cargo and to open up a liaison office in Kampala.
2.July 1996 meeting
This meeting had a record of 8 complaints analysed as follows:
2 of the complaints pertained to turn around time, 1 to productivity and 2 to security respectively. Of the remaining complaints, 2 pertained to turn around time of May 1995
meeting and April 1996 meeting and 1 to cost of April 1996 meeting. The 2nd meeting
was concluded on the basis of the following:
3.November 1996 meeting
This meeting had a record of 6 complaints analysed as follows:
1 of each complaint pertained to turn around time, productivity, security, cost and others respectively. The remaining complaint pertained to turn around time of May 1995 meeting. The 3rd meeting was concluded on the basis of the following:
A team from Felixstowe port was contracted to manage Mombasa container terminal. A new KPA head of security services had been appointed. The security situation at the port had improved markedly by beefing up security and safe guard cargo. Port Louis planning and tracking system was not beneficial to the port. A task force was set up by KPA to facilitate processing of claims. A review to be on documentation system to facilitate speedy clearance and flow of containers. KPA received a number of new trailers being part of an aid package from the Dutch government.
4.2.3 Analysis for 1997
Two meetings were held in the months of September and November respectively. Internal environment: A new managing director had been appointed.
External environment: The general elections were to be held during the year under review.
The year under review had a record of 19 complaints a decrease by –26.3 %, analysed as follows:
7 of the complaints pertained to turn around time, 1 to productivity, 7 to security, 3 to cost and 1 to others respectively.
1.September 1997 meeting
This meeting had a record of 12 complaints analysed as follows:
1996 meetings, 1 to security of May 1995 meeting and 1 to cost of November 1995
meeting respectively. The 1st meeting was concluded on the basis of security measures
undertaken by KPA to reduce cases of theft / pilferage of cargo.
2.November 1997 meeting
This meeting had a record of 7 meetings analysed as follows:
4 of the complaints pertained to turn around time and 1 to security. The remaining complaints, 1 of each pertained to security of September 1997 meeting and others of
April 1996 meeting. The 2nd meeting was concluded that delays experienced during
stripping were set to improve by 1/12/97.
4.2.4 Analysis for 1998
Four meetings were held in the months of May, June, November and December respectively. The year under review had a record of 35 complaints an increase by 45.7 %, analysed as follows:
15 complaints pertained to turn around time, 11 to productivity, 6 to security and 3 to cost. There was none for others respectively.
1.May 1998 meeting
This meeting had a record of 10 complaints analysed as follows:
2 of the complaints pertained to turn around time, 4 to productivity and 4 to security respectively. The 1st meeting was concluded on the basis of the following:
2.June 1998 meeting
This meeting had a record of 9 complaints analysed as follows:
3 of the complaints pertained to turn around time, 2 to productivity and 1 of each to security and cost. Of the remaining 2 complaints, 1 of each pertained to productivity of
July 1996 meeting and turn around time of May 1995 meeting. The 2nd meeting was
concluded on the basis of the following:
KPA was to advertise notices in the media for port users to hasten the clearance of their cargo from the port. Port users were advised to bring forward for discussion, only those issue that could not be effectively discussed in other forums. The installation of a watchtower at the G section was complete. KRC undertook to increase its railing capacity through additional trains between Mombasa container terminal and ICD's. KPP under took to increase police patrols along the dual carriageway. KRC was to facilitate the operation of express trains to Uganda.
3.November 1998 meeting
The cause of the time lapse between the previous and the current one was not explained. However, the meeting had a record of 9 complaints analysed as follows:
4 of the complaints pertained to turn around time and 1 of each to security and cost respectively. Of the remaining 3 complaints, 2 pertains to turn around time and 1 to
productivity of May 1995 meeting. The 3rd meeting was concluded on the basis of the
following:
Watch towers at the G section were still not operational. The construction of a locker to cater for storage requirements of motor vehicle keys was not complete. PAPC meetings were to be held every 2 months. KRC are not able to run express trains to Kampala due to logistic problems.
This meeting had a record of 7 complaints analysed as follows:
3 of the complaints pertained to turn around time, 3 to productivity and 1 to cost respectively. The result of the 4th meeting was KPA to look for a stand by generator due to the break down of computers in Revenue section.
4.2.5 Analysis for 1999
Six meetings were held in the months of March, April, September, October, November and December 1996 respectively. The year under review had a record of 41 complaints an increase by 14.6 %, analysed as follows:
22 of the complaints pertained to turn around time, 6 to productivity, 4 to security and 9 to cost. There was none for others respectively.
1.March 1999 meeting
This was no longer to be a PAPC meeting but was referred to as consultative meeting with particular reference to the movement of rail borne traffic from the port. This meeting had a record of 7 complaints analysed as follows:
3 of the complaints pertained to productivity, 2 to security and 2 to cost respectively. The 1st meeting was concluded on the basis of the following:
A task force was formed comprising of members from KPA container terminal, KRC, KSA, KFA, KRA and KPP to fully address and streamline cargo operations pertaining to the movement of rail borne cargo between the port and Nairobi, Kisumu ICD's and other hinterland destinations. A joint marketing task force was formed comprising of members from KPA, KRC, KRA, KSA and KFA to pursue and come up with recommendations on how the northern corridor route can be more efficient and competitive cost wise. KRA had established an anti theft unit.
This meeting had a record of 5 complaints pertaining to turn around time, but 1
pertained to the meeting of November 1998. The 2nd meeting was concluded on the
basis of the following: A URC resident representative was to be co-opted into the marketing task force. There was an improvement in the railing of cargo from the port despite insufficient supply of empty wagons, equipment availability, wagon placing, shunting and documentation. KRC to commence block train services.
3.September 1999 meeting
This meeting had a record of 10 complaints analysed as follows:
6 of the complaints pertained to turn around time, 1 to productivity and 2 to cost. The
remaining 1 pertained to cost of September 1997 meeting. The 3rd meeting was
concluded on agreement that a technical committee to be set up comprising of KSA, KRA, KFA, KPA KRC and URC to come up with a composite rate for cargo destined to transit countries with an aim of increasing traffic through the northern corridor.
4.October 1999 meeting
Internal environment: A new managing director had been appointed. This meeting had a record of 7 complaints analysed as follows:
4 of the complaints pertained to turn around time while the remaining 3 complaints, 1 of each pertained to turn around time of April 1999, security of September 1997 and cost of
September 1999 meetings respectively. The 4th meeting was concluded on the basis of
the following:
KPA was to set up a fax hotline to receive feed back from port users on services offered and designate a liaison office to co-ordinate and designate information concerning block train services between Mombasa and Kampala. KRC confirmed improvement in block train services with transit a time of less than 60 hours.
This meeting had a record of 12 complaints analysed as follows:
5 of the complaints pertained to turn around time, 2 to productivity and 2 to cost respectively. Of the remaining 3 complaints, 1 of each pertained to turn around time and
cost of September 1999 and security of September 1997. The 5th meeting was
concluded on the basis of the following:
KPA's fax hot line was operational, and a liaison office had been set up at the terminal manager's office. KPA agreed to accept payment of port dues in US dollars. Improvements on northern corridor as a result of the consultative initiatives were to be publicised. The strategy of a joint marketing campaign to visit the transit countries with aim of sensitising current potential customers of the new developments along the northern corridor emanating from the port of Mombasa was proposed. KRC reduces its tariff rates by 11.4 % and are also responsible for damaged containers transported by rail, while URC is to review its tariff rates. Technical sub committee agreed on a minimum composite rate of US$ 1495 (Mombasa - Kampala) for a 20-ft container going by rail, including port charges, KRC, URC, THC and delivery order charges.
6.December 1999 meeting
Internal environment: The newly appointed managing director was formally a member of the joint marketing task force and is well aware of the port users problems.
were urged to conduct business on a transparent basis, as it adds value to move goods through the port. KPA's managing director was keen on the deplorable state of the port but assured the customers to manage the port on a customer friendly basis by walking through the system.
4.3 Composition of the problems
Two major associations, namely the Kenya International Freight and Warehousing Association and the Kenya Ships Agents Association participate actively in these meetings. Apart from these 2 associations state corporations and other individual companies participate too as illustrated in table 15.
Table 15. Members of port users meetings.
Code Organisation Code Organisation
KFA Kenya International Freight & UFA Uganda Clearing &Forwarding
Warehousing Association Association
KSA Kenya Ships Agents Association URA Uganda Revenue Authority
KPA Kenya Ports Authority CMT Consultative Meeting of Transit
KRA Kenya Revenue Authority Traffic
KRC Kenya Railways Corporation JMTF Joint Marketing Task Force
KPP Kenya Port Police COs’ Individual companies
URC Uganda Railways Corporation
Source: Appendix C
4.3.1 Turn around time
Figure 10 is comprised of 83 % of the participants in table 15. The period under review had a record of 65 complaints analysed as follows:
Figure 10. The participants for problems related to turn around time Source: Appendix E.
In 1996, the number of complaints raised by KFA increased to 10 while KSA had 3 complaints. The increase was as a result of the change in the internal environment and 3 meetings were held in the year under review compared to the 2 in the previous year.
In 1997, the number of complaints raised by KFA decreased to 6 and by KSA to 1. The decrease was as a result of the time lapse of 9 months before the next meeting was held. The decrease could have also been caused by change in the internal environment
In 1998, the number of complaints raised by KFA increased to 11 while no complaints originated from KSA despite their presence. 2 complaints originated from KPA and 1 of each from KRA and KRC. The cause of increase was the concern of decline in transit traffic by-52.6 % in 1997 and -16 % in 1998.
In 1999, there was a wind of change, with the appointment of 2 managing directors in the year under review. The meeting was no longer dominated by KFA hence the decrease of the number of complaints to 2. The pattern of conducting the meetings changed with particular reference to movement of transit cargo. Complaints were either
5 10 6 11 2 2 2 1 0 4 1 0 0 2 0 0 0 0 1 0 1 0 0 1 0
0 0 0 0
4
0 0 0 0
2
0 0 0 0
3
0 0 0 0
1
0 0 0 0
6 0% 20% 40% 60% 80% 100%
1995 1996 1997 1998 1999