REVIEW
Nasal colonization of methicillin resistant
Staphylococcus aureus
in Ethiopia: a systematic
review and meta-analysis
Alemayehu Reta
*, Abeba Mengist and Asnakew Tesfahun
Abstract
Background: Methicillin-resistant Staphylococcus aureus (MRSA) is one of a medically important Gram-positive bacteria, which can be harboured majorly in the nasal cavity. Risk of consequent infection in a person colonized with
S. aureus as well as MRSA upsurges with time and remains insistently increased. Hence, the objective of this meta-analysis was to determine the prevalence of S. aureus and MRSA nasal colonization in Ethiopia at large.
Methods: PubMed, Google Scholar, Embase, Hinari, Sci Hub, Scopus, and the Directory of Open Access Journals were searched and a total of 10 studies have been selected for meta-analysis. Preferred Reporting Items for Systematic Reviews and Meta-Analyses (PRISMA) guidelines were used for the literature search strategy, selection of publications, data extraction, and the reporting of results for the review. All statistical analyses were performed using STATA version 11 software via random effects model. The pooled prevalence was presented in forest plots and figure with 95% CI. Results: A total of ten studies with 2495 nasal swab samples were included in this meta-analysis, and the overall pooled estimated prevalence of S. aureus and MRSA nasal colonization in Ethiopia were 30.90% [95% CI 21.81– 39.99%], 10.94% [95% CI 8.13–13.75%] respectively. Subgroup analysis was also noted in different regions of Ethio-pia, henceforth Oromia region ranked first 21.28% [95% CI 8.22–34.35%], followed by Amhara region 6.78% [95% CI 3.02–10.54%], whereas relatively low magnitude of MRSA colonization was demonstrated from Tigray region 4.82% [95% CI 2.18–7.45%].
Conclusion: The analysis showed that the overall prevalence of S. aureus and MRSA nasal colonization in Ethiopia were comparable with the global prevalence. But a huge variation between the regions, so the Ministry of Health of Ethiopia should design appropriate decolonization program that can address the specific regional groups as well as the national population.
Keywords: Methicillin-resistant Staphylococcus aureus, Nasal colonization, Meta-analysis, Ethiopia
© The Author(s) 2019. This article is distributed under the terms of the Creative Commons Attribution 4.0 International License (http://creat iveco mmons .org/licen ses/by/4.0/), which permits unrestricted use, distribution, and reproduction in any medium, provided you give appropriate credit to the original author(s) and the source, provide a link to the Creative Commons license, and indicate if changes were made. The Creative Commons Public Domain Dedication waiver (http://creativecommons.org/ publicdomain/zero/1.0/) applies to the data made available in this article, unless otherwise stated.
Background
Methicillin-resistant Staphylococcus aureus (MRSA) is one of a medically important Gram-positive bacteria, which first emerged since 1961 [1]. It is introduced to the African continent in 1978 and appeared in Ethiopia in 1987 [2, 3]. Among the body sites that harbour MRSA such as throat, perineum, skin, hairline, groin, and the axilla, the anterior nares, the most important site for
MRSA colonization is the nasal cavity [4]. Nasal coloni-zation with S. aureus is a vibrant process; a number of factors being responsible for the gain and loss of car-riage. Risk of consequent infection in a person colonized with S. aureus as well as MRSA upsurges with time and remains insistently increased [5].
MRSA is defined as any strain of S. aureus that has established resistance to beta-lactam antibiotics such as Methicillin, Oxacillin, Cefoxitin and Nafcillin [6, 7]. These strains are responsible for a greater number of nosocomial infections which are tough to combat in humans [8]. MRSA has been conveyed with alarming
Open Access
*Correspondence: [email protected]; alemayehureta@yahoo. com; [email protected]
frequencies worldwide, and these strains majorly unveil multi-drug resistance, that is resistant to three or more classes of antibiotics [9]. Multidrug resistance of nasal S. aureus associated with methicillin-resistant strains is of great public health concern especially in developing countries [10].
Several studies in Ethiopia have reported the rate of nasal colonization of S. aureus and MRSA varying from 12% to 60% and 0% to 29% respectively. Increased car-riage rate was recorded among patients in both S. aureus and MRSA [11–20].
Elimination of nasal carriage has been reported to cause a significant reduction in the incidence of MRSA infections in the community [21]. Understanding the overall epidemiology of nasal colonization of S. aureus and MRSA at the country level is so significant to strengthen effective prevention and control strategies. So, this meta-analysis was aimed to summarize available data and to determine the pooled prevalence of S. aureus and MRSA nasal colonization in Ethiopia by conducting a meta-analysis.
Methods
Study design and literature search strategy
This study did a meta-analysis on nasal colonization of S. aureus and MRSA in Ethiopia using the best avail-able studies. Preferred Reporting Items for Systematic Reviews and Meta-Analyses (PRISMA) guidelines were used for the literature search strategy, selection of pub-lications, data extraction, and the reporting of results for the review [22]. Published works of literatures on nasal colonization of MRSA were reviewed using the follow-ing major databases; PubMed, Google Scholar, Embase, Hinari, Sci Hub, Scopus, and the Directory of Open Access Journals (DOAJ) and additional articles identi-fied through other electronic sources (Google, Cochrane library and reference lists). Literature searches were con-ducted from July to September 2018. During a compre-hensive literature search, the following search terms were used: “nasal colonization, nasal carriage, Methicillin-Resistant Staphylococcus aureus (MRSA), Staphylococ-cus aureus, S. aureus, Ethiopia’’. Various combinations of key terms were used through Boolean search technique. Additionally, the references cited by each eligible study were scrutinized to identify additional articles. We did not limit the search by a year of publication.
Study selection and eligibility criteria
Inclusion criteria: In this meta-analysis, we included all studies that were conducted on nasal colonization of MRSA in Ethiopia. All available studies and data were incorporated based on the following predefined eligibility criteria: Should be published and written in English, had
to describe the standard microbial isolation and identifi-cation, studies should use human originated sample and should be a prospective cross-sectional study.
Exclusion criteria: Studies that used samples other than human origin and nasal swab; Studies that didn’t describe the standard microbial isolation and identification tech-niques and studies with no full information to calculate the prevalence MRSA were excluded.
Outcome of interest
The major outcome of interest was the prevalence of MRSA and S. aureus nasal swab isolates. The prevalence was calculated by dividing both the numbers of MRSA and S. aureus isolates to the total number of nasal swab samples.
Quality assessment and critical appraisal
In this meta-analysis, the qualities of each article were assessed by using a critical appraisal tool for use in sys-tematic reviews for prevalence study [23]. The employed methods for MRSA isolation and eligibility of the iden-tified articles were also assessed by all authors and disa-greements among reviewers were fixed accordingly with a discussion. In addition, a modified version of the New-castle–Ottawa Scale for the cross-sectional study was used to evaluate the quality of studies [24].
Data extraction
Data from appropriate studies were pull out indepen-dently by authors and potted into a spreadsheet. Incon-sistencies were resolved by unanimity. For each of the encompassed studies, the following information was extracted; the name of the author, publication year, study area, study period, study design, study population, num-ber of samples, numnum-ber of S. aureus isolates, number of MRSA, the prevalence of S. aureus and prevalence of MRSA.
Data analysis and synthesis
scenario leads to use a random effects model with 95% CIs to avoid the significant heterogeneity. Furthermore, the presence of heterogeneity was also assessed by sub-group analysis and meta-regression. Visual assessment of publication bias was shown using funnel plot. Asym-metry of the funnel plot is an indicator of publication bias [22]. To check potential publication bias (small study bias), Egger’s and Begg’s tests were performed [31]. Also, the sensitivity analysis was done to assess whether the pooled prevalence estimates were preju-diced by individual studies.
Result
Selection and identification of studies
The process of identifying the relevant articles for inclu-sion in this meta-analysis is represented graphically in Fig. 1. A total of 732 studies were identified through an electronic database search. We added 101 additional arti-cles identified through other electronic sources (Google, Cochrane library and reference lists). Of these stud-ies, 589 were excluded after reviewing their title and abstracts, 119 were found to be duplicates, and 115 were disregarded because the abstracts or full-text information did not directly relate to the topic of interest i.e. nasal
Records idenfied through database searching
(n =732)
Screenin
g
Include
d
Eligibility
Idenficaon
Addional records idenfied through other sources
(n =101)
Records aer duplicates removed (n =714)
Records screened (n =714)
Records excluded (n =589)
Full-text arcles assessed for eligibility
(n =125)
Full-text arcles excluded, with reasons
(n =115)
Studies use samples other than human populaon and nasal swab
Studies didn’t describe the standard microbial isolation and
identification Studies with no full information to calculate the prevalence MRSA
Studies included in qualitave synthesis
(n =10)
Studies included in quantave synthesis
(meta-analysis) (n =10)
colonization of MRSA in Ethiopia. Finally, 10 unique arti-cles fulfilled our eligibility criteria and were enrolled for meta-analysis (Fig. 1).
Characteristics of included studies
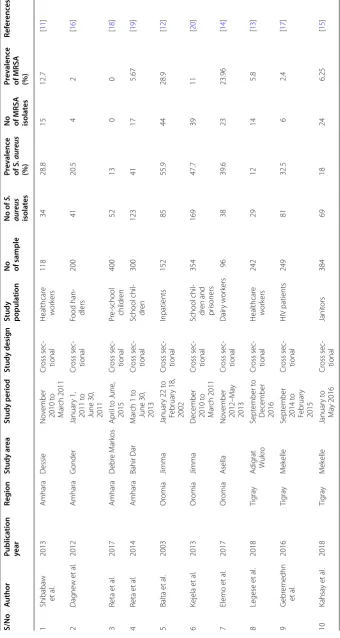
A total of ten studies with 2495 nasal swab samples were included in this meta-analysis was summarized in Table 1. The studies were conducted from 2003 to 2018 in different regions of the country. Among 10 studies, four of them [11, 16, 18, 19] were conducted in Amhara region, three studies [12, 14, 20] were in the Oromia region, and the other three studies [13, 15, 17] were in Tigray regional state of the country, no data was obtained from other regions (Benishangul-Gumuz, Gambella, Somali, SNNP (Southern Nations Nationalities and Peo-ple), Afar, Dire Dawa and Addis Ababa). All studies were a cross-sectional study conducted on nasal colonization of MRSA in Ethiopia. The study with a minimum and a maximum nasal swab sample was conducted in Oromia and Amhara region, respectively [14, 18]. In addition, out of all studies enrolled in this meta-analysis eight studies [11, 13–16, 18–20] were conducted among patients while the remaining two studies [12, 17] were conducted from apparently healthy individuals (Table 1).
Nasal colonization of S. aureus
The pooled prevalence using the fixed effect model revealed significant heterogeneity between the studies. Hereafter, we performed the analysis using the random effects model. Using random effects model, the estimated pooled prevalence of nasal colonization of S. aureus stated by the ten studies was 30.90% [95% CI 21.81– 39.99%] with significant heterogeneity between stud-ies (I2= 100%, p < 0.001). The pooled prevalence of nasal colonization of S. aureus offered using forest plot (Fig. 2). To assess the potential heterogeneity between studies, subgroup analysis by study area was conducted. Of the ten studies, the highest expected nasal colonization of S. aureus prevalence found in studies showed in Oro-mia region 47.74% [95% CI 40.72–54.77%], I2= 99.8%, p < 0.001, followed by studies showed in Amhara region, was 25.82% [95% CI 11.08–40.57%], I2= 100%, p < 0.001 (Fig. 3).
Nasal colonization of MRSA
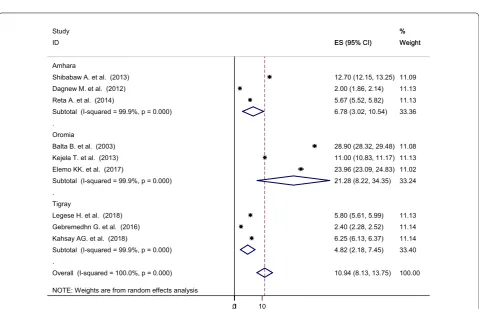
As shown from Fig. 4, the overall pooled prevalence of nasal colonization of MRSA was 10.94% [95% CI 8.13– 13.75%], I2= 100%, p < 0.001. Subgroup analysis was also noted in different regions of Ethiopia, henceforth Oro-mia region ranked first 21.28% [95% CI 8.22–34.35%], I2= 99.9%, p < 0.001, followed by Amhara region 6.78% [95% CI 3.02–10.54%], I2= 100%, p < 0.001, whereas relatively low magnitude of MRSA colonization were
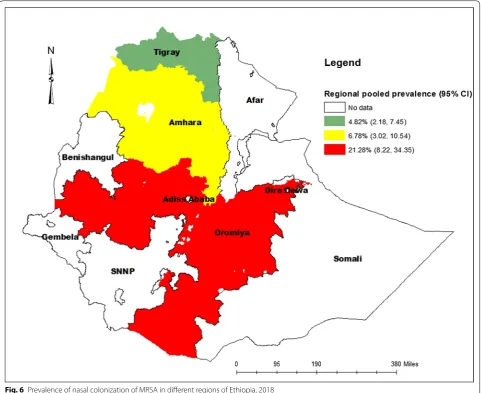
demonstrated from Tigray region 4.82% [95% CI 2.18– 7.45%], I2= 100%, p < 0.001 (Figs. 5 and 6).
Investigation of heterogeneity
In this meta-analysis, the value of I2 indicates a signifi-cant high heterogeneity, so we adjust this by using ran-dom effect model and the source of heterogeneity was investigated using meta-regression model using pub-lication year and the number of a sample as covariates. The result of meta-regression analysis revealed that both covariates were not statistically significant for the pres-ence of heterogeneity (Table 2).
Publication bias
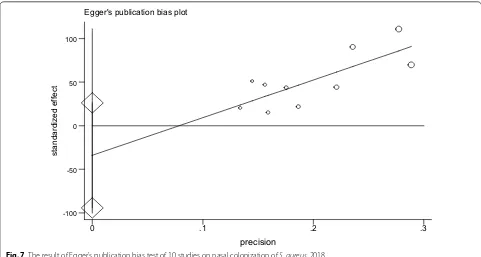
The presence of publication bias was assessed using Begg’s and Egger’s tests, showing no statistical signifi-cance for estimating the prevalence of nasal colonization of S. aureus and MRSA (Table 3, Figs. 7 and 8).
Sensitivity analysis
The result of sensitivity analysis using random effects model suggested that no single study improperly influ-enced the overall prevalence estimate of nasal coloniza-tion of S. aureus and MRSA (Figs. 9 and 10).
Discussion
We conducted this meta-analysis to estimate the overall pooled prevalence of nasal colonization of S. aureus and MRSA in Ethiopia. Ten unique articles which fulfilled our eligibility criteria were included and enrolled for meta-analysis. After analysis, the overall estimated pooled prevalence of nasal colonization of S. aureus and MRSA in Ethiopia were 30.90% [95% CI 21.81–39.99%]), 10.94% [95% CI 8.13–13.75%]) respectively. The overall preva-lence of nasal colonization of S. aureus indicated in this meta-analysis is in line with a meta-analysis conducted in Iran (22.7% [95% CI 19.3–26.6]). The pooled estimate prevalence of nasal colonization of MRSA in this meta-analysis is lower than a meta-meta-analysis conducted in Iran (32.8% (95% CI 26.0–40.4) [32] and Egypt (32%) [33], and relatively higher than a systematic review done in Europe and the United States of America (1.8% [95% CI 1.34– 2.50%]) [34], Moreover, it is in agreement with a study done in Nigeria (11%) [35]. The possible explanations for the above variations could be due to methodological differences (i.e., Microbiological isolation and detection techniques), variation in sociodemographic characteris-tics, economic, and health service utilization.
Table
1
C
har
ac
teristics of studies included in meta-analy
sis of nasal c
oloniza
tion of MRSA in E
thiopia, 2018 S/No A uthor Publica tion year Reg ion Study ar ea Study period Study desig n
Study popula
tion
No of sample
No of S. aur eus isola tes Pr ev alenc e of S . aur eus (%)
No of MRSA isola
tes
Pr
ev
alenc
e
of MRSA (%)
Ref er enc es 1 Shibaba w et al . 2013 Amhara D essie No
vember 2010 t
o M ar ch 2011 Cr oss sec -tional Healthcar e w or kers 118 34 28.8 15 12.7 [ 11 ] 2 Dag ne w et al . 2012 Amhara G onder Januar y 1, 2011 t o
June 30, 2011
Cr oss sec -tional Food han -dlers 200 41 20.5 4 2 [ 16 ] 3 Reta et al . 2017 Amhara D ebr e M ar kos Apr il t o June , 2015 Cr oss sec -tional Pr
e-school childr
en 400 52 13 0 0 [ 18 ] 4 Reta et al . 2014 Amhara Bahir Dar M ar
ch 1 t
o
June 30, 2013
Cr oss sec -tional School chil -dr en 300 123 41 17 5.67 [ 19 ] 5 Balta et al . 2003 Or omia Jimma Januar
y 22 t
o Februar y 18, 2002 Cr oss sec -tional Inpatients 152 85 55.9 44 28.9 [ 12 ] 6 Kejela et al . 2013 Or omia Jimma D
ecember 2010 t
o M ar ch 2011 Cr oss sec -tional School chil -dr en and pr isoners 354 169 47.7 39 11 [ 20 ] 7 Elemo et al . 2017 Or omia A sella No
vember 2012–M
NOTE: Weights are from random effects analysis Overall (I-squared = 100.0%, p = 0.000) Kahsay AG. et al. (2018)
Balta B. et al. (2003) Kejela T. et al. (2013) Dagnew M. et al. (2012)
Legese H. et al. (2018) Reta A. et al. (2014)
Elemo KK. et al. (2017) ID
Gebremedhn G. et al. (2016) Reta A. et al. (2017) Shibabaw A. et al. (2013) Study
30.90 (21.81, 39.99) 18.00 (17.80, 18.20) 55.90 (55.26, 56.54) 47.70 (47.42, 47.98) 20.50 (20.10, 20.90)
12.00 (11.74, 12.26) 41.00 (40.68, 41.32)
39.60 (38.60, 40.60) ES (95% CI)
32.50 (32.13, 32.87) 13.00 (12.84, 13.16) 28.80 (28.05, 29.55)
100.00 10.00 10.00 10.00 10.00
10.00 10.00
9.99 Weight
10.00 10.00 10.00 %
0.11 10
Fig. 2 Forest plot showing the pooled prevalence of nasal colonization of S. aureus in 10 studies in Ethiopia, 2018
NOTE: Weights are from random effects analysis .
. .
Overall (I-squared = 100.0%, p = 0.000) Dagnew M. et al. (2012)
Gebremedhn G. et al. (2016) Study
Kahsay AG. et al. (2018) Legese H. et al. (2018)
Subtotal (I-squared = 100.0%, p = 0.000) Amhara
Shibabaw A. et al. (2013)
Subtotal (I-squared = 99.8%, p = 0.000) Reta A. et al. (2017)
Kejela T. et al. (2013) ID
Oromia
Balta B. et al. (2003)
Elemo KK. et al. (2017)
Subtotal (I-squared = 100.0%, p = 0.000) Reta A. et al. (2014)
Tigray
30.90 (21.81, 39.99) 20.50 (20.10, 20.90)
32.50 (32.13, 32.87) 18.00 (17.80, 18.20) 12.00 (11.74, 12.26) 25.82 (11.08, 40.57) 28.80 (28.05, 29.55)
47.74 (40.72, 54.77) 13.00 (12.84, 13.16)
47.70 (47.42, 47.98) ES (95% CI)
55.90 (55.26, 56.54)
39.60 (38.60, 40.60)
20.83 (11.16, 30.51) 41.00 (40.68, 41.32)
100.00 10.00
10.00 %
10.00 10.00 40.00 10.00
29.99 10.00
10.00 Weight
10.00
9.99
30.01 10.00
0 .1 10
NOTE: Weights are from random effects analysis Overall (I-squared = 100.0%, p = 0.000) ID
Elemo KK. et al. (2017) Study
Reta A. et al. (2014)
Legese H. et al. (2018)
Kahsay AG. et al. (2018) Gebremedhn G. et al. (2016) Dagnew M. et al. (2012)
Kejela T. et al. (2013) Balta B. et al. (2003) Shibabaw A. et al. (2013)
10.94 (8.13, 13.75) ES (95% CI)
23.96 (23.09, 24.83) 5.67 (5.52, 5.82)
5.80 (5.61, 5.99)
6.25 (6.13, 6.37) 2.40 (2.28, 2.52) 2.00 (1.86, 2.14)
11.00 (10.83, 11.17) 28.90 (28.32, 29.48) 12.70 (12.15, 13.25)
100.00 Weight
11.02 %
11.13
11.13
11.14 11.14 11.13
11.13 11.08 11.09 %
0
.11 10
Fig. 4 Forest plot showing the pooled prevalence of nasal colonization of MRSA in 9 studies in Ethiopia, 2018
NOTE: Weights are from random effects analysis .
.
.
Overall (I-squared = 100.0%, p = 0.000) Study
Subtotal (I-squared = 99.9%, p = 0.000)
Gebremedhn G. et al. (2016) Oromia
Subtotal (I-squared = 99.9%, p = 0.000) Tigray
Balta B. et al. (2003)
Legese H. et al. (2018)
Subtotal (I-squared = 99.9%, p = 0.000) Shibabaw A. et al. (2013)
ID
Reta A. et al. (2014)
Elemo KK. et al. (2017) Dagnew M. et al. (2012)
Kejela T. et al. (2013) Amhara
Kahsay AG. et al. (2018)
10.94 (8.13, 13.75) 6.78 (3.02, 10.54)
2.40 (2.28, 2.52)
4.82 (2.18, 7.45) 28.90 (28.32, 29.48)
5.80 (5.61, 5.99) 21.28 (8.22, 34.35) 12.70 (12.15, 13.25) ES (95% CI)
5.67 (5.52, 5.82)
23.96 (23.09, 24.83) 2.00 (1.86, 2.14)
11.00 (10.83, 11.17)
6.25 (6.13, 6.37)
100.00 %
33.36
11.14
33.40 11.08
11.13 33.24 11.09 Weight
11.13
11.02 11.13
11.13
11.14 ES (95% CI)
% Weight
0.1 10
MRSA across the regions of the country. The highest (47.74%, 21.28%) prevalence of nasal colonization of S. aureus and MRSA respectively was reported from the Oromia region, whereas the lowest (20.83%, 4.82%) prev-alence of nasal colonization of S. aureus and MRSA was reported from Tigray region. The possible explanation for this variation might be due to the cultural variation, the difference in health infrastructure and health policy implementation across the regions of the country.
Fig. 6 Prevalence of nasal colonization of MRSA in different regions of Ethiopia, 2018
Table 2 Meta-regression analysis of factors with heterogeneity of the prevalence of nasal colonization of S. aureus in Ethiopia, 2018
Heterogeneity source Coefficients Std. err. t P value 95% conf. interval
Publication year − 2.358079 2.81955 − 0.84 0.431 − 9.025255 4.309097
No of sample − 0.0114633 0.077581 − 0.15 0.887 − 0.1949132 0.1719866
Table 3 P-value for Begg’s and Egger’s test for nasal colonization of S. aureus and MRSA, 2018
Tests P value
Nasal colonization of S.
aureus Nasal colonization
of MRSA
Begg’s 0.721 0.251
Limitations of the study
Due to the absence of similar and related factors, we were unable to perform factor analysis and examine the
pooled odds ratios, even if there are a number of fac-tors in each study such as age, sex, socioeconomic sta-tus, use of antibiotics, hospitalization, recurrent acute Egger's publication bias plot
standardized effect
precision
0 .1 .2 .3
-100 -50 0 50 100
Fig. 7 The result of Egger’s publication bias test of 10 studies on nasal colonization of S. aureus, 2018
Egger's publication bias plot
standardized effect
precision
0 .2 .4 .6 .8
-100 0 100 200
6.28 8.13 10.94 13.75 15.16 Shibabaw A. et al. (2013)
Dagnew M. et al. (2012)
Reta A. et al. (2017)
Reta A. et al. (2014)
Balta B. et al. (2003)
Kejela T. et al. (2013)
Elemo KK. et al. (2017)
Legese H. et al. (2018)
Gebremedhn G. et al. (2016)
Kahsay AG. et al. (2018)
Lower CI Limit Estimate Upper CI Limit Meta-analysis estimates, given named study is omitted
Fig. 9 Result of sensitivity analysis of the studies on nasal colonization of MRSA, 2018
19.04 21.81 30.90 39.99 43.22
Shibabaw A. et al. (2013)
Dagnew M. et al. (2012)
Reta A. et al. (2017)
Reta A. et al. (2014)
Balta B. et al. (2003)
Kejela T. et al. (2013)
Elemo KK. et al. (2017)
Legese H. et al. (2018)
Gebremedhn G. et al. (2016)
Kahsay AG. et al. (2018)
Lower CI Limit Estimate Upper CI Limit
Meta-analysis estimates, given named study is omitted
otitis media, hygienic practice of the hand and the like. However, this review has delivered valuable informa-tion concerning the pooled estimate prevalence of nasal colonization of S. aureus and MRSA.
Conclusions and recommendations
This meta-analysis demonstrates that the pooled esti-mated prevalence of nasal colonization of S. aureus and MRSA in Ethiopia was relatively in a comparable preva-lence with the total nasal colonization of S. aureus and MRSA as a whole in the human population. But, when we observed the pooled estimate prevalence of each (S. aureus and MRSA) in different regions of Ethiopia, it has extreme variation. Thus, to contest the burden of nasal colonization of S. aureus and MRSA in particu-lar, the following concerns should be well thought-out at the national level, such as adopting safety protocols and implementing proper decolonization policies in a regional base.
Finally, in Ethiopia, conducting such type of study will give additional input for program planners and pol-icy makers working in the area of infectious disease and also it will help clinicians to give empirical treatment.
Abbreviations
CI: confidence interval; DOAJ: Directory of Open Access Journals; MRSA: methicillin-resistant Staphylococcus aureus; PRISMA: Preferred Reporting Items for Systematic Reviews and Meta-Analyses; SNNP: Southern Nations Nationali-ties and People; STATA : statistics and data.
Acknowledgements
We would like to thank Mr. Getiye Dejenu for his support during statistical analysis (STATA).
Authors’ contributions
AR carried out conceptualization, formal statistical analysis, development of methodology, curation of data, drafted the manuscript, revising it critically for important intellectual content, given final approval of the version to be published. AM and AT carried out curation of data, revising it critically and searching literatures. All authors read and approved the final manuscript.
Funding Not applicable.
Availability of data and materials
Data sharing is not applicable to this article as no datasets were generated or analyzed during the current study.
Ethics approval and consent to participate Not applicable.
Consent for publication Not applicable.
Competing interests
The authors declare that they have no competing interests.
Received: 22 March 2019 Accepted: 28 August 2019
References
1. Colley E, McNicol M, Bracken P. Methicillin-resistant Staphylococci in a general hospital. Lancet. 1965;285(7385):595–7.
2. Scragg JN, Appelbaum P, Govender D. The spectrum of infection and sen-sitivity of organisms isolated from African and Indian children in a Durban hospital. Trans R Soc Trop Med Hyg. 1978;72(4):325–8.
3. Geyid A, Lemeneh Y. The incidence of methicillin resistant S. aureus strains in clinical specimens in relation to their beta-lactamase producing and multiple-drug resistance properties in Addis Abeba. Ethiop Med J. 1991;29(4):149–61.
4. Foster TJ. The Staphylococcus aureus “superbug”. J Clin Investig. 2004;114(12):1693–6.
5. Gupta K, Martinello RA, Young M, Strymish J, Cho K, Lawler E. MRSA nasal carriage patterns and the subsequent risk of conversion between pat-terns, infection, and death. PLoS ONE. 2013;8(1):e53674.
6. Lowy FD. Antimicrobial resistance: the example of Staphylococcus aureus. J Clin Investig. 2003;111(9):1265–73.
7. Taiwo S, Onile B, Akanbi A II. Methicillin-resistant Staphylococcus aureus (MRSA) isolates in Ilorin, Nigeria. Afr J Clin Exp Microbiol. 2004;5(2):189–97.
8. Lin J, Morrison D, Oriade D. The discovery of a multi-resistant Staphylococ-cus haemolytiStaphylococ-cus clone in the hospital and community environment in south western Nigeria. Ostomy Wound Manage. 2005;51(1):67–70. 9. Simmons S. Effects of selective patient screening for MRSA on
overall MRSA hospital-acquired infection rates. Crit Care Nurs Q. 2011;34(1):18–24.
10. Onanuga A, Oyi A, Olayinka B, Onaolapo J. Prevalence of community-associated multi-resistant Staphylococcus aureus among healthy women in Abuja, Nigeria. Afr J Biotechnol. 2005;4(9):942–5.
11. Shibabaw A, Abebe T, Mihret A. Nasal carriage rate of methicillin resist-ant Staphylococcus aureus among Dessie Referral Hospital health care workers; Dessie, Northeast Ethiopia. Antimicrob Resist Infect Control. 2013;2(1):25.
12. Balta B, Derbie F. Nasal carriage of methicillin resistant Staphylococcus aureus strains among inpatients of Jimma hospital, South Western Ethio-pia. Ethiop J Health Sci. 2003;13(2):107–15.
13. Legese H, Kahsay AG, Kahsay A, Araya T, Adhanom G, Muthupandian S, et al. Nasal carriage, risk factors and antimicrobial susceptibility pattern of methicillin resistant Staphylococcus aureus among healthcare workers in Adigrat and Wukro hospitals, Tigray, Northern Ethiopia. BMC Res Notes. 2018;11(1):250.
14. Elemo KK, Sisay T, Shiferaw A, Fato MA. Prevalence, risk factors and mul-tidrug resistance profile of Staphylococcus aureus isolated from bovine mastitis in selected dairy farms in and around Asella town, Arsi Zone, South Eastern Ethiopia. Afr J Microbiol Res. 2017;11(45):1632–42. 15. Kahsay AG, Hagos DG, Abay GK, Mezgebo TA. Prevalence and
antimicro-bial susceptibility patterns of methicillin-resistant Staphylococcus aureus among janitors of Mekelle University, North Ethiopia. BMC Res Notes. 2018;11(1):294.
16. Dagnew M, Tiruneh M, Moges F, Tekeste Z. Survey of nasal carriage of Staphylococcus aureus and intestinal parasites among food handlers working at Gondar University, Northwest Ethiopia. BMC Public Health. 2012;12(1):837.
17. Gebremedhn G, Gebremariam TT, Wasihun AG, Dejene TA, Saravanan M. Prevalence and risk factors of methicillin-resistant Staphylococcus aureus colonization among HIV patients in Mekelle, Northern Ethiopia. Springer-Plus. 2016;5(1):877.
18. Reta A, Wubie M, Mekuria G. Nasal colonization and antimicrobial sus-ceptibility pattern of Staphylococcus aureus among pre-school children in Ethiopia. BMC Res Notes. 2017;10(1):746.
19. Reta A, Gedefaw L, Sewunet T, Beyene G. Nasal carriage, risk factors and antimicrobial susceptibility pattern of methicillin resistant Staphylococ-cus aureus among school children in Ethiopia. J Med Microbiol Diagn. 2015;4(1):1.
20. Kejela T, Bacha K. Prevalence and antibiotic susceptibility pattern of methicillin-resistant Staphylococcus aureus (MRSA) among primary school children and prisoners in Jimma Town, Southwest Ethiopia. Ann Clin Microbiol Antimicrob. 2013;12(1):11.
•fast, convenient online submission
•
thorough peer review by experienced researchers in your field
• rapid publication on acceptance
• support for research data, including large and complex data types
•
gold Open Access which fosters wider collaboration and increased citations maximum visibility for your research: over 100M website views per year
•
At BMC, research is always in progress.
Learn more biomedcentral.com/submissions
Ready to submit your research? Choose BMC and benefit from: 22. Liberati A, Altman DG, Tetzlaff J, Mulrow C, Gøtzsche PC, Ioannidis JP, et al.
The PRISMA statement for reporting systematic reviews and meta-anal-yses of studies that evaluate health care interventions: explanation and elaboration. PLoS Med. 2009;6(7):e1000100.
23. Munn Z, Moola S, Riitano D, Lisy K. The development of a critical appraisal tool for use in systematic reviews addressing questions of prevalence. Int J Health Policy Manage. 2014;3(3):123.
24. Modesti PA, Reboldi G, Cappuccio FP, Agyemang C, Remuzzi G, Rapi S, et al. Panethnic differences in blood pressure in Europe: a systematic review and meta-analysis. PLoS ONE. 2016;11(1):e0147601.
25. George BJ, Aban IB. An application of meta-analysis based on DerSimo-nian and Laird method. Berlin: Springer; 2016.
26. IntHout J, Ioannidis JP, Borm GF. The Hartung-Knapp-Sidik-Jonkman method for random effects meta-analysis is straightforward and consid-erably outperforms the standard DerSimonian-Laird method. BMC Med Res Methodol. 2014;14(1):25.
27. Knol M, Twisk JW, Beekman AT, Heine R, Snoek FJ, Pouwer F. Depression as a risk factor for the onset of type 2 diabetes mellitus. A meta-analysis. Diabetologia. 2006;49(5):837.
28. Higgins JP, Thompson SG. Quantifying heterogeneity in a meta-analysis. Stat Med. 2002;21(11):1539–58.
29. Park M, Katon WJ, Wolf FM. Depression and risk of mortality in individuals with diabetes: a meta-analysis and systematic review. Gen Hosp Psychia-try. 2013;35(3):217–25.
30. Wang J, Wu X, Lai W, Long E, Zhang X, Li W, et al. Prevalence of depression and depressive symptoms among outpatients: a systematic review and meta-analysis. BMJ Open. 2017;7(8):e017173.
31. Sarokhani D, Delpisheh A, Veisani Y, Sarokhani MT, Manesh RE, Sayehmiri K. Prevalence of depression among university students: a systematic review and meta-analysis study. Depress Res Treat. 2013;2013:373857. https ://doi.org/10.1155/2013/37385 7.
32. Emaneini M, Jabalameli F, Rahdar H, Leeuwen WBV, Beigverdi R. Nasal carriage rate of methicillin resistant Staphylococcus aureus among Iranian healthcare workers: a systematic review and meta-analysis. Revista da Sociedade Brasileira de Medicina Tropical. 2017;50(5):590–7.
33. Sadek SEA, Abdelrahman AT, Abdelkader NG, Abdelrahim M. Clinical and microbiological effect of linezolid on methicillin-resistant Staphylococcus aureus (MRSA) colonization in healthcare workers in Egypt. Middle East J Sci Res. 2013;15(10):1440–9.
34. Dulon M, Peters C, Schablon A, Nienhaus A. MRSA carriage among healthcare workers in non-outbreak settings in Europe and the United States: a systematic review. BMC Infect Dis. 2014;14(1):363.
35. Ohagim IP, Nyong EE, Moses AE. Methicillin-resistant Staphylococcus aureus nasal carriage among surgical patients, patient relatives and healthcare workers in a teaching hospital in Uyo, Southsouth Nigeria. J Adv Microbiol. 2018;8(1):1–11.
Publisher’s Note