DEMOGRAPHIC RESEARCH
VOLUME 34, ARTICLE 37, PAGES 1053
−
1062
PUBLISHED 10 JUNE 2016
http://www.demographic-research.org/Volumes/Vol34/37/ DOI: 10.4054/DemRes.2016.34.37
Descriptive Finding
On the masculinization of population: The
contribution of demographic development ‒
A look at sex ratios in Sweden over 250 years
Thomas Spoorenberg
©2016 Thomas Spoorenberg.
This open-access work is published under the terms of the Creative Commons Attribution NonCommercial License 2.0 Germany, which permits use, reproduction & distribution in any medium for non-commercial purposes, provided the original author(s) and source are given credit.
1 Introduction 1054
2 Expected changes in the sex ratio at different ages over the course
of demographic development 1054
3 Evidence from Sweden 1055
4 Towards an explanation 1056
5 Discussion 1059
Descriptive Finding
On the masculinization of population:
The contribution of demographic development
‒
A look at sex ratios
in Sweden over 250 years
Thomas Spoorenberg1
Abstract
BACKGROUND
Almost everywhere, women live longer than men, but the world population includes increasingly more men than women. This fact is observed not only in populations where gender-based discrimination is practised, but also in developed countries like Sweden.
OBJECTIVE
Whereas discrimination against female infants and women is usually given as an explanation for this paradox, demographic development (through improved survival) also plays a role. This study examines the largely unnoticed role of demographic development in the masculinization of population, taking the case of Sweden.
METHODS
Using high-quality data from the Human Mortality Database for Sweden over the last 250 years, changes in the sex ratio at various ages are described and linked to the continuing survival gains achieved over the mortality transition.
RESULTS
Thanks to the reduction of secular mortality in Sweden, the natural sex imbalance observed at birth has been progressively prolonged later in life, and the age at which women outnumber men has been postponed to older ages. Similar developments are found in Norway and Denmark.
CONCLUSIONS
The general decline of mortality is one of humanity’s biggest achievements, but the accompanying change in age- and sex-specific survival patterns, coupled with the natural sex imbalance at birth, influences the age and sex composition of a population and, therefore, the sex ratio at successive ages. In a world where each new generation
1 United Nations Population Division, U.S.A. E-Mail: [email protected]. The views expressed
can expect to enjoy a longer life than the previous one, an increasing number of men can also be expected.
CONTRIBUTION
The role of demographic development in the masculinization of population has remained largely unnoticed so far.
1. Introduction
Women are living longer than men. This is true almost everywhere in the world. Globally, under today’s mortality conditions, a woman born in 2015 can expect to live 73.38 years, against 68.92 years for men (UNPD 2015). In most human populations the female death rate is lower than that for males at almost every age of life (Vallin 2006; Wisser and Vaupel 2014). In developing countries, women experience a small disadvantage only during childbearing ages, whereas in developed countries the female advantage is observed throughout life. Yet the world population includes increasingly more men than women. Globally, the world population has become more masculine since 1950. On average, there were two more men per 100 women in 2015 than there were in 1950 (101.8 men per 100 women in 2015; 99.6 in 1950) (UNPD 2015). This trend appears to contradict the fact that women live longer, and should therefore outnumber men. Although gender-based discriminatory practices largely explain this paradox at the world level and in some world regions (Sen 1990; Bongaarts and Guilmoto 2015), demographic development also plays a role.
This short paper investigates this paradox using data for Sweden from the Human Mortality Database that covers 250 years of mortality and population development. For a long time demographers have looked at Sweden to develop and test new theoretical propositions because the country offers unique, reliable, high quality data covering a very long time period. In addition, Swedish society is known for its equal treatment of both sexes and its absence of gender-based (voluntary) discrimination, which could affect the results presented here.
2. Expected changes in the sex ratio at different ages over the course
of demographic development
biological level of the sex ratio at birth tends to be close to 105 boys per 100 girls, with the standard sex ratio at birth being between 103 and 107 boys per 100 girls, allowing for natural regional variations. If the risk of dying were similar for both sexes at all ages, the sex imbalance at birth would extend through time and the population would be male-dominated. Yet there are several factors that influence the sex ratio across the ages.
Due to biologically based characteristics (Vallin 2006), boys are born more vulnerable than girls and die in higher numbers at infant and child ages. When the overall mortality level falls, in the absence of discrimination the female advantage in infant and child mortality would normally increase (Hill and Upchurch 1995, Sawyer 2012). In other words, it is expected that, with continuing survival gains, a larger number of girls would survive and reach older ages, thus contributing to lower the sex ratio of the population. Under hypothetical conditions where the risks of dying at other older ages are identical for both sexes, one would expect a population to become more female-dominated during its mortality transition.
At young adult, adult, and older ages, men usually die in larger number than women, mostly due to exogenous behavioral and environmental factors (Vallin 2006). The initial sex imbalance at birth is therefore progressively re-adjusted before giving way to a clear female advantage. It is therefore to be expected that over the course of the mortality transition, adult women would progressively be more numerous than men and would ultimately outnumber them at older ages, thus contributing to a further feminization of the population.
3. Evidence from Sweden
Figure 1: Total sex ratio (number of men per 100 women) in the Swedish
population, 1751−2015
Source: computed based on Human Mortality Database.
4. Towards an explanation
The continuing gains in survival realized during the mortality transition imply a reduction of mortality at all ages throughout life. This achievement has strong implications for the masculinization of a population. In developed countries such as Sweden the contribution of mortality at young ages has been declining continuously and now has reached very low levels, at which further progress is hard to realize (Bongaarts 2006). In Sweden today, less than 2.5 out of 1000 newborns die before reaching one-year old, whereas 200 years ago, at the beginning of the 19th century, more than 200 newborns died before reaching their first birthday. Baby boys still experience higher mortality, but the mortality level being so low, the role of mortality at these ages becomes almost negligible in terms of the sex ratio. The natural imbalance of the sex ratio at birth is therefore prolonged later in life and contributes to the continual increase of the sex ratio in a population.
88.6
99.9 99.9
86 88 90 92 94 96 98 100 102
1750 1770 1790 1810 1830 1850 1870 1890 1910 1930 1950 1970 1990 2010
N
um
ber
of
m
en
per
100
w
om
en
With the continuing survival gains at all ages and the concentration of deaths at older ages (Fries 1980), the sex ratio at different ages has progressively converged to the level of the sex ratio at birth (Figure 2). For example, if until the early 19th century the Swedish population comprised about 90 men per 100 women at age 20, in 2015 the number is almost 105 men per 100 women. International migration can play a role in determining the sex ratio at these ages, but the extension of the original male advantage to later ages also contributes to the increasing proportion of men.
The extension of the natural male advantage later in life is a progressive process that ripples down the age range. The sex ratio at age 5 was the first to converge towards the sex ratio at birth, later followed by the sex ratio at age 20, and so on. Nowadays, the sex ratio at age 60 stands just above 100, meaning that more men than women are found at this age. The sudden drop in the sex ratio at age 80 should be interpreted keeping in mind the recent changes in mortality at older ages in Sweden (Drefahl, Ahlbom, and Modig 2014).
Figure 2: Sex ratio of different age groups (number of men per 100 women),
Sweden, 1751−2015
Source: computed based on Human Mortality Database.
40 50 60 70 80 90 100 110
1750 1770 1790 1810 1830 1850 1870 1890 1910 1930 1950 1970 1990 2010
N
um
ber
of
m
en
per
100
w
om
en
Year
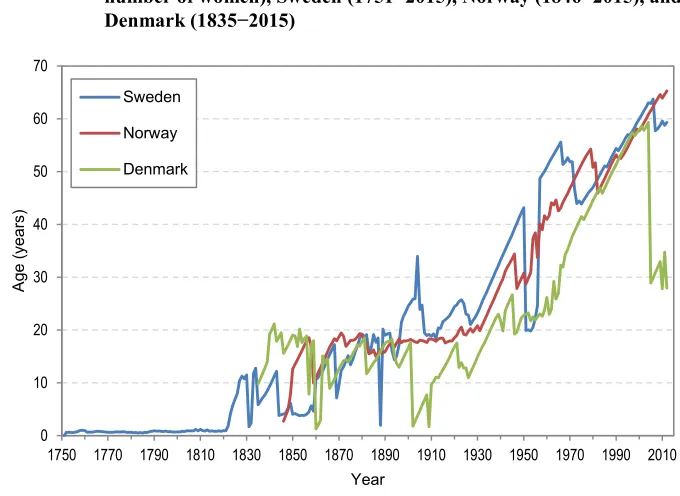
The changes displayed in Figure 2 can be summarized using the ‘parity age’. The parity age is defined as the age at which parity between the number of men and the number of women is reached, and is linearly interpolated from the two adjacent ages between which the number of men drops for the first time across all ages below the number of women. Figure 3 shows the change in the parity age for Sweden from 1751 to 2015. The parity ages for Norway and Denmark are also included for comparative purpose.
Despite temporal falls, the age at which the number of men equals the number of women has continued to increase over the last 200 years in Sweden. Until the late 19th century the ‘parity age’ was reached in the first years of life, but it has been continuously postponed, so that nowadays women do not outnumber men before age 60. A similar postponement trend in the parity age is found in Norway and Denmark, suggesting that the pattern is a general process.
Figure 3: Change in parity age (age at which the number of men equals the
number of women), Sweden (1751−2015), Norway (1846−2015), and
Denmark (1835−2015)
Source: computed based on Human Mortality Database.
0 10 20 30 40 50 60 70
1750 1770 1790 1810 1830 1850 1870 1890 1910 1930 1950 1970 1990 2010
A
ge (
year
s)
Year Sweden
5. Discussion
The paradox of an overall sex ratio increase in Sweden over more than two centuries, when mortality improvements should instead be lowering the population sex ratio, forces researchers to revisit long-term sex ratio trends for a fresh look. Comparison with Norway and Denmark suggests that the change at work is not country-specific but a general pattern.
In a population without substantial international migration skewed toward one sex, the development of the sex ratio depends largely on how men and women fare in the successive phases of the epidemiological or health transition (Omran 1971; Vallin and Meslé 2004; Vallin 2006). The general decline of mortality is one of humanity’s biggest achievements, but the accompanying change in age- and sex-specific survival patterns, coupled with the natural sex imbalance at birth, influences the age and sex composition of a population and therefore the sex ratio at successive ages. In a world where each new generation can expect to enjoy longer lives than the previous one, an increasing number of men can also be expected.
In low mortality countries like Sweden, contemporary survival improvement is mainly occurring at older ages among an increasingly heterogeneous population (Vaupel and Yashin 1985; Wilmoth et al. 2000; Rau et al. 2008; Engelman, Canudas-Romo, and Agree 2010). In such a population the natural imbalance at birth has been prolonged to later in life and the contribution of older ages in determining the number of men in the population has therefore become gradually more important.
In higher-mortality countries a similar mechanism is found, but because mortality is higher at all ages of life (but especially at infant, child, and young adult ages) the prolongation of the sex ratio at birth has not yet rippled down the age range.
In countries or regions that experience imbalance in the sex ratio at birth due to the implementation of cultural preferences for male offspring (Bongaarts 2013; Guilmoto 2015), the continuing reduction of mortality at infant and child ages and later in life will have implications for the sex ratios in the population. With continuing survival gains at all ages, the larger (imbalanced) proportion of male births will be prolonged later in life and contribute to further exacerbate the imbalance between the sexes in older age groups and in the population in general.
References
Bongaarts, J. (2006). How long will we live? Population and Development Review 32: 605−628. doi:10.1111/j.1728-4457.2006.00144.x.
Bongaarts, J. (2013). The implementation of preferences for male offspring. Population and Development Review 39: 185–208. doi:10.1111/j.1728-4457.2013.00588.x. Bongaarts, J. and Guilmoto, C.Z. (2015). How many more missing women? Excess
female mortality and prenatal sex selection, 1970−2050. Population and Development Review 41: 241–269. doi:10.1111/j.1728-4457.2015.00046.x. Chung, W. and Das Gupta, M. (2007). The decline of son preference in South Korea:
The roles of development and public policy. Population and Development Review 33: 757–783. doi:10.1111/j.1728-4457.2007.00196.x.
Drefahl, S., Ahlbom, A., and Modig, K. (2014). Losing ground – Swedish life expectancy in a comparative perspective. PLOS ONE 9: e88357.
doi:10.1371/journal.pone.0088357.
Engelman, M., Canudas-Romo, V., and Agree, E.M. (2010). The implications of increased survivorship for mortality variation in aging populations. Population and Development Review 36: 511–539. doi:10.1111/j.1728-4457.2010.00344.x. Fries, J.F. (1980). Aging, natural death, and the compression of mortality. New England
Journal of Medicine 303: 130–135. doi:10.1056/NEJM198007173030304. Guilmoto, C.Z. (2009). The sex ratio transition in Asia. Population and Development
Review 35: 519–549. doi:10.1111/j.1728-4457.2009.00295.x.
Guilmoto, C.Z. (2015). The masculinization of births. Overview and current knowledge. Population-E 70: 201–264.
Hill, K. and Upchurch, D.M. (1995). Gender differences in child health: Evidence from the Demographic and Health Surveys. Population and Development Review 21: 127–151. doi:10.2307/2137416.
Human Mortality Database (2016). University of California, Berkeley (USA), and Max Planck Institute for Demographic Research (Germany) [electronic resource]. www.mortality.org (data downloaded on 23 March 2016).
Omran, A.R. (1971). The epidemiologic transition: A theory of the epidemiology of population change. The Milbank Memorial Fund Quarterly 49: 509–538.
Rau, R., Soroko, E., Jasilionis, D., and Vaupel, J.W. (2008). Continued reductions in mortality at advanced ages. Population and Development Review 34: 747–768.
doi:10.1111/j.1728-4457.2008.00249.x.
Sawyer, C.C. (2012). Child mortality estimation: Estimating sex differences in childhood mortality since the 1970s. PLOS Medicine 9(8): e1001287.
doi:10.1371/journal.pmed.1001287.
Sen, A.K. (1990). More than 100 million women are missing. New York Review of Books 20: 61–66.
United Nations Population Division (UNPD) (2015). World Population Prospects: The 2015 Revision. DVD Edition. (Population Division, Department of Economic and Social Affairs, United Nations, New York, 2015).
Vallin, J. (2006). Mortality by age, sex, and gender. In: Caselli, G., Vallin, J., and Wunsch, G. (eds.). Demography: Analysis and Synthesis: A Treatise in Population Studies. Amsterdam: Elsevier: 177–194.
Vallin, J. and Meslé, F. (2004). Convergences and divergences in mortality. A new approach to health transition. Demographic Research Special Collection 2, Article 2: 11–44. doi:10.4054/DemRes.2004.S2.2.
Vaupel, J.W. and Yashin, A.I. (1985). Heterogeneity’s ruses: Some surprising effects of the selection on population dynamics. The American Statistician 39: 176–185.
doi:10.2307/2683925.
Wilmoth, J.R., Deegan, L.J., Lundström, H., and Horiuchi, S. (2000). Increase of maximum life-span in Sweden, 1861–1999. Science 289: 2366–2368.
doi:10.1126/science.289.5488.2366.