Article
Classical and Novel TSPO Ligands for the
Mitochondrial TSPO can Modulate Nuclear Gene
Expression: Implications for Mitochondrial
Retrograde Signaling
Yasin N1†, Veenman L1†*, Singh S2, Azrad M1, Bode J3,Vainshtein A 1, Caballero B1#, Marek I2, Gavish M1*
1 Faculty of Medicine, Department of Neuroscience, Technion – Israel Institute of Technology, Haifa 3200003, Israel
2 Faculty of Chemistry, Department of Organic Chemistry, Technion – Israel Institute of Technology, Haifa 3200003, Israel;
3 Schaller Research Group at the University of Heidelberg and the German Cancer Research Center (DKFZ), Im Neuenheimer Feld 581, 69120 Heidelberg, Germany
* Correspondence: [email protected]; [email protected] Tel.: Technology +972-4-8295275, +972-4-8295276
# New address : Caballero Beatriz, Department of Morphology and Cell Biology, Faculty of Medicine, University of Oviedo. Julian Claveria, 33008- Oviedo (Asturias) Spain
† These authors contributed equally to this work.
Abstract: It is known that knockdown of the mitochondrial 18 kDa translocator protein (TSPO) as well as TSPO ligands modulate various functions, including functions related to cancer. To study the ability of TSPO to regulate gene expression regarding such functions, we applied microarray analysis of gene expression to U118MG glioblastoma cells. Within 15 minutes, the classical TSPO ligand PK 11195 induced changes in expression of immediate early genes and transcription factors. These changes also included gene products that are part of the canonical pathway serving to modulate general gene expression. These changes are in accord with reverse transcriptase (RT) real-time -PCR. At the time points of 15, 30, 45, and 60 minutes, as well as 3 and 24 hours of PK 11195 exposure, the functions associated with the changes in gene expression in these glioblastoma cells covered well known TSPO functions. These functions included cell viability, proliferation, differentiation, adhesion, migration, tumorigenesis, and angiogenesis. This was corroborated microscopically for cell migration, cell accumulation, adhesion, and neuronal differentiation. Changes in gene expression at 24 hours of PK 11195 exposure were related to downregulation of tumorigenesis and upregulation of programmed cell death. In the vehicle treated as well as PK 11195 exposed cell cultures, our triple labeling showed intense TSPO labeling in the mitochondria but no TSPO signal in the cell nuclei. Thus, mitochondrial TSPO appears to be part of the mitochondria-to-nucleus signaling pathway for modulation of nuclear gene expression. The novel TSPO ligand 2-Cl-MGV-1 appeared to be very specific regarding modulation of gene expression of immediate early genes and transcription factors.
Keywords: modulation of nuclear gene expression; mitochondrial 18 kDa translocator protein (TSPO); TSPO ligand; PK 11195; 2-Cl-MGV-1; retrograde mitochondrial-nuclear signaling pathway; microscopy; mitochondria; cell nucleus
1. Introduction
various molecular biological mechanisms. In 2006, the name translocator protein, and its acronym (TSPO), was generally adopted to reflect TSPO's participation in transport of molecules over the outer mitochondrial membrane [7,8,12]. Import into mitochondria by the TSPO includes cholesterol, protoporphyrin IX, and other tetrapyrroles [7,12,13]. Release from the mitochondria regulated by TSPO includes Ca++, ATP, and cytochrome c [5,14,15,16]. TSPO is involved in life essential functions, such as respiration, photosynthesis, tetrapyrrole metabolism, and programmed cell death [6,8,17,18]. Extensive studies have shown that TSPO is involved in apoptosis, gene expression, reactive oxygen species (ROS) generation, ATP production, regulation of the mitochondrial membrane potential (ΔΨm), heme synthesis, mitochondrial cholesterol transport, neurosteroid synthesis, glutamate metabolism, cell proliferation, cell adhesion, cell migration, and cell differentiation [3,5,7,12,19,20]. In animals and humans TSPO shows essential roles in inflammatory, immune, and stress responses, as well as in several neuropathological disorders, including neurodegeneration and brain cancer [4,7,12,21]. Based on this background, we postulated that regulation of nuclear gene expression by the TSPO can go a long way to explain TSPO's numerous functional effects [18,22].
It has been shown before that regulation of the TSPO by siRNA or application of TSPO ligands can affect gene expression in human cells in culture and bacteria [19,20,21,22,23,24,25,26]. The question we address with this study is whether TSPO is potentially directly involved in mitochondrial capability to regulate nuclear gene expression. First of all the question became prominent how TSPO can participate in so many functions as mentioned above [1,2,3,13]. We hypothesized that the potential specific capability of TSPO to regulate gene expression may be the basis of TSPO's general capability to regulate numerous functions [13,18,20,22]. The other angle is that it is well known that mitochondria are able to regulate nuclear gene expression. This phenomenon is called the "retrograde mitochondrial-nuclear pathway for regulation of nuclear gene expression" [27,28,29,30,31]. It is primarily considered as a cellular response to stressors, as the second leg of a nuclear-mitochondrial-nuclear loop. For brevity, from here on we will refer to it as mitochondria-to-nucleus signaling.
Regarding this pathway, mitochondrial ROS generation and loss of Δψm have been reported to take part in mitochondria-to-nucleus signaling [27,32]. This leads to changes in levels of ATP and NADH and the release of Ca++, which activates calcium-sensitive proteins, such as calmodulin and calcineurin. Further downstream this leads to the activation of immediate early genes and transcription factors [28,29,33,34]. This outline of the mitochondria-to-nucleus pathway mirrors well reported observations regarding TSPO's role in mitochondrial functions and mechanisms. It has been demonstrated that TSPO regulates mitochondrial ROS generation, Δψm transitions, and ATP production [10,11,35,36]. This was originally studied in TSPO's function of initiating programmed cell death [3,5,37]. Furthermore, the TSPO ligand PK 11195 induces mitochondrial permeability transition pore opening, thus allowing release of Ca++ from the mitochondria into the
cytosol [14,38,39]. It has also been suggested that TSPO can regulate NADPH oxidase (NOX) activity [40,41,42,43]. Thus, by regulating ROS generation, Δψm transitions, ATP production, Ca++
release, and NADH levels, TSPO may be a key mitochondrial protein providing mitochondria the capability to regulate gene expression in the cell nucleus.
expression. As we are working with glioblastoma cells (U118MG), one interest also includes how such changes in gene expression regulated by TSPO could affect tumorigenicity of these cells in this paradigm. For this purpose, we applied the TSPO ligand PK 11195 (25 µM) for several exposure times (15, 30, and 45 minutes, and 1, 3, and 24 hours). Then, with the aid of microarray, we assayed changes in gene expression. The choice of 25 µM of PK 11195 is based on several previous studies that showed no adverse effects with this concentration, while it counteracts programmed cell death otherwise induced by various agents [e.g. 5,10,13,20, 39]. Thus, in this paradigm PK 11195 at 25 µM only presents beneficial functional effects, including promotion of cell viability, and no disruptive lethal effects. In this study, apart from targeting the immediate question of regulation of nuclear gene expression by TSPO ligands, we also address the question whether modulation of gene expression may be associated with well-known TSPO functions. This was another reason to focus on PK 11195 at 25 µM, as by application of this concentration we expected to be better able to connect the present gene expression study with previous functional studies and their results that applied the same PK 11195 concentration. For these previous studies, dose response assays for application to U118MG cells were applied, which showed that 25 µM had optimal effects, without confounding side effects apparent with high doses, while lower doses in the paradigm of programmed cell death showed no effects by themselves [e.g. 5,10,13,20, 44]. We also assayed whether functions predicted by the changes in gene expression could indeed also be actually observed in the present study (in particular functions that previously have not been considered part of the TSPO repertoire). Apart from the classical TSPO ligand PK 11195, we also assayed the effects of the more advanced TSPO ligand, 2-Cl-MGV-1 [13, 20, 45 ], to enhance the generality of the results.
While TSPO location in mitochondria has received a lot of attention, it is also known that TSPO can be present in perinuclear locations [7, 46,47,48]. To investigate this further, we applied confocal microscopy to triple labeling of nuclei, mitochondria, and TSPO. Location restricted to the mitochondria would be supportive of TSPO's role in mitochondria-to-nucleus signaling for regulation of nuclear gene expression. Intranuclear location could suggest a nuclear TSPO function, different from a mitochondrial TSPO function. Other intracellular locations could suggest a more elaborate involvement of TSPO in regulation of gene expression. As an extra, the study would show whether TSPO function associated with modulation of nuclear gene expression could correlate with known TSPO functions, and might possibly also reveal hitherto unknown TSPO functions.
2. Results
The presentation of the Results is divided into 5 parts : 1) PK 11195 effects on gene expression in general ; 2) Potential effects of such gene expression changes on function, uncovered by pathway analysis ; 3) Microscopic correlates at cellular and intracellular levels in association with changes in gene expression due to PK 11195 exposure ; 4) Actual observations of phenotypic effects of PK 11195 exposure that were predicted by pathway analysis ; 5) Comparison with effects of a more advanced TSPO ligand (2-Cl-MGV-1) on gene expression. For pathway analysis, we used the 'Regulator Effects' analytic (IPA®) to gain more insights into the affected functions associated with the changes in gene expression, as outlined in the Methods.
PK 11195 effects on gene expression in general
paradigm. This second file named 'GSE85697' is at : http://www.ncbi.nlm.nih.gov/geo/query/acc.cgi?acc=GSE85697.
As mentioned in the Introduction, we applied 25 µM of PK 11195 as this was an effective concentration determined in previous studies, in particular regarding regulation of programmed cell death, including modulation of mitochondrial membrane potential (ΔΨm), reactive oxygen species (ROS) generation, and cytochrome c release from mitochondria of U118MG cells. Importantly, this concentration also precludes confounding side effects [5]. Thereby, we assumed we would be able to associate our results with a previously established context [2,13]. First of all, we attained a general overview of gene expression changes following application of 25 µM of PK 11195, including magnitude and direction of changes in gene expression (Table 1). This provided a detailed time-course of changes in gene expression (Table 1).
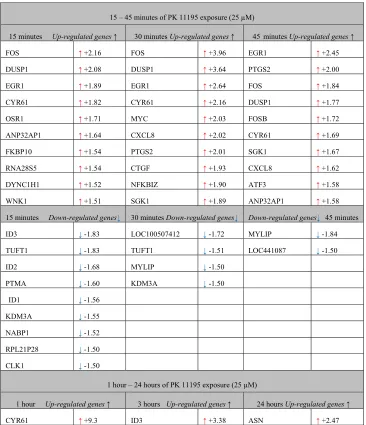
Table 1. Gene symbols of up-regulated genes and down-regulated genes with their expression changed due to exposure of U118MG cells to PK 11195 (25 µM) (in comparison to vehicle control in an exposure time related fashion) (cut off of 1.5): for 15 min, 30 min, 45 min, 60 min, 3 hours, and 24 hours. These genes were also shown to be part of functional pathways, as analyzed with 'Regulator Effects' analytic (IPA®). See Table 2 for a summary of functional effects in general potentially affected by such gene expression changes. Supplementary files provide further detail.
15 – 45 minutes of PK 11195 exposure (25 µM)
15 minutes Up-regulated genes ↑ 30 minutes Up-regulated genes ↑ 45minutes Up-regulated genes ↑
FOS ↑ +2.16 FOS ↑ +3.96 EGR1 ↑ +2.45
DUSP1 ↑ +2.08 DUSP1 ↑ +3.64 PTGS2 ↑ +2.00
EGR1 ↑ +1.89 EGR1 ↑ +2.64 FOS ↑ +1.84
CYR61 ↑ +1.82 CYR61 ↑+2.16 DUSP1 ↑ +1.77
OSR1 ↑+1.71 MYC ↑ +2.03 FOSB ↑ +1.72
ANP32AP1 ↑ +1.64 CXCL8 ↑ +2.02 CYR61 ↑ +1.69
FKBP10 ↑+1.54 PTGS2 ↑ +2.01 SGK1 ↑ +1.67
RNA28S5 ↑ +1.54 CTGF ↑ +1.93 CXCL8 ↑ +1.62
DYNC1H1 ↑ +1.52 NFKBIZ ↑ +1.90 ATF3 ↑ +1.58
WNK1 ↑ +1.51 SGK1 ↑ +1.89 ANP32AP1 ↑+1.58
15 minutes Down-regulated genes↓ 30 minutes Down-regulated genes↓ Down-regulated genes↓ 45 minutes
ID3 ↓ -1.83 LOC100507412 ↓ -1.72 MYLIP ↓ -1.84
TUFT1 ↓ -1.83 TUFT1 ↓ -1.51 LOC441087 ↓ -1.50
ID2 ↓ -1.68 MYLIP ↓ -1.50
PTMA ↓ -1.60 KDM3A ↓ -1.50
ID1 ↓ -1.56
KDM3A ↓ -1.55
NABP1 ↓ -1.52
RPL21P28 ↓ -1.50
CLK1 ↓ -1.50
1 hour – 24 hours of PK 11195 exposure (25 µM)
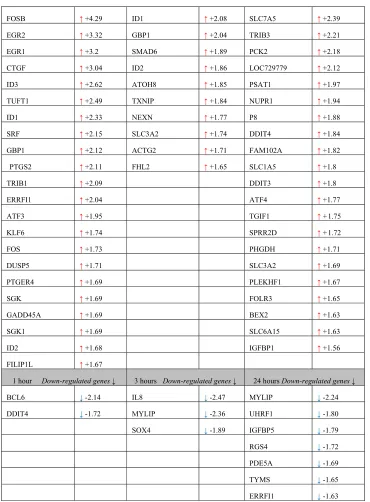
1 hour Up-regulated genes ↑ 3 hours Up-regulated genes ↑ 24 hours Up-regulated genes ↑
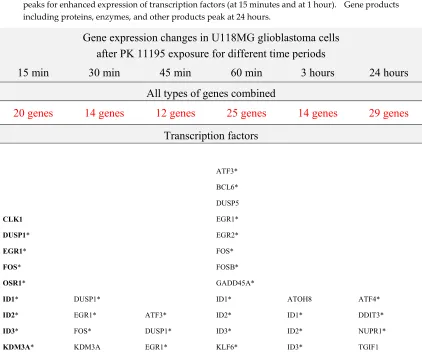
After having determined changes in gene expression due to PK 11195 exposure in a time dependent fashion, we moved on to assay effects on function in general, in particular regarding induction of changes in gene expression and potentially subsequent functional effects (Table 2). Table 2 presents the gene symbols of the genes with significantly changed expression due to PK 11195 treatment, together with the general nature of the gene products (transcription factors, proteins, enzymes, and other products). Thus, as table 1 provides a detailed time-course of changes in gene expression, table 2 provides a detailed time course of related functional effects typically associated with the genes in question.
In short, starting at the left hand column of Table 2 :
• Within 15 minutes, 20 genes significantly changed their expression rate in comparison to vehicle control, and 11 of them code for transcription factors, the other 9 code for proteins, enzymes, and other products.
FOSB ↑ +4.29 ID1 ↑ +2.08 SLC7A5 ↑ +2.39
EGR2 ↑ +3.32 GBP1 ↑ +2.04 TRIB3 ↑ +2.21
EGR1 ↑ +3.2 SMAD6 ↑ +1.89 PCK2 ↑ +2.18
CTGF ↑ +3.04 ID2 ↑ +1.86 LOC729779 ↑ +2.12
ID3 ↑+2.62 ATOH8 ↑ +1.85 PSAT1 ↑ +1.97
TUFT1 ↑ +2.49 TXNIP ↑ +1.84 NUPR1 ↑ +1.94
ID1 ↑ +2.33 NEXN ↑ +1.77 P8 ↑ +1.88
SRF ↑ +2.15 SLC3A2 ↑ +1.74 DDIT4 ↑ +1.84
GBP1 ↑ +2.12 ACTG2 ↑ +1.71 FAM102A ↑ +1.82
PTGS2 ↑ +2.11 FHL2 ↑ +1.65 SLC1A5 ↑ +1.8
TRIB1 ↑+2.09 DDIT3 ↑ +1.8
ERRFI1 ↑ +2.04 ATF4 ↑ +1.77
ATF3 ↑ +1.95 TGIF1 ↑ +1.75
KLF6 ↑ +1.74 SPRR2D ↑ +1.72
FOS ↑+1.73 PHGDH ↑ +1.71
DUSP5 ↑ +1.71 SLC3A2 ↑ +1.69
PTGER4 ↑ +1.69 PLEKHF1 ↑ +1.67
SGK ↑ +1.69 FOLR3 ↑ +1.65
GADD45A ↑ +1.69 BEX2 ↑ +1.63
SGK1 ↑ +1.69 SLC6A15 ↑ +1.63
ID2 ↑ +1.68 IGFBP1 ↑ +1.56
FILIP1L ↑+1.67
1 hour Down-regulated genes ↓ 3 hours Down-regulated genes ↓ 24 hours Down-regulated genes ↓
BCL6 ↓ -2.14 IL8 ↓ -2.47 MYLIP ↓ -2.24
DDIT4 ↓ -1.72 MYLIP ↓ -2.36 UHRF1 ↓-1.80
SOX4 ↓ -1.89 IGFBP5 ↓ -1.79
RGS4 ↓-1.72
PDE5A ↓ -1.69
TYMS ↓ -1.65
• After 30 minutes (indicated in the second column) 14 genes changed significantly their expression rate from vehicle control. At this time point the number of genes coding for transcription factors is 6, the other 8 genes code for proteins, enzymes, and other products. • After 45 minutes of PK 11195 exposure (indicated in the third column), 12 genes have their
expression changed significantly from vehicle control, 5 of them coding for transcription factors, the other 7 genes code for proteins, enzymes, and other products.
• After 1 hour (indicated in the fourth column), 25 genes significantly changed their expression rate, and 14 of them code for transcription factors, the other 11 code for proteins, enzymes, and other products.
• After 3 hours (indicated in the fifth column), 14 genes changed significantly their expression rate from vehicle control. The number of genes coding for transcription factors at this time point is 6, the other 8 genes code for proteins, enzymes, and other products.
• After 24 hrs of PK 11195 exposure (indicated in the sixth column), 29 genes have their expression changed significantly from vehicle control. The number of genes coding for transcription factors is 6 after 24 hrs of PK 11195 exposure, the remaining majority of the genes (23 genes) codes for proteins, enzymes, and other products at this time point. Indeed, the biggest numbers of gene expression changes for proteins, enzymes, and other products is after 24 hrs.
Table 2. Gene symbols of the genes with changed expression after15 min, 30 min, 45 min, 60 min, 3 hours, and 24 hours of PK 11195 exposure (of 25 µM), arranged according to their overall functions as analyzed with 'Regulator Effects' analytic (IPA®). These overall functions are listed as: transcription factors, proteins, enzymes, and other products. Asterisks (*) indicate genes associated with programmed cell death. Other products include pseudogenes, ribosomal factors, etc. Further, the function of not all gene products is fully known. This time course presents 2 peaks for enhanced expression of transcription factors (at 15 minutes and at 1 hour). Gene products including proteins, enzymes, and other products peak at 24 hours.
Gene expression changes in U118MG glioblastoma cells
after PK 11195 exposure for different time periods
24 hours
3 hours
60 min
45 min
30 min
15 min
All types of genes combined
TRIB3* UHRF1 (6 genes) SOX4 SMAD6* (6 genes) SRF TRIB1* (14 genes) FOS* FOSB* (5 genes) MYC* NFKBIZ* (6 genes) NABP1 PTMA* (11 genes)
Proteins, enzymes, and other products
ASNS* BEX2* DDIT4* ERRFI1 FAM102A FOLR3 IGFBP1* IGFBP5* LOC729779 MYLIP PCK2 PDE5A PHGDH PLEKHF1 P8 PSAT1 RGS4 SLC1A5 SLC3A2 SLC6A15 SLC7A5 SPRR2D TYMS (23 genes) ACTG FHL2* GBP1 IL8 MYLIP NEXN SLC3A2 TXNIP* (8 genes) CTGF* CYR61* DDIT4* ERRFI1 GBP1 FILIP1L PTGER4 PTGS2* SGK SGK1* TUFT1 (11 genes) ANP32AP1 CXCL8 CYR61* LOC441087 MYLIP PTGS2* SGK1* (7 genes) CTGF* CXCL8 CYR61* LOC100507412 MYLIP PTGS2* SGK1* TUFT1 (8 genes) ANP32AP1 CYR61* DYNC1H1* FKBP10 MIR22HG RNA28S5 RPL21P28 TUFT1 WNK1 (9 genes)
As TSPO is well known to regulate programmed cell death, in Table 2 is also indicated with asterisks (*) which genes can be associated with programmed cell death. At every time point within the first hour of PK 11195 exposure, more than half of the genes with significantly changed gene expression are associated with programmed cell death. This number is smaller at 3 hours and 24 hours of PK 11195 exposure.
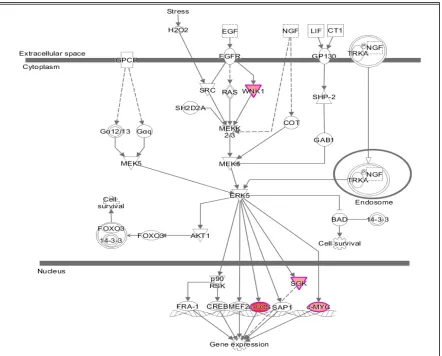
We used the 'Regulator Effects' analytic (IPA®) to gain more insights into the potentially affected functions associated with the changes in gene expression. This showed that the products of at least some of the genes having their expression modulated after 15 minutes of exposure to PK 11195 are part of the canonical pathway for regulation of gene expression (Figure 1). These genes include WNK1, FOS, SGK, and MYC. Thus it appears that regulation or enabling of changes in nuclear gene expression in general indeed is one of TSPO's functions.
In Figure 2, we established the time response curves of these 4 genes (WNK1, FOS, SGK, and MYC) that are highlighted in the canonical pathway for induction of gene expression changes presented in Figure 1, together with the 3 genes in Table 1 that showed most pronounced changes in gene expression (FOS, DUSP1, EGR1). FOS, DUSP1, and EGR1 also are among the immediate early genes and transcription factors presented in Table 2. Note: the immediate early gene is FOS is also part of the canonical pathway for induction of gene expression changes. Interestingly, the immediate early genes FOS, DUSP1, and EGR1 consistently showed enhanced gene expression after 15, 30, and 45 minutes of exposure to PK 11195 (Figure 2A). Enhanced expression of WNK1, one of the initiators of the canonical pathway for gene expression, already peaks at 15 minutes. FOS, MYC, and SGK that are part of the intranuclear end of the canonical pathway for gene expression peak their expression at 30 min. DUSP1 also peaks at 30 min. EGR1 has a "small" peak at 30 minutes and a "high" peak at 60 minutes. Real time, reverse transciptase (RT) -PCR data showed increases in expression of FOS and DUSP1 compared to control by 7.5 fold and 3.5 fold, respectively, corroborating the microarray data. In some detail, Figure 2B gives the numbers of the Ct's of FOS and DUSP1, showing that RT-PCR also gives significant differences for the expression of these genes at 30 minutes of exposure as microarray also showed. Figure 2C gives the fold changes provided by the 2^-ΔΔct analysis of the FOS and DUSP1 expression at 30 minutes measured with RT-PCR. Note regarding figure 2C, since the samples vehicle and treated groups are not paired we are under obligation to use their averages for calculation of 2^-ΔΔct which thus gives only one data point for each gene presented by the columns in figure 2C, and consequently no error bars. It is for this reason that we also provide figure 2B, which does give the SD's of the Ct's of FOS and DUSP1 expression.
Figure 1. Specific elements of the canonical pathway for modulation of gene expression that are activated after 15 min of exposure of U118MG cells to 25 µM of PK 11195, as uncovered by 'Regulator Effects' analytic (IPA®). The gene products of the genes WNK1, FOS, SGK, and MYC that are activated by the TSPO ligand PK 11195 all are part of canonical pathways that converge on the final function of gene expression regulation. Furthermore, the statistically significant enhancements of expressions of the genes WNK1, FOS, SGK, and MYC all peak within one hour of exposure to PK 11195 (see Figure 2).
(Ct) Vehicle PK 11195 B2M 22.10 ± 0.85 21.85 ± 0.21 n.s. FOS 29.35 ± 0.07 26.20 ± 0.28 *** DUSP1 24.90 ± 0.42 22.85 ± 0.21 **
B
C
Figure 2. Effects of PK 11195 exposure on several immediate early genes of U118MG cells. A)
Time course of gene expression for gene products well known to take part in the initiation of modulation of gene expression assayed with microarray. These genes (WNK1, FOS, DUSP1, EGR1, MYC, SGK1) all present a peak of increased expression within half an hour of exposure of U118MG cells to 25 µM of PK 11195. As the data for 15 min, 30 min, and 45 min are obtained from one microarray and for 1 hour, 3 hours, and 24 hours obtained from another microarray, a bar is placed between 45 and 60 minutes as a separation between the two. (Each micro array had its own untreated control as detailed in the Methods' section). B) Real-time RT-PCR analysis (Ct) of FOS, DUSP1, and B2M expression in glioblastoma cells after 30 min exposure to 25 µM of PK 11195. The presentation of the Ct data as means ± SD. *** p < 0.001, ** = p < 0.01, n = 2 (One way ANOVA, posthoc Bonferroni, multiple comparisons) shows the statistical significances of the differences between vehicle (i.e. untreated control) and PK 11195 (i.e. the treated groups) for FOS and DUSP. Each member of the biological duplicates is the average of 2 technical duplicates. Biological duplicates means cells grown in 2 different wells i.e. truly independent measurements. Technical duplicates means two measurements on the same biological sample (to achieve better accuracy); their average in the end thus is just one measurement. C) Fold change (2^-ΔΔct) of FOS and DUSP1 expression after exposure to PK 11195 is 7.5 and 3.5, respectively, compared to untreated control (vehicle).
Table 3. Functional effects implied by the gene expression modulated by PK 11195. This was acquired by application of 'Regulator Effects' analytic (IPA®). The time points of 15 min, 30 min, 45 min, 1 hr, 3 hrs, and 24 hrs applied in this study are given, providing a time-course of functional changes. (The modulated gene expression itself is presented in Tables 1,2.) In the appendices more detailed presentations of the outcomes of 'Regulator Effects' analytic (IPA®) are given for each time point. Functions that are upregulated are given here in bold red, functions that are down regulated are given in blue.
15 min
30 min
45 min
1 hour
3 hours
24 hours
0 2 4 6 8
Vehicle PK 11195 FOS DUSP1
Fold
Gene expression modulation Binding of protein binding site Transactivation of RNA Endothelial cell development Cell viability Accumulation of cells Binding of protein binding site Synthesis of DNA Differentiation of connective tissue cells Development of neurons Formation of cells Microtubule dynamics Chemotaxis of cells Cell movement of fibroblast cell lines Metastasis of tumor cell lines Abdominal neoplasm Proliferation of lymphocytes Growth of tumor Cell viability Metabolism of carbohydrate Inflammation of body region Synthesis of DNA Development of neurons Formation of cellular protrusions Angiogenesis Proliferation Migration Cell growth Apoptosis of fibroblast cell lines Malignant solid tumor S phase Cell cycle progression of fibroblast cell lines Development of cardiovascula r system Cell viability Formation of cellular protrusions Growth of malignant tumor Proliferation of tumor cells Formation of cells Development of reproductive system
Cell death of central nervous system cells Apoptosis of fibroblasts Apoptosis of myeloid cells Apoptosis of muscle cell lines Necrosis of epithelial tissue Migration of colon cancer cell lines Cell movement of leukocyte cell lines Migration of smooth muscle cells Migration of phagocytes Chemotaxis Cell viability Development of epithelial tissue Proliferation of leukocyte cell lines Activation of leukocytes Inflammatory response Accumulation of leukocytes
Cell death of fibroblast cell lines Apoptosis of kidney cell lines Apoptosis of epithelial cell lines Abdominal cancer Digestive system cancer Growth of digestive organ tumor Growth of malignant tumor Epithelial cancer Proliferation
Proliferation of leukemia cell lines
Activation of tumor cell lines
The functional effects displayed in Table 3 are provided by the downstream components ('Effects'), given by the application of 'Regulator Effects' analytic (in IPA®) to our data. This gives insights into potential phenotypic and physiological effects that may result from the changes in gene expression due to exposure of U118MG cells to 25 µM of PK 11195, including the time-course of the phenotypic and physiological changes. The gene expression data for each time point, provided by the microarray assays, is given in the 'Data Sets' of the figures that present the 'Regulator Effect'. In the body of the text, these figures are given only for 15 minutes and 24 hours of PK 11195 exposure (Figures 3-5). The 'Regulators' and 'Effects' present what is known regarding upstream regulation and downstream effects of these genes. For the complete overview of the time points of 15 min, 30 min, 45 min, 1 hr, 3 hrs, and 24 hrs, providing for the time course of these events, see the appendices. These appendices present 'Data Sets', 'Regulators', and 'Effects' for each time point.
As examples in the body of the Results, the 'Effects' are presented in the bottom tiers of Figures 3 – 5 for PK 11195 exposures of 15 minutes and 24 hours. The 'Effects' present the functional, phenotypic, and disease related effects that are known to be under control of the genes with changed expression in our study. The middle tiers of these Figures 3 – 5 present the genes with changed expression determined in our study (the 'Data Sets') as exemplified by 'Regulator Effects' analytic (IPA®). The 'Regulators' presented in the top tiers of these diagrams of Figures 3 – 5 are factors (genes, RNAs, proteins) that reportedly can modulate expression of the genes of our 'Data Sets'. As mentioned, the appendices also show the assayed time points between 15 minutes and 24 hours.
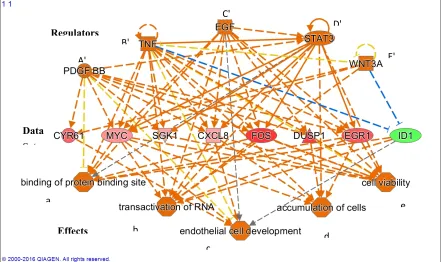
Figure 3 presents the effects associated with changes in gene expression of 15 minutes of PK 11195 exposure, as determined with 'Regulator Effects' analytic (in IPA®). The middle tier presents the genes showing significantly changed expression ('Data Set' in the middle tier). The 'Effects' presented in the bottom tier indicate that, due to the significant changes in gene expression presented in the 'Data Set', the following general functions can be upregulated: (1) Binding of protein binding site; (2) Transactivation of RNA; (3) Endothelial cell development; 4) Accumulation of cells; and (5) Cell viability. The top tier presents the 'Regulators' known to be associated with these 'Effects' and the genes of the 'Data Set'.
• Regarding functional effects at 15 minutes, in addition to upregulation of gene expression in genera,l several functions appeared to be affected. In particular, binding of protein binding site, transactivation of RNA, cell development, cell viability, and accumulation of cells (Table 3, Figure 3). As seen in Figure 3, 15 minutes of PK 11195 activates a super-assembly including 5 Regulators, 8 genes, and 5 Effects. In Figures 1 and 2 is shown that PK 11195 application for 15 minutes affects the canonical pathway for regulation of gene expression.
• Functional effects at 30 minutes appeared to be more varied than at 15 minutes of PK 11195 exposure. For simplification, these effects can be classified as : binding of protein binding site, cell division and proliferation, cell viability, metabolism, cell differentiation, cell motility, tumorigenicity, and tissue inflammation. These functions are listed in more detail in Table 3. The super-assembly that can be distinguished at 30 minutes is elaborate and includes 26 Regulators, 19 genes, and 15 Effects. This super-assembly is provided in the supplementary files.
• After 45 minutes, cell differentiation effects appeared to be the core functional aspect of the gene expression changes, as well as angiogenesis, proliferation, migration, and cell growth (Table 3). The super-assembly seen at 45 minutes is relatively small, 9 Regulators, 9 genes, and 3 Effects (provided in the supplementary files). Both the 30 and 45 minutes of PK 11195 exposures caused gene expression changes associated with the canonical pathway for angiogenesis, also provided in the supplementary files.
• After 1 hour, the functional effects in general appeared to include : upregulation of cell cycle, proliferation, cell differentiation, cell viability, and tumorigenesis, but also programmed cell
Regulators
Data S t
Effects
A'
B'
C'
D'
E'
a
b
c
d
death . These functions are listed in more detail in Table 3. The super-assembly seen at 1 hour includes 19 Regulators, 29 genes, and 12 Effects (provided in the supplementary files). • After 3 hours, the general effect due to changes in expression of the various genes after
exposure of U118MG cells to 25 µM of PK 11195 appears to imply a less tumorigenic phenotype. The majority of the 'Effects' of 3 hours of PK 11195 exposure can be classified as down
regulation. This down regulation relates to (1) Migration, (2) Inflammatory response, (3) Proliferation, (4) Development, including cell differentiation, (4) Cell viability, and (5)
Tumorigenesis. These 'Effects' after 3 hours are virtually the opposite from those seen after the shorter PK 11195 exposures. These functions are listed in more detail in Table 3. In contrast, programmed cell death is still upregulated, as was also seen after 1 hour of PK 11195 exposure. These functions are listed in more detail in Table 3. The super-assembly activated by 3 hours of PK 11195 exposure includes 23 Regulators, 30 genes, and 18 Effects, presented in the supplementary files.
• After 24 hours of PK 11195 exposure, pathway analysis with the ‘Regulator Effects' analytic (IPA®) indicated that due to the significant changes in gene expression only the following general function is down-regulated : tumorigenicity (Figure 4). Several separate pathways were revealed regarding tumorigenicity, each one including just one 'Regulator' and a small set of genes forming the 'Data Set' (Figures 4A,B,C). Additional figures in the appendix give additional, somewhat more complicated information i.e. 2 or 3 'Regulators' together modulating 'Data Sets' of a dozen to several dozen genes (appendix). These figures also impinge on the general theme of reduced tumorigenicity. Thus, after 24 hours of PK 11195 exposure no extensive super-assembly was recognized, but several independent assemblies downregulating several aspects of tumorigenicity and programmed cell death.
Regarding programmed cell death, as seen with shorter PK 11195 exposure times, also after 24 hrs of PK 11195 exposure the ‘Regulator Effects' analytic (IPA®) indicated significant changes in gene expression associated with upregulation of programmed cell death (Figure 5). Also in Table 2 genes associated with apoptosis are indicated for all time points.
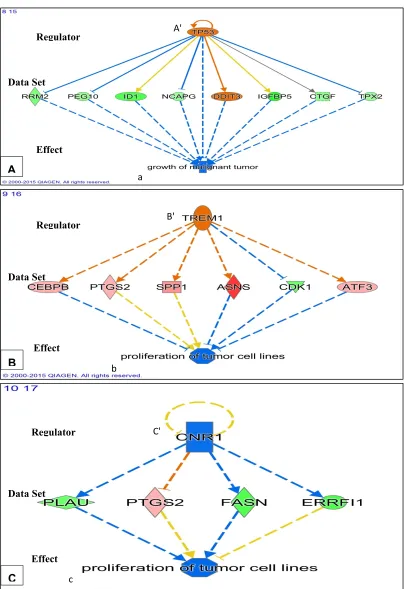
Figure 4. Potential effects on tumorigenicity due to gene expression following 24 hrs of exposure of U118MG cells to PK 11195 (25 µM). As found with Regulator Effects analyticIPA® applying adjusted p ≤ 0.05, in A,B,C, individual 'Regulators' (given in the upper tiers) are related to specific groups of genes with significantly changed expression ('Data Sets' given in the middle tiers), together with their particular downstream functions ('Effects' in the bottom tiers), namely, suppression of
A'
B'
C' a
b
c
Regulator
Regulator
Regulator Effect
Effect Data Set
Data Set
Data Set
Effect
A
B
growth of malignant tumor (in A) and suppression of proliferation of tumor cell lines (in B and C). Color coding: pink/orange = upregulated, blue/green = down regulated. The configurations in seen in A – C can be considered assemblies.
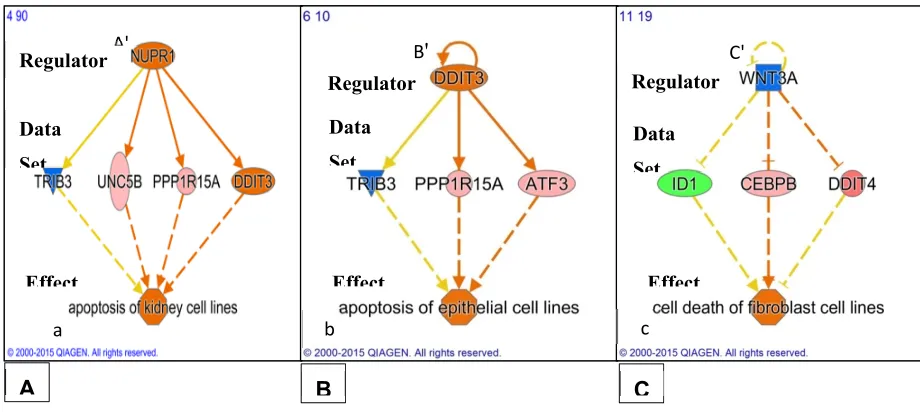
Figure 5. Potential effects on programmed cell death due to gene expression following 24 hrs of exposure of U118MG cells to PK 11195 (25 µM). As analyzed with Regulator Effects analytic; IPA®; applying adjusted p ≤ 0.05), in A,B,C, individual 'Regulators' (given in the upper tiers) are related to specific groups of genes with significantly changed expression ('Data Sets' given in the middle tiers), together with their particular downstream functions ('Effects' in the bottom tiers), namely, stimulation of apoptosis of kidney cell lines (in A), stimulation of apoptosis of epithelial cell lines (in B), stimulation of cell death of fibroblast cell lines (in C). Each mentioned separate set can be considered an assembly of pathways running from 1 or few Regulators via a number of genes to affect not more than 1 or 2 specific functions. Color coding: pink/orange = upregulated, blue/green = down regulated. The configurations in seen in A – C can be considered assemblies.
Microscopic correlates at cellular and intracellular levels in association with changes in gene expression due to PK 11195 exposure
To see whether the changes in gene expression due to PK 11195 exposures, seen at the different time points in the present study, may be associated with changes in TSPO location, confocal microscopy was applied (Figure 6). A priori, we had expected to see TSPO expression appearing in the cell nucleus after PK 11195 exposure, in association with the apparent modulation of gene expression. Actually, we did not expect to see changes in gene expression before 24 hours. In addition, we expected changes in gene expression to come only after 24 hours of PK 11195 exposure, potentially even associated with a shift in TSPO location. However, as mentioned above, changes in gene expression determined with microarray were already apparent within 15 minutes of PK 11195 application. As the gene expression assay, also our microscopic study started with the time point of 15 minutes, and included 30 minutes, 45 minutes, 1 hour, 3 hours, and 24 hours. A general overview of the results is given in Figure 6. For simplification, Figure 6 is restricted to the time points of 0 minutes exposure (vehicle control), 30 minutes, 45 minutes, 1 hour, and 24 hours. We found that in all instances, i.e. in vehicle control as well as at all of the time points for PK 11195 exposed cells, immunocytological TSPO labeling appears to be restricted to the cytosolic compartment of the cell, including the mitochondria (labeled with Mitotracker red). To emphasize, TSPO labeling does not double-label with DAPI labeling of the cell nuclei, as can be seen clearly in the columns named "Nucleus, TSPO" of Figure 6 and of Figure 7.
We think is noteworthy to mention that we encountered a potentially interesting additional observation. At every time point of PK 11195 exposure, see for example the column of Figure 6
A' B
'
C'a b c
Data Set
Data Set
Data Set Regulator
Regulator Regulator
Effect Effect Effect
named "Nucleus, TSPO", dense labeling of TSPO in relative proximity to the nucleus can be recognized in at least several of the PK 11195 treated cells (where this is most clear it is marked with white arrows). Such dense TSPO labeling can even become visible as "caps" adjacent to the cell nuclei. This is not apparent at all in cells not treated with PK 11195. The even spread of mitochondria labeled with TSPO throughout the cell body of vehicle control cells is indicated with white arrow heads in the top row of Figure 6. Examples of these phenomena are given as expanded images in Figure 7. For Figure 7 we chose the time points of 0 minutes and 1 hour (i.e. with and without PK 11195 exposure), with the representations of : (1) labeling for TSPO, mitochondria, cell nuclei, and phase contrast for the cell outline to achieve a relatively complete overview of TSPO distribution inside the cell body; (2) labeling for TSPO and cell nuclei indicating the lack of TSPO labeling inside the cell nuclei, in unexposed as well as PK 11195 exposed cells. Thus, after PK 11195 exposure, TSPO labeling, as well as mitochondrial labeling, appears relatively condensed toward the nucleus, leaving more peripheral cellular regions free from this labeling , while in unexposed cells such labeling appears evenly spread over the cytosol. Note, TSPO labeling only double-labels with mitotracker red (labeling for mitochondria), never with DAPI (labeling for cell nuclei), even when TSPO labeling is in the same area of view as the cell nucleus. Figure 6 provides a more differentiated overview, including changes in the morphology of cells during the exposures to PK 11195. See a more detailed description of figure 6 further below.
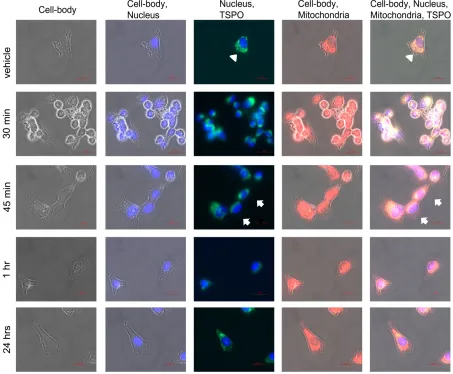
Figure 6. Phase contrast microscopic images of U118MG cells labeled for the cell nucleus (DAPI), the mitochondria (Mitotracker Red), and TSPO (immunocytological labeling). The images are indicative of morphological changes due to exposure to the TSPO ligand PK 11195, in association with intracellular TSPO location. In general, as described in the text, the main points are that TSPO
does not appear in the cell nuclei, but are always co-localized with mitochondria. The arrow-heads indicate labeling of mitochondria and TSPO evenly distributed throughout the cytoplasm in the vehicle row. In the 45 min row, the arrows point at mitochondria with co-localized TSPO that are present relatively close to the cell nuclei. A more detailed description of the figure follows here: The rows present exposure times to PK 11195 (25 µM), from top to bottom: vehicle (i.e. no exposure), 30 min, 45 min, 1 hr, and 24 hrs. In each row from column to column the same cells are shown. Phase contrast micrographs are presented in the first column. The second column shows cell nuclei (stained blue with the aid of DAPI) within the phase contrast images. The third column shows TSPO immune labeling (Alexa fluorR 488 i.e. green) together with the DAPI stained nuclei. Most importantly, the images in the third column show that TSPO labeling is not within the cell nuclei, but in other intracellular areas and cell organelles. In particular, there is no double-labeling of TSPO and DAPI signal. The fourth column shows mitochondrial labeling in the cells outlined by phase contrast. Here it becomes clear that the TSPO labeling in the third column covers intracellular areas occupied by mitochondria. The fifth column shows the results of all signals for the cells in question combined. This presents merged double labeling for mitochondria and TSPO (white to yellow), while phase contrast and nuclear stain is applied for orientation. The DAPI stained nuclei appear purple here due to interference. As a control for this, omission of TSPO labeling i.e. by omitting the primary anti-TSPO anti-body, results in the same nuclear stain (purple) when applying the same microscopic conditions (not shown). As a general remark, omission of TSPO antibody completely prevented the immunocytochemical labeling for TSPO (not shown).
Figure 7.Phase contrast microscopic images of U118MG cells labeled for the intracellular location of TSPO. In the left hand images, cells are only viewed for labeling of the cell nucleus (DAPI) and of TSPO (immunocytological labeling). In the right hand images, cells are viewed for labeling of the cell nucleus (DAPI), TSPO (immunocytological labeling), and the mitochondria (Mitotracker Red), within the cells outlined by phase contrast. While TSPO labeling can appear in the same area
Ve
h
ic
le
Nucleus, TSPO
1 hour
of view as the cell nucleus, double labeling of TSPO and nucleus does not occur (left hand images). In the right hand images it can be seen that the TSPO labeling overlaying the nucleus double labels with mitochondria, resulting in a yellow-whitish stain. The main points are that TSPO does not appear in the cell nuclei, but are always co-localized with mitochondria. In the vehicle exposed cells (top two images), labeling of mitochondria and TSPO is evenly distributed throughout the cytoplasm, almost completely filling out the cell body. In the cells exposed for 1 hour to PK 11195, labeling of mitochondria and TSPO is condensed toward the cell nucleus, with TSPO – mitochondria double labeling appearing relatively close to the nucleus. Toward the periphery of the cell body a relative broad area is devoid of mitochondrial as well as TSPO labeling.
The scheme of Figure 8 presents some core observations of cell morphology presented in Figures 6 and 7. In particular, in vehicle control (0 hrs) TSPO labeling appears to be evenly spread throughout the cytoplasm together with the mitochondria (top of Figure 8). As illustrated in the diagram of Figure 8, commonly, in cells exposed to PK 11195, mitochondria with dense TSPO labeling can be seen relatively close to the cell nuclei (from halfway down Figure 8 to the bottom of Figure 8). Also the basic time dependent cell body shapes (round and polygonal) are diagrammatized in Figure 8. At the top of the diagram of figure 8, the cells (not exposed to PK 11195) are polygonal. One step lower in the diagram of figure 8, rounded cells are presented (i.e. cells exposed to PK 11195 for 15 and 30 minutes). From the time point of 45 min of exposure to PK 11195, the U118MG cells start to disperse from the clusters and revert to their typical polygonal and elongated shapes (bottom of the diagram of Figure 8).
Figure 8. Scheme of observations presented in Figures 6 and 7. In vehicle control cells (i.e. 0 hrs of PK 11195 exposure) mitochondria with TSPO (yellow) are spread throughout the cytosol (grey). Shortly after PK 11195 exposure the cell bodies contract, become roundish, and mitochondria with TSPO appear to become more condensed toward the cell nuclei (blue). After 24 hrs of PK 11195
0 hours of PK 11195
exposure the cell bodies regain their original polygonal shapes. Nonetheless, after these 24 hrs, mitochondria with TSPO still remain congregated in areas relatively close to the cell nucleus. Mitochondria not displaying TSPO signal are indicated with (red).
These observations are given here in more detail as a guide through the presentation of Figure 6. Going down row by row with the sequential time responses to PK 11195 exposure in Figure 6, it can be seen in the top row, or row 1 (named vehicle i.e. zero time exposure to PK 11195), that TSPO labeling is relatively evenly spread over the intracellular areas covered by mitochondria, without distinct areas of enhanced signal. This, for example, is indicated by arrow heads at the intersections of row 1 with columns 3 and 5. The cells themselves are polygonal in shape and evenly distributed over the coverslip i.e. without clustering. In row 2 (30 min exposure to PK 11195) the cells have congregated to form clusters and frequently present roundish shapes, while the mitochondria with their TSPO appear to be condensed toward the cell nucleus (presented at the intersections with columns 3 and 5). The same is true for 15 min of PK 11195 exposure (not shown). In row 3 (45 min exposure to TSPO), the cells appear to revert to their original morphology again (as in row 1). Nonetheless, mitochondria double labeled with TSPO remain visible relatively close to the cell nuclei. This phenomenon is indicated by arrows in the images of columns 3 and 5 intersecting with row 3. Note well that this phenomenon of distinct TSPO signal present in mitochondria relatively close to the nuclei is observed at all time points of PK 11195 exposure i.e. in the figure in all rows from row 2 to row 5, but not in row 1 (which is vehicle control). In rows 4 and 5 (respectively 1 hr and 24 hrs of PK 11195 exposure), the cells continue to revert to their original morphology and at 24 hrs have become indistinguishable from vehicle exposed U118MG cells (row 1). The same is true for 3 hrs of PK 11195 exposure (not shown). The basic observations are schematized in a relatively simple manner in Figure 8, presenting that TSPO only occurs in the mitochondria in this paradigm, never in the cell nucleus.
The phenomena presented in Figures 6 - 8, were observed in two separate experiments, where each condition was provided in 3 wells, and where at least 10 cells, or 10 clusters of cells from each well were photographed. At present we cannot say what would be the cause, mechanism, or functional significance for the observed enhanced TSPO signal in the relative proximity of the cell nucleus in PK 11195 exposed cells.
Actual phenotypic effects of PK 11195 exposure that were predicted by pathway analysis.
Figure 9. PK 11195 induced neuronal differentiation of rat PC12 cells. (A) Undifferentiated vehicle control cells; (B) Neuronal differentiation due to PK 11195 (50 µM), including differentiating cells (white asterisks), neurite outgrowth (white arrows), growth cones (white arrowheads), and varicosities (black arrows); (C) Representative western blot showing elevated β-III-tubulin
A
B
*
*
*
C
expression in rat PC12 cells after exposure times of 24, 48, 72, 96, and 144 hours to PK 11195 (50 µM). β - actin is the loading control; (D) Bar chart of Means ± SEM (n = 3) of the relative densities of the blot bands of β-III-Tubulin labeling in C (arbitrary units as % of control. Control = vehicle treated cells. ** = p < 0.01, *** = p < 0.001. (In A and B; bars: 100 µm)
As TSPO is well known to affect programmed cell death, we paid special attention to this issue. PK 11195 exposure appeared to have a time dependent effect on gene expression related to programmed cell death, as indicated by asterisks (*) next to the genes in question in Table 2: After 15 minutes, 11 out of 20 genes; after 30 minutes, 9 out of 14 genes; after 45 minutes, 8 out of 12 genes; after 60 minutes, 17 out of 25 genes; after 3 hours, 6 out of 14 genes; and after 24 hours, 9 out of 29 genes. Thus, at all time points within 60 minutes more than half of the genes changing expression are related to programmed cell death. After 3 hours it is less than half, and after 24 hours less than one third (Table 2).
In general, apart from the functions discovered in the present study (e.g. accumulation of cells, neuron differentiation), the functions revealed by Regulator Effects analytic; IPA® include numerous well established TSPO functions (see Discussion and Introduction).
Effects of TSPO ligands other than PK 11195 on gene expression.
We chose PK 11195 to test potential induction of gene expression via TSPO, as PK 11195 is a classical, well studied TSPO ligand, and the results can be in a relatively facile way incorporated in the accumulated body of knowledge. Moreover, effects of 25 µm of PK 11195 are comparable to TSPO knockdown [e.g. 32,39]. However, we also wanted to determine whether more advanced TSPO ligands also present modulation of gene expression. To investigate this we applied different concentrations of a recently developed TSPO ligand 2-Cl-MGV-1 [13,20,46]. For the study of potential 2-Cl-MGV-1 effects, we used the same microarray assay method as for PK 11195. We assumed that this would give an indication of the specificity of the effects of PK 11195 as a TSPO ligand. We applied 1 hour of exposure as this was an effective time period as demonstrated for changes in gene expression following PK 11195 application. We applied concentrations at the same height or higher than we applied for PK 11195 (i.e. 25, 50, and 100 µM), because the affinity of 2-Cl-MGV-1 is much lower than of PK 11195 (~240 fold) [46]. Furthermore, at 50 and 100 µM 2-Cl-MGV-1 does not show the confounding side effects that PK 11195 shows at these concentrations [5,20]. In this paradigm 2-Cl-MGV-1 significantly affected a small number of genes primarily related to gene expression regulation. Table 4 shows the genes that are regulated by 2-Cl-MGV-1, namely: FOS, ZFP36, DUSP1, ID2, and TUFT1. This Table 4 shows that the concentrations of 50 and 100 µM 2-Cl-MGV-1 have robust effects on the expression of these genes. A cut off of 1.5 as applied for PK 11195, showed changes due to application of 50 and 100 µM of 2-Cl-MGV-1. Importantly, all the genes as seen in Table 4 are among the genes of which their expression is most affected by PK 11195 (see Table 1). Thus, effects on these genes by the TSPO ligands we applied in this paradigm appear to be quite specifically related to control of overall gene expression.
Table 4. Dose dependent changes in gene expression of U118MG cells due to exposure 2-Cl-MGV-1.
50 µM
100 µM
Up-regulated genes ↑ Up-regulated genes ↑
FOS ↑2.5 FOS ↑3.46
ZFP36 ↑1.68 ZFP36 ↑1.72 DUSP1 ↑1.62 DUSP1 ↑1.71
Down-regulated genes ↓ Down-regulated genes ↓
General observations
The TSPO ligand PK 11195, significantly and specifically, within 15 minutes induces changes in gene expression. These gene expression changes are in accord with actual phenotypic and functional changes. Microscopic observations imply mitochondrial TSPO in these phenomena.
3. Discussion
To answer the question whether nuclear gene expression can be modulated via the mitochondrial TSPO : i) we first of all studied the effects of the classical TSPO ligand PK 11195 on gene expression in general. ii) We then applied pathway analysis to predict potential functional implications. iii) We also designed microscopic studies to study whether and how TSPO location could be associated with modulation of gene expression i.e. to determine whether (preferred) location of TSPO could change between mitochondria and nucleus. iiii) Microscopy was also applied to study whether functions were actually modulated as predicted by our pathway analysis. iiiii) Finally, comparisons with effects on gene expression by a more advanced TSPO ligand 2-Cl-MGV-1 were undertaken.
various genes affecting various functions over this time period were affected. Finally, after 24 hours, the gene expression in this glioblastoma cell line of U118MG was regulated such that an anti-tumorigenic effect became most evident, including promotion of programmed cell death. Furthermore, changes in gene expression observed after 3 hours appeared to promote effects that counteract effects determined at shorter time periods, thus being suggestive of a homeostatic effect.
Regarding the choice of the concentration of PK 11195 applied, with several previous studies we found that PK 11195 at a concentration of 25 µM could optimally prevent programmed cell death otherwise induced by various agents (ErPC3, glutamate, NO, CoCl2). To emphasize, these effects 25
µM of PK 11195 are similar to the effects of TSPO knockdown. For a review of these studies see [10]. In the Kugler et al. study [5] it was determined that lower concentrations from 1 µM down to 1 nM had no effect at all on programmed cell death induced by ErPC3. Just by itself, PK 11195 concentrations of 25 µM and lower (as low as 1 nM) had no effect at all i.e. appeared neutral. Higher PK 11195 concentrations (in particular higher than 50 µM) presented increasing lethal effects on their own, an effect that is well known [5,8]. Thus, this indicated to us that 25 µM of PK 11195 presented modulation of TSPO function (reminiscent of the effect of TSPO knockdown, as mentioned) and presented the optimal concentration to a priori avoid non-effects of lower concentrations and to avoid confounding lethal effects of higher concentrations in this U118MG cell line. Furthermore, our first study to assay the effects of PK 11195on gene expression in general showed a time dependent (from 24 hours to 48 hours) effect of 25 µM of PK 11195 on gene expression [24], also reminiscent of the effects of TSPO knockdown on gene expression [19]. With the present study we wanted to apply shorter times of PK 11195 exposure to determine at which time points relevant changes in gene expression occur. We also wanted to optimize the application conditions for our gene expression studies. Therefore, we also took into consideration that full medium is known to be "activating" regarding gene expression [53,54]. Thus, full medium might interfere with the gene expression changes induced by PK 11195 or 2-Cl-MGV-1 and may complicate the issues at hand. This we strived to avoid. In this context, serum free culturing medium is considered to be optimal for gene expression studies as this renders cells quiescent [53,54]. Thus we applied serum free culturing medium. In short, we applied a straightforward paradigm and simple methods to clarify restricted questions.
We firstly found that changes in gene expression occur relatively early after PK 11195 application, i.e. already at 15 minutes. This is at least two hours before changes in physiological responses that are typically associated with TSPO function [40]. Secondly, we found that within 15 minutes the classical TSPO ligand PK 11195 induces considerable changes in gene expression associated with the canonical pathway for modulation of gene expression in general. We also found that not only the classical TSPO ligand PK 11195, but also the more advanced TSPO ligand 2-Cl-MGV-1 modulates expression of immediate early genes and transcription factors. These basic approaches indicate that one of TSPO's functions is to modulate nuclear gene expression.
To further gain insight whether TSPO may modulate gene expression in a fairly direct way, we applied microscopic determination of the intracellular location of TSPO. A priori, we expected that after PK 11195 exposure TSPO may be found in the cell nucleus, as a result from various physiological changes. This then would allow for fairly direct control of nuclear gene expression. However, with our double labeling studies for TSPO, mitochondria, and cell nucleus, we always found TSPO to be located in the cytosol, including the mitochondria, and never in the nucleus of U118MG cells, with and without application of PK 11195, and at each time point of PK 11195 application, from 15 minutes till 24 hours. The mitochondrial location of the TSPO suggested to us that the mitochondria-to nucleus signaling pathway is the main venue for regulation of gene expression by TSPO. This well-known mitochondria-to-nucleus communication pathway is conserved from yeast to humans and includes mitochondrial release of Ca++, ATP, and ROS
cell nuclei. We would like to believe that the relative close presence to the nucleus of mitochondria with TSPO may facilitate the regulation by TSPO of gene expression via mitochondria-to-nucleus signaling. Of course, alternative explanations are possible, such as enhanced energy requirements in particular subcellular regions [26]. In addition, it appears that within 15 minutes the application of PK 11195 causes the cells to contract to a round shape. This may contribute to the change of location of mitochondria toward the vicinity of the cell nucleus (see Figure 7). Or, the apparent location of the mitochondria is one of the contributing factors for cell shape change and motility. Then, already at 45 minutes the cells appeared to return from the morphology of clustered roundish cells to evenly distributed polygonal cells. After 24 hours, the cells have returned to their original appearances. Nonetheless, throughout this whole period of PK 11195 exposure, mitochondria with their TSPO remain visible close to the cell nucleus. Thus, we postulate that the morphological changes seen within 1 hour of PK 11195 exposure, even starting already 15 minutes of PK 11195 exposure may contribute to, or at least be associated with, TSPO's ability to induce early changes in gene expression. More studies, including high power light microscopy as well as electron microscopy, are needed to elucidate the microscopic observations of the present study. We are fully aware that a restricted number of other studies also show TSPO in other locations than mitochondria, including cell nuclei [7,46,47].
The mitochondrial location of the TSPO suggested to us that the mitochondria-to-nucleus signaling pathway is the main venue for regulation of gene expression by TSPO. This well-known mitochondria-to-nucleus communication pathway is conserved from yeast to humans and includes mitochondrial release of Ca++, ATP, and ROS generation [27,28,29,30,31,32]. The
mitochondria-to-nucleus signaling pathway, as outlined in the Introduction, includes mitochondrial ROS generation and loss of Δψm, leading to changes in levels of ATP and NADH, and the release of Ca++, resulting in the activation of immediate early genes and transcription factors [29,30,31, 32]. As
also mentioned in the Introduction, TSPO regulates mitochondrial ROS generation, Δψm transitions, ATP production, Ca++ release, and NADPH oxidase (NOX) activity [14,15,16,35,36,37,41,42,43,44]. In
studies by others, effects on free radical generation by TSPO ligands have been studied in cultured neural cells, including primary cultures of rat brain astrocytes and neurons as well as cells of the murine BV‐2 microglial cell line [55]. In these studies, free radical production was measured at the time points of 2, 30, 60, and 120 min of treatment with the TSPO ligands PK 11195, Ro5-4864, and PPIX (all at 10 nM). In astrocytes, all ligands showed a significant increase in free radical production at 2 min. Thus, ROS generation induced by classical TSPO ligands, synthetic and endogenous, apparently precedes changes in gene expression. As noted, such ROS generation, may be an essential component of the mitochondria-to-nucleus signaling for modulation of nuclear gene expression [26,56,57]. Finally, the present study shows that immediate early genes which are characteristic of the mitochondrial-to-nucleus pathway (e.g. EGR1, FOS, and MYC), are also induced by our application of PK 11195, the classical mitochondrial TSPO ligand. Thus it appears that the well reported primary location of the TSPO in the mitochondria [7, 9,11], which was also observed in the present study, as well as TSPO's well-known regulation of specific mitochondrial functions, favors a mitochondria-to-nucleus signaling pathway for TSPO's ability to regulate gene expression. As strong quantitative changes in mitochondrial ROS generation, Δψm transitions, ATP production, Ca++ release, and NADPH oxidase (NOX) activity typically are inductive for programmed cell death,
we assume that moderate or small changes may rather be related to gene expression changes. This is a subject wanting for research.
development, and differentiation, even correlating in a timely fashion with the changes in expression of the relevant genes. Worldwide, careful TSPO research over the last 40 years has shown that PK 11195 and other TSPO ligands, as well as TSPO knockdown with genetic manipulation, modulate these same functions as seen with the gene expression analysis in this study [1,2,8,10,11,19,36,40,42,44,55,58,59,60].
Importantly, the pathway analysis showed that the gene expression changes presented interactive assemblies and super-assemblies. In short, in such assemblies, groups of genes that provide gene products for singular functions. In simple terms, the predictions of effects on specific functions appear to be robust. Moreover, the redundancies and degeneracies of pathways, forming the bases of the assemblies and super-assemblies, reinforce the robustness functional gene expression effects induced by TSPO activity. It is well-known that redundancy and degeneracy in biological systems serves to stabilize them [49,50,51].
The experiments of the present study also provide data that functional changes predicted by observed changes in gene expression did actually occur. For example, the actual functional effects observed in the present study appear to include : stimulation of gene expression and accumulation of cells (at 15 min), activation of microtubule dynamics and cell motility (at 30 min), promotion of cell migration (at 45 min), then cell motility and accumulation of cells is reversed (at 3 hours). Only at 1 hour and 24 hours of PK 11195 expression no gene expression related to the actually observed functional effects was seen.
We were intrigued by the observed intracellular locality changes of TSPO labeling. It appears that because of some until now unknown cause and purpose, mitochondria in the relative vicinity of the cell nuclei enhance TSPO labeling in response to PK 11195 exposure. One alternative may be that mitochondria with TSPO can move from more distant areas in the cytosol to areas neighboring the cell nucleus, resulting in relative dense TSPO signal in such areas. This may potentially implicate that mitochondria not expressing TSPO are not motile in this paradigm. Such a phenomenon is not uncommon. For example in mature neurons, only one-third of axonal mitochondria are motile, the remainder thus being stationary [33]. Stationary mitochondria are considered to serve as local energy sources and buffer intracellular Ca++ [33]. It is known that
motility may serve to move mitochondria to the required intracellular locations for various cellular functions, such as proliferation, cell growth, cell cycle, differentiation, information transfer, apoptosis, etc. [31,56]. More studies are needed to determine whether TSPO actually may modulate mitochondrial motility.
Finally, as alluded above, also TSPO ligands other than PK 11195 can regulate gene expression. In the fifth approach of the present study this includes 2-Cl-MGV-1 which we found to modulate immediate early gene expression. As the affinity of 2-Cl-MGV-1 by design is relatively low, the concentrations of 2-Cl-MGV-1 given can be considered the equivalent of a 100 to 400 nM range of PK 11195. This is closer to the dissociation constant of PK 11195 than the 25 µM concentration used for PK 11195. Nota bene : in nature, a high affinity per se does not have to be advantageous. For example, the affinity for of CO for hemoglobin is 210 higher than that of O2 . However, CO is lethal,
O2 is life giving. The further illustrate the potential general implications of our finding, other
studies, applying genetic manipulation and ligands other than PK 11195 to target various specific functions, also showed modulations of gene expression [19,20,23,24,26,61,62,63].
In summary, our study indicates that the TSPO ligand PK 11195 can modulate gene expression in U118MG cells within 15 minutes. This modulation involves regulation of expression of gene products that are part of the canonical pathway for regulation of gene expression. This gene expression appears to be related to cell viability and tumorigenicity of these U118MG cells. It is likely that such modulation in gene expression occurs via mitochondria-to-nucleus signaling, probably via mechanisms including ΔΨm collapse, ROS generation, Ca++ release, and ATP
functions include modulation of nuclear gene expression via mitochondrial-nuclear signaling. This presents one way whereby TSPO can control several vital cell functions, which has major implications for the whole organism in health and disease.
*proliferation, *migration,
*differentiation, *cell death, *inflammation,
TSPO
Mitochondrion
**
ROS
2+
Ca
#
**
ATP
Nucleus
*Gene expression
*
Transcription factors
*
Specific enzymes and other proteins
Cytosol
Effects
*
Immediate early genes
Figure 10. Regulation of gene expression by the TSPO ligand PK 11195. It is well known that the classical TSPO ligand PK 11195 can modulate mitochondrial TSPO functions such as Ca++ release, ATP production, and ROS generation via modulation of mitochondrial proteins such as VDAC, ANT, and complexV [a.k.a. ATP(synth)ase]. Ca++ release, ATP production, and ROS are part of the mitochondrial – nuclear signaling pathway for regulation of nuclear gene expression. In this pathway, calcium sensitive proteins such as calcineurin and calmodulinKIV contribute to induction of expression of immediate early genes. The present study shows that PK 11195 exposure at first induces expression of immediate early genes, as well as other transcription factors (calcineurin, and calmodulinKIV are implicated in these effects), followed by changes in gene expression for enzymes and other proteins. Eventual potential functional implications include cell proliferation, cell migration, cell differentiation, cell death, inflammation, immune response, and tumorigenicity. While it is impossible to include all co-factors and context conditions into this diagram, it should be appreciated that by making small and big variations in the research paradigm, other final effects will become apparent regarding changes in function due to changes in gene expression, for example as a consequence of application of other TSPO ligands, TSPO knockdown, TSPO knockout, TSPO gene insertion, full medium, serum free medium, etc. The (*) and the (**) next to the phenomena modulated by PK 11195 indicate results from our present study (*) and from our previous studies (**). # indicates data from studies by others. (We consider it worthwhile for future studies to pay attention to the calcium sensitive proteins in the context of gene expression regulation via TSPO activities).
Caveats and questions for future research
For most of its history, TSPO research has been challenged by oftentimes seemingly contradictory results. In this section here we only want to present a minimal sketch of this problem. For this short expose we provide a minimal number of references. For the interested reader, we refer to the numerous reviews regarding TSPO research, which directly or indirectly approach this enigma (not only referred to in this study, but also in other studies). It is well known that TSPO may contribute to various functions, sometimes appearing without any commonality [64,65,66,67,68,69]. One may find that for some researchers, gene regulation via TSPO or by TSPO ligands may be an undesired side effect. For others, it may be a desired feature, for example to render cancer cells less malignant, more differentiated i.e. more like non-cancerous cells, or to induce regenerative responses to organ and tissue damage. These antagonistic expectancies regarding properties of TSPO and its ligands potentially may lead to widely divergent discrepancies in research approaches and interpretations of results. Another confounding aspect does relate to the now well appreciated concept that TSPO has homeostatic functions [20,23,26,38,62,63,70,71]. Assuming this to be true, many of the seemingly contradictory results can be explained as upregulatory and downregulatory characteristics of this potential homeostatic apparatus. An additional point, also redundancy and degeneracy potentially can make interpretations regarding TSPO properties difficult, as mechanisms affected by TSPO manipulations may be compensated for by other systems.