University of New Orleans University of New Orleans
ScholarWorks@UNO
ScholarWorks@UNO
University of New Orleans Theses and
Dissertations Dissertations and Theses
8-10-2005
Types of Aggression, Responsiveness to Provocation, and
Types of Aggression, Responsiveness to Provocation, and
Psychopathic Traits
Psychopathic Traits
Luna C. Munoz
University of New Orleans
Follow this and additional works at: https://scholarworks.uno.edu/td
Recommended Citation Recommended Citation
Munoz, Luna C., "Types of Aggression, Responsiveness to Provocation, and Psychopathic Traits" (2005). University of New Orleans Theses and Dissertations. 305.
https://scholarworks.uno.edu/td/305
This Dissertation is protected by copyright and/or related rights. It has been brought to you by ScholarWorks@UNO with permission from the rights-holder(s). You are free to use this Dissertation in any way that is permitted by the copyright and related rights legislation that applies to your use. For other uses you need to obtain permission from the rights-holder(s) directly, unless additional rights are indicated by a Creative Commons license in the record and/ or on the work itself.
TYPES OF AGGRESSION, RESPONSIVENESS TO PROVOCATION, AND PSYCHOPATHIC TRAITS
A Dissertation
Submitted to the Graduate Faculty of the University of New Orleans
in partial fulfillment of the requirements for the degree of
Doctor of Philosophy in
Psychology Applied Developmental
by
Luna C. Muñoz
Dedication
To my father, William (Willie) Muñoz, whose joy for life and for new experiences
remains with me. Thank you for instilling in me a will to rise above all my early difficulties and
to persist in spite of discouraging circumstances. Despite your educational background, I know
you always appreciated learning, particularly the learning that one pursues in the betterment of
oneself. I will always try to remember to seek learning opportunities in life and in fancy as well
Table of Contents
Abstract ... iv
Introduction... 1
Subtypes of Aggression in Children ... 1
Subtypes of Aggression and Their Sequelae ... 2
Reactive Aggression and Emotional Reactivity ... 2
Reactive Aggression: Heightened Physiological Reactivity ... 3
Proactive Aggression: A Mixed Subtype of Aggression... 4
Proactive Aggression and Underreactivity ... 5
Proactive Aggression: Dissociation Between Physiological and Emotional Reactivity ... 6
Psychopathic Traits... 7
Psychopathy and Aggression ... 7
Psychopathy and Underreactivity ... 9
Psychopathy and Anger ... 13
A Dissociation between Expressed and Experienced Emotion in Psychopaths ... 15
The Present Study ... 16
Method ... 18
Procedure ... 18
Participants ... 19
Measures ... 21
Results... 30
Data Inspection ... 30
Validation of the Provocation Task ... 30
Cluster Analysis to Form Aggressive Groups ... 32
Aggression Clusters and Aggressive Responding on the Provocation Task ... 34
Aggression Clusters, Callous-Unemotional Traits, and Psychophysiological Indices... 36
Post-Hoc Analyses... 37
Discussion ... 38
References... 50
Appendix A: Tables and Figures ... 56
Appendix B: Internal Review Board Approval Form... 70
Abstract
Research on the various subtypes of aggression has documented differences in the experience of
anger and the expression of angry aggression. Mixed proactive and reactive aggressive
individuals exhibit reactive aggression but, unlike reactive aggressive individuals, fail to exhibit
angry expressions or physiological arousal. Similar to the proactive group, individuals with
psychopathic traits have been found to exhibit emotional underreactivity, and physiological
underarousal, while still exhibiting reactive aggression. The present study examined 85 boys
(ages 13 to 18) from a detention center. Three groups of aggressive boys were identified via
cluster analysis based on the self-report of types of aggressive behavior: a primarily reactive
aggressive group (n=29), a mixed reactive and proactive group (n=16), and a low aggressive
group (n=40). The three groups were compared on aggressive responding (during a
computerized provocation task with low and high provocation trials), on callous and unemotional
traits (CU) and on psychophysiological indices of emotional reactivity. All aggressive groups
showed greater aggressive responding to high provocation than to low provocation. The mixed
aggressive group showed high aggressive responding across all provocation levels, including the
no provocation condition, while the reactive aggressive group only showed high levels similar to
the mixed aggressive group during low provocation. Unexpectedly, the reactive and mixed
aggressive groups reported higher levels of CU traits than the other group. Although the groups
did not differ on psychophysiological activity/reactivity, higher levels of CU traits were related
to lower skin conductance responses to provocation. Thus, the contribution of high and low CU
traits in the three groups to psychophysiological activity/reactivity was examined. Interestingly,
the low and mixed aggressive groups who were high on CU traits had lower sympathetic arousal
aggressive group showed a general disconnect between their angry aggression (on the
provocation task) and their sympathetic reactivity to provocation. However, this was true only if
they also showed high rates of CU traits. These results suggest that interventions targeted toward
individuals who exhibit particular subtypes of aggression may be more beneficial if the presence
Introduction
Understanding the development of extreme or persistent aggression in children may be of
great importance for understanding juvenile violent criminal behavior (Office of Juvenile Justice
and Delinquency Prevention, 1995). The cognitive and emotional factors that can lead to
aggressive behavior must be understood with reference to the specific subtype of aggressive acts
that they produce in order to develop appropriate psychotherapeutic treatments (Dodge & Pettit,
2003; Frick, 2001). Therefore, a review of the extant literature will begin with a description of
the subtypes of aggressive acts and their concomitant cognitive, emotional, and physiological
correlates.
Subtypes of Aggression in Children
Dodge and Coie (1987) identified two subtypes of aggression: reactive and proactive.
Reactive aggression is characterized by impulsive defensive responses to a perceived
provocation or threat (Dodge & Coie, 1987; Eisenberg & Fabes, 1992). Reactive (also referred
to as impulsive or defensive) aggression is characterized by “hot blooded,” angry, and hostile
responses, whereby an overreaction to minor or perceived provocation and intense physiological
reactivity are often exhibited (Dodge & Coie, 1987; Dodge, Lochman, Harnish, Bates, & Pettit,
1997; Hubbard et al., 2002). Additionally, reactive aggression has been related to a failure in the
cognitive processing of social information at myriad levels of decision-making (Dodge et al.,
1997; Lemerise & Arsenio, 2000; Dodge & Pettit, 2003).
Unlike reactive aggression, proactive (otherwise known as instrumental) aggression is not
associated with provocation (Dodge et al., 1997). This type of aggression is defined as
tend to value aggression as an effective means of acquiring their desired goals more than do
other children and they anticipate positive outcomes for their aggressive behavior (Dodge et al.,
1997). These children are overly focused on the end goal and view aggression as an effective
problem-solving strategy that will aid in obtaining their goals.
Subtypes of Aggression and Their Sequelae
Proactive aggression also differs from reactive aggression in its prognosis for antisocial
outcomes. For boys, proactive aggression rated during preadolescence predicted delinquency,
delinquency-related violence, and disruptive behaviors during mid-adolescence (Vitaro,
Gendreau, Tremblay, & Oligny, 1998; Vitaro, Brendgen, & Tremblay, 2002; Brendgen, Vitaro,
Tremblay, & Lavoie, 2003). In addition, proactive aggression at age 14 predicted criminal
behavior in adulthood (Pulkkinen, 1996). In contrast, reactive aggression does not have such
predictive utility (Vitaro et al., 1998; Vitaro et al., 2002; Pulkkinen, 1996). Vitaro, Brendgen,
and Tremblay (2002) found that individuals who only acted aggressively in response to
provocation were less likely to engage in delinquent acts as adolescents. Instead of
delinquency-related violence, these children were more likely to engage in dating violence as adolescents
(Brendgen et al., 2003). Dating violence may be more likely for reactive aggressive individuals
due to the emotional intensity generated in such adolescent relationships. Experiencing high
levels of emotional intensity can make responding aggressively in response to provocation more
likely for reactive individuals (Lemerise & Arsenio, 2000; Thompson & Calkins, 1996).
Reactive Aggression and Emotional Reactivity
As suggested by these findings, emotion and emotion regulation processes may
contribute to both the development and the expression of reactive aggression (see Lemerise &
subtypes of aggression, whereby a dysregulation of angry or hostile emotions was characteristic
of reactive, but not proactive aggression (Hubbard et al., 2002). Individuals who exhibited
reactive aggression also showed the sharpest increase in nonverbal angry behaviors (such as
throwing materials) throughout a competitive game played with a peer (Hubbard et al., 2002).
It is probable that a child who displays extreme negative emotional responses would
evoke hostility from his or her environment, much more than a child who is low in negative
emotionality (Schwartz et al., 1998). Moreover, experiencing high negative emotionality or
being easily angered may predispose a child to cognitively ‘cue up’ former negative situations
that had culminated in hostility (Lemerise & Arsenio, 2000). Importantly, both events could
make an aggressive act become more likely (Dodge & Pettit, 2003; Lemerise & Arsenio, 2000).
Reactive Aggression: Heightened Physiological Reactivity
In addition to experiencing strong emotions, individuals who exhibit reactive aggression
also show high physiological reactivity (Pitts, 1997; Hubbard et al., 2002). Physiological
reactivity is measured as a change in the level of physiological activation to stimuli, indicative of
a discrete response, when compared to a baseline period of relative quiescence. Two common
indices of physiological reactivity are heart rate and galvanic skin response.
In one study, heart rate was recorded in children who were either primarily reactive or
both reactive and proactive aggressive in response to various laboratory tasks (Pitts, 1997). The
reactive group showed greater heart rate reactivity across tasks than the mixed group, who
exhibited a stable response pattern regardless of the task. Recently, Hubbard et al. (2002)
showed that aggression in response to provocation (i.e., reactive aggression) was accompanied
by heightened physiological indices of arousal in children during a competitive game with a
aggression had the highest heart rates and showed a sharp increase in heart rate reactivity. Those
high in reactive aggression showed lower skin conductance levels during baseline but they
showed greater reactivity (Hubbard et al., 2002).
Reacting physiologically in response to provocation has also been shown to occur in
those children who evidence a hostile attributional bias to social events (Williams, Lochman, &
Barry, 2003). Children who responded with aggression to provocation, as compared to
non-aggressive children, showed greater increases in their heart rates to the provocation and were
more likely to have attributional biases. Therefore, not only was aggression predictive of greater
physiological reactivity but attributional bias also showed a positive relationship with
physiological reactivity (Williams et al., 2003). It is possible that strong physiological or
emotional reactions to stressful situations can impede a reactively aggressive child’s attempts to
regulate behavior, as well as emotion (Lemerise & Arsenio, 2000; Thompson & Calkins, 1996).
Heightened arousal levels require greater attempts at regulation in order to maintain homeostasis.
Consequently, the cognitive activity required to regulate emotional arousal can interfere with the
cognitive processing of social stimuli which may result in aggressive responding (Lemerise &
Arsenio, 2000).
Proactive Aggression: A Mixed Subtype of Aggression
Interestingly, those who engage in proactive aggression often also engage in reactive
aggression, although the reverse is not true (Dodge et al., 1997). As a result, Hubbard et al.
(2002) found a strong positive relationship (r = .77) between proactive and reactive aggression.
Other investigators have also found such high correlations (Brendgen et al., 2003; Vitaro et al.,
While some studies have found a small group of children with just proactive aggressive
tendencies (Vitaro et al., 2002), other studies have failed to identify a proactive aggressive group
who did not also evidence reactive aggressive behavior (Pitts, 1997; Cornell et al., 1996; Kruh,
Frick, & Clements, 2005; Frick, Cornell, Barry, Bodin, & Dane, 2003). Thus, for the sake of the
present paper, the proactively aggressive and the group who displayed a mix of proactive and
reactive aggression will be discussed as a homogenous group, due to their similar personality
characteristics and the relative rarity of children who display solely proactive aggressive
behavior (Vitaro et al., 2002).
Proactive Aggression and Underreactivity
Proactive aggression has been uniquely associated with less emotional responses, as well
as minimal physiological reactivity. Using a competitive game, children rated high in proactive
aggression actually were less emotionally reactive, thereby displaying less nonverbal angry
behaviors than those rated low in proactive aggression (Hubbard et al., 2002). Moreover, the
group rated high in proactive aggression had the lowest heart rates throughout the game, and
showed little to no heart rate reactivity (Hubbard et al., 2002).
Importantly, lower heart rates are characteristic of children with relatively fearless
temperaments (Kagan, Reznick, Clarke, Snidman, & Garcia-Coll, 1984). Consistent with this
finding, lower levels of fear are common in children who are proactively aggressive (Vitaro et
al., 2002). This fearlessness may predispose the individual to act upon his or her whim, while
failing to fear the punishment for violating social conventions (see Raine, 2002; Kochanska,
1997). Indeed, fearless children have been shown to be more difficult to socialize (Kochanska,
Importantly, this link between temperament and socialization may interact with the mode
of discipline that a parent uses (Kochanska, 1997; Dadds & Salmon, 2003). A child with low
fear may be less reactive to punishment, and therefore require stronger punishment to activate
the stress response necessary to imprint the memory of the event in the brain (see Dadds &
Salmon, 2003). A consequence of a lack of accompanying negative physiological or emotional
response with antisocial behavior may be an inability to self-generate feelings of empathy or
guilt the next time one engages in antisocial behavior. Indeed, the “somatic marker” hypothesis
supports this theory. It proposes that an individual has a tendency to associate a behavior (i.e.,
its outcome) with a physiological response (Bechara, Tranel, Damasio, & Damasio, 1996).
Therefore, the next time that the individual considers committing the behavior, he or she
experiences the physiological response (the “somatic marker”) that originally accompanied the
commission of the behavior. This re-experience may act to prevent the person from repeating
the behavior (Bechara et al., 1996).
Feelings of guilt may, thus, become internalized when parents label the “marker” for the
child. For example, feelings of empathy or guilt can often inhibit a child from stealing another
child’s toy. When those feelings are absent, a child may act in accordance with his or her desires
(i.e., dominated by a motivation to obtain rewards) without considering its effects on others or
even the adverse consequences of his or her behavior.
Proactive Aggression: Dissociation Between Physiological and Emotional Reactivity
Based on Hubbard et al. (2002), it’s clear that individuals who evidence
instrumentally-motivated aggression experience low physiological reactivity. Thus, they evidence low basal
physiological activity, as well as little to no change from their baselines in response to stressful
children, then why do they also exhibit reactive aggression? Interestingly, in the Hubbard et al.
(2002) study, proactive aggressive children showed a sharper increase in their self-reported
anger throughout the competitive game when compared to those with a lower rate of proactive
aggressive acts. However, their self-report of angry feelings was not commensurate with their
display of anger during the game and their physiological reactivity.
Although these proactive aggressive children reported feeling angry during the game,
they displayed fewer nonverbal behaviors usually associated with anger (such as handling the
game materials roughly) than reactive aggressive children (Hubbard et al., 2002). Thus, the
proactive aggressive children examined in Hubbard et al. (2002) appeared to be underreactive to
provocation in the competitive game, when only examining their physiological reactivity (which
showed little change). On the contrary, when examining their subjective reports of anger, they
appear to be highly reactive. A physiological underreactivity and a flat emotional expression
both concomitant with a strong subjective feeling of anger suggest a dissociation among the
components of emotion for children with proactive aggression.
There is another area of research on individuals that seem to exhibit a flat affect, yet still
engage in aggressive behavior and report anger (Cleckley, 1976; Steuerwald & Kosson, 2000;
Patrick, Bradley, & Lang, 1993; Loney, Frick, Clements, Ellis, & Kerlin, 2003). This group of
individuals has been labeled as showing psychopathy.
Psychopathic Traits
Psychopathy and Aggression
Psychopathic traits include a constellation of affective, interpersonal, and behavioral
characteristics, such as lack of empathy and guilt, callousness, a poverty of emotions, and
most consistent findings in research on psychopathy is that individuals with psychopathic traits
show high rates of aggression and violence (Kruh et al., 2005; Cornell et al., 1996; Serin, 1996;
Serin, Peters, & Barbaree, 1990). Importantly, they seem to be particularly at risk for showing a
combination of instrumental and reactive aggression. In a juvenile sample, Kruh et al. (2005)
identified two subtypes of violent offenders: one group who was high on psychopathic traits
committed instrumental violence and reactive violence, and another group who did not show
these traits committed only reactive violence. Adult inmates with psychopathy also showed an
increased tendency to engage in instrumental aggression (Cornell et al., 1996). This link
between psychopathic traits and instrumental aggression is not only found in incarcerated
samples. In a school-based sample of children, those children with conduct problems and
psychopathic traits showed higher levels of both instrumental and reactive forms of aggression
(Frick et al., 2003).
Individuals with psychopathic traits evidence a particular information-processing bias,
similar to that associated with proactive aggression (Pardini, Lochman, & Frick, 2003).
Specifically, incarcerated youth with psychopathic traits were shown to emphasize the positive
outcomes of their aggressive behavior and to pay less attention to the adverse consequences
(Pardini et al., 2003). In addition, one of the primary personality features used to characterize
individuals with psychopathy is an emotional deficit (Cleckley, 1976). The presumption that
individuals with psychopathy lack emotions was supported by Cleckley’s (1976) description of
the psychopath’s “semantic dementia” and their superficial experience of emotions. The
emotional deficits described by Cleckley included a lack of nervousness, a general poverty of
persons with psychopathic traits may also share an emotional deficit with persons who show
instrumental aggression.
Psychopathy and Underreactivity
While there are only a few studies on the association between psychopathy and heart rate,
there is a large body of literature that has established a highly reliable association between low
resting heart rate and antisocial behavior or conduct problems (Raine, Reynolds, Venables, &
Mednick, 1997; Hubbard et al., 2002). A review conducted by Raine (1993) found 14 studies
that showed this association. Moreover, a meta-analysis conducted by Ortiz and Raine (2004)
confirmed that the association is present in both youths and adults.
Two general theories have been advanced to explain the autonomic underarousal
exhibited by antisocial individuals (see Williams et al., 2003): a fearlessness theory (reviewed
previously) and a stimulation-seeking theory. The stimulation- or sensation-seeking theory
postulates that low levels of arousal signal a physiological state that is similar to boredom (see
Williams et al., 2003). The aversive sensation of low arousal then motivates the individual to
increase his or her physiological level of arousal to a homeostatic level. This can be
accomplished by engaging in stimulation-seeking behaviors or otherwise risky behaviors. In
support of this theory, several studies have documented low heart rate levels in individuals who
engage in risky professions (e.g., paratroopers; Cox, Hallam, O'Connor, & Rachman, 1983;
McMillan & Rachman, 1987; Raine, 2002). A typical response to fear-inducing stimulus in
individuals is an increase in heart rate and blood pressure, essentially mobilizing the body to
“fight or flee.” However, to an individual with low arousal (and who is thereby
stimulation-seeking), fearful stimuli may serve to elevate the stimulation-seeking individual’s arousal levels,
thrill-seeking behaviors may act as a negative reinforcer (Raine, 2002). Consistent with this
possibility, one study found that preschool-aged children with low basal heart rates and
externalizing behavior problems are more likely to prefer watching more intensely angry
interactions between adults, as compared to those children with higher basal heart rate levels
(El-Sheikh, Ballard, & Cummings, 1994).
Individuals with psychopathy show analogous physiological findings, whereby they not
only show low basal levels of arousal, as indexed by either heart rate level or skin conductance
levels, they also show little to no phasic activity (see Hare, 1978). Phasic activity is typically
defined as a change in basal levels in response to a stimulus. Similar to the autonomic indices of
underreactivity uncovered in individuals with instrumental aggression, patterns of physiological
and emotional underreactivity have been shown in individuals with psychopathy (Patrick et al.,
1993; Levenston, Patrick, Bradley, & Lang, 2000; Williamson, Harpur, & Hare, 1991; Loney et
al., 2003). Patrick, Bradley, and Lang (1993) examined the reactions of criminals, with and
without psychopathic traits, to unpleasant and pleasant pictures (in respect to neutral pictures).
These investigators measured eyeblink startle potentiation (referred to as fear-potentiated startle),
which is normally enhanced for unpleasant stimuli and inhibited for pleasant stimuli. Criminals
without psychopathic traits showed a potentiated startle response to unpleasant images,
presumably due to an elicitation of the “fight or flight” prepotent response. In contrast, pleasant
images resulted in startle inhibition; responses to neutral images were linearly placed between
the reactions to pleasant and unpleasant stimuli. In contrast, criminals with psychopathic traits
showed a quadratic pattern of reactions to the pleasant, neutral, and unpleasant images, where
they exhibited startle inhibition to both pleasant and unpleasant stimuli. Importantly, their
the most different (exhibiting inhibition rather than potentiation) from the other criminals
(Patrick et al., 1993). Thus, psychopathy was associated with a deficient response to threatening
stimuli, but not to pleasant stimuli.
Levenston, Patrick, Bradley, and Lang (2000) sought to clarify which type of unpleasant
stimuli would uniquely characterize the deficiency of the startle magnitude in individuals with
psychopathy. They reported that directly threatening images potentiated the startle reflex in
criminal psychopaths, although this response was not evident at shorter latencies between
presentation of the image and the startle probe. However, unlike individuals without
psychopathy, who showed potentiation of startle to victim scenes (some of which depicted
mutilated bodies), individuals with psychopathy showed inhibition of startle. Moreover,
individuals with psychopathy exhibited decreased heart rate in response to all images, regardless
of valence, possibly indicating an orienting (i.e., attention) response rather than an expected fear
or distress response (Levenston et al., 2000). Thus, criminal psychopaths were underreactive to
victim scenes, as well as to threat scenes when initially presented.
A lexical decision task is a task that is designed, using words and non-words, to disguise
the intent of examining emotional processing in antisocial individuals. During this task,
individuals are asked to respond to whether a set of letters forms a word or not. Reaction times
are then examined, whereby the typical response for the average person is to respond to the
emotional words more rapidly (i.e., to show facilitation). This is presumably because of the
automatic allocation of attention to motivationally significant stimuli (Williamson et al., 1991).
Indeed, Williamson et al. (1991) found that adults with psychopathy failed to show a
Adolescents with psychopathic traits also failed to show facilitation to words of negative
valence on the lexical decision task (Loney et al., 2003). In fact, they exhibited slower response
times to negatively charged words, suggesting that negative words were processed more
extensively than neutral words (Loney et al., 2003). Thus, youths and adults alike did not show
an immediate allocation of attention to negatively charged words, relying instead on more
upper-level processing mechanisms. These mechanisms might allow for individuals who fail to
experience an automatic biological response to be able to cognitively recognize emotional
stimuli. Thus, individuals with psychopathic traits do not experience emotions, yet retain the
knowledge of emotions. Consistent with this possibility, when adolescents are asked to rate the
emotional valence of words, the ratings of those high on psychopathic traits did not differ from
those low on these traits.
Another study examined reactions to facial expressions rather than to words. Adults with
psychopathy showed a reduced ability to recognize fearful expressions (Blair, Colledge, Murray,
& Mitchell, 2001). Additionally, Blair, Colledge, Murray, and Mitchell (2001) found that
children with psychopathic traits had difficulty recognizing fearful and sad facial expressions.
Children with psychopathic traits also were more impaired in the recognition of sad vocal
inflections (Stevens, Charman, & Blair, 2001). However, no differences were evidenced in the
recognition of angry facial expressions or vocal inflections (Blair et al., 2001; Stevens et al.,
2001). Based on this study and that of Levenston et al. (2000), individuals with psychopathy
appear to experience difficulties with the processing of emotional stimuli indicative of others’
Psychopathy and Anger
In order to understand the relation between anger and psychopathy, it is necessary first to
distinguish it from aggression (Felson, 2000). Anger is the emotion that, when experienced, may
spur the individual to action. By contrast, other negative emotions may be associated with
withdrawal instead of action (i.e., fear; Christie & Friedman, 2004). Aggression has been defined
as the behavior with the intent of harming another person. Although anger can lead to an
external expression of that anger, this is not always the case (Felson, 2000; Strayer & Roberts,
2004). That is, most people experience anger without acting aggressively. Also, there are some
forms of aggression that may not be accompanied by anger, such as proactive or instrumental
aggression.
Due to Cleckley’s (1976) description of psychopathy as lacking genuine expressions of
emotion, including anger, it was presumed that the overt expressions of anger (e.g., facial
expressions, gestures, verbalizations) were mere dramatic displays lacking affective bases (see
Steuerwald & Kosson, 2000). Typically, an expression of anger or threat serves to inhibit
agonistic behavior in primates (see Izard, 1991). For example, a child who demands a toy from a
peer should elicit resistance and anger from the peer. The child with psychopathic traits would
likely show an expression of anger to gain compliance from his or her peer with such a reaction.
Some psychological disorders, including psychopathy, were described by Berenbaum et
al. (2003) specifically with regard to disturbances either in valence or emotional
intensity/regulation. Various disturbances are distinguished by the extent to which unpleasant
and pleasant emotions are affected. An emotional valence disturbance is characterized by an
unbalanced intensity in the expression of one form of emotion, either unpleasant or pleasant,
whereas pleasant emotions include happiness, pride, love, and interest. Berenbaum et al. (2003)
classify antisocial personality disorder as a disturbance in emotional valence, characterized by
normal yet predominant levels of pleasant emotions.
In contrast to an emotional valence disturbance, a disturbance in intensity/regulation is
characterized by excessively high or low intensity pleasant and unpleasant emotions. A
disturbance in intensity is characterized by extremes in both polar ends, and emotion regulation
can either be excessive or inadequate. Thus, disturbances in intensity/regulation can be
characterized as either hyporeactive or hyperreactive. For example, depression and the
flat-affect associated with it are indicative of hyporeactivity (Berenbaum et al., 2003).
However, several investigators assert that individuals with psychopathic traits do
experience anger (Steuerwald & Kosson, 2000). McCord and McCord (1964 as cited in
Steuerwald & Kosson, 2000) argued that, in individuals with psychopathy, anger frequently
results from their ineffective coping strategies to handle everyday frustrations. In spite of this,
the heart rate reactivity literature, which has historically focused on the experience of fear and
anxiety, has left virtually unstudied the physiological experience of anger in individuals with
psychopathic traits.
One notable exception is a study of subjective experiences of anger and of bodily
sensations during anger-evoking scenarios in adults classified as psychopathic(Blackburn &
Lee-Evans, 1985). Aggressive responses to the hypothetical scenarios were also examined.
Individuals with psychopathy, as well as other antisocial individuals, reported more intense
reactions (i.e., more anger and aggressive responses) than controls. However, individuals with
arousal: individuals with psychopathic traits reported fewer somatic arousal symptoms than
antisocial individuals without psychopathy (Blackburn & Lee-Evans, 1985).
Similarly, Gottman et al. (1995) observed couples, who had abusive histories in their
relationships, engage in a heated argument. All the men were rated as demonstrating extreme
expressions of anger during the argument. However, the wife batterers who showed
psychopathic traits exhibited decreased heart rates during the marital conflict, in contrast to the
increase in heart rate exhibited by the other men (Gottman et al., 1995). Therefore, a reduction
in emotional reactivity characterized those with psychopathic traits, despite the fact that their
emotional expression suggested anger.
A Dissociation between Expressed and Experienced Emotion in Psychopaths
As suggested by the results found with proactive aggressive children (Hubbard et al.,
2002) and with individuals with psychopathic traits (Gottman et al., 1995; Blackburn &
Lee-Evans, 1985), a disconnection seems to exist between the physiological response indicative of
emotional experience and the expression of emotion in some individuals. Indeed, Cleckley
(1976) proposed that the linguistic and experiential components of emotion are discordant in
individuals with psychopathy. Some investigators have suggested that the individual with
psychopathy “knows the words but not the music” (see Hare, 1993): he or she may cognitively
recognize emotions, though they may not actually experience them. Thus, these individuals may
show behaviors suggesting emotional experience that are unaccompanied by any genuine
experience of the emotion, such that they may express “vexation, spite, quick and labile flashes
of quasi-affection, peevish resentment, shallow moods of self-pity, puerile attitudes of vanity,
In support of the dissociation between emotional experience and emotional recognition,
research has indicated that individuals with psychopathy were able to accurately interpret the
emotional significance of slides (Christianson et al., 1996), while still exhibiting reduced
physiological responding to those slides (Blair, Jones, Clark, & Smith, 1997; Hare, 1978;
Patrick, Cuthbert, & Lang, 1994; also see Lykken, 1995). Additionally, in spite of showing
deficits in the emotional processing of words, both adults (Williamson et al., 1991; Patrick et al.,
1993; Christianson et al., 1996) and adolescents (Loney et al., 2003) with psychopathic traits
were able to effectively identify and rate emotional words. Patrick et al. (1993) also observed a
dissociation of self-report and emotional expression from physiological reactivity in individuals
with psychopathy, whereby despite showing an abnormality in the physiological processing of
emotional stimuli, the people with psychopathic traits were able to recognize the emotional
content of such stimuli. Finally, individuals with psychopathy reported emotions similar to
individuals without psychopathy, while still reporting less intense bodily sensations in reaction to
emotional film clips (Pham, Philippot, & Rime, 2000).
The Present Study
Based on this research, it is proposed that the arousal experienced in proactive aggressive
individuals in response to unpleasant stimuli is weak. In contrast, reactive aggression is
proposed to be characterized by an emotional valence disturbance that primarily involves
unpleasant emotions, whereby they experience greater arousal to unpleasant or undesirable
outcomes. As a result, reactive aggressive individuals are prone to experience great increases in
arousal concurrent with intense anger to undesirable outcomes, and they may experience
difficulty in regulating their arousal. Proactive aggressive individuals who experience an
emotions. Instead, their aggression results from poor regulatory behaviors. Moreover, based on
the literature, both reactive aggression and proactive aggression show low levels of basal arousal
though they clearly differ with regard to their reactivity. The low reactivity in those who exhibit
proactive aggression is similar to the emotional deficits found in individuals with psychopathic
traits. Consistent with this link, individuals with psychopathic traits are more likely to display
proactive aggression than are those without psychopathic traits.
Taken together, this research could explain a) why proactive aggressive individuals also
show reactive aggression, despite showing low reactivity and b) why persons with psychopathic
traits show angry responses despite a deficit in their emotional responsiveness. Both are
hypothesized to show a disconnection between their emotional experience and their emotional
expression, as indicated by low reactivity and poor regulatory controls of aggressive behaviors.
In contrast, individuals who solely engage in reactive aggression typically show anger
accompanied by high reactivity, suggesting that their aggression results from a dysregulation of
their heightened physiological arousal to unpleasant events. Although research has documented
emotional processing deficits in those with psychopathic traits, existing research has failed to
examine angry responses in youth high on psychopathic traits.
The present study examined the emotional responses of 85 boys held in a juvenile
detention center for committing serious delinquent acts. Participants completed a reaction time
computer provocation task. Callous-unemotional (CU) traits were measured as the affective
component of psychopathic traits. Physiological responses (heart rate and skin conductance
level) to the laboratory computer task were measured.
The current study tested five main hypotheses. The first hypothesis was that youth who
during the computer task. A low aggressive group was hypothesized to show lower levels of
aggression during the computer task. Second, the group high on both forms of aggression was
predicted to show high rates of CU traits. Third, both groups of highly aggressive children were
predicted to show lower resting levels of arousal. Fourth, children characterized by reactive
aggression were predicted to evidence greater physiological reactivity during the computer task,
particularly when examining their discrete responses to provocation, than both the other groups.
Fifth, the mixed group was hypothesized to exhibit the lowest levels of physiological reactivity
in response to provocation.
Method
Procedure
All procedures were approved by the Institutional Review Board of the University of
New Orleans. All parents of youth referred to Rivarde Detention Center, who had valid phone
numbers or addresses, were contacted by a detention center staff member. The staff member told
the parent or legal guardian that a study was being conducted by researchers at the local
university, and asked permission to forward their phone number to the researchers. Those
parents who agreed to be contacted by the researchers were phoned and had the study procedures
explained to them. Parents or legal guardians who agreed to have their child participate were
asked to have the consent process tape-recorded and were subsequently mailed a copy of the
consent form for their records.
Children were individually tested in a designated room at the detention center by two
examiners. Prior to the computer provocation task (i.e., CRTT), all procedures were reviewed
with the child and an assent form was explained and signed. During the CRTT, heart rate
An investigator placed three Silver-Silver Chloride (Ag-AgCl) electrocardiogram electrodes
(measuring heart rate) on the child’s torso. In order to measure skin conductance, two Ag-AgCl
electrodermal conductance electrodes were attached to the two middle phalanges of the
non-dominant hand.
Each participant was read the script about the “game” (the CRTT) and was told that
sensors would record their physiological activity while they played. They were told that they
would be competing against another boy of about the same age in another facility.
After completion of the CRTT, each participant completed the CRTT
deception-assessment questionnaire and he was told that he won the game and that he would receive a
candy bar later in the day. The participant then completed the Peabody Picture Vocabulary Test
(Dunn & Dunn, 1997)with the experimenter. Later in each day, that day’s group of participants
(attendance ranging from one to four) who had completed the CRTT was brought together to
complete the Inventory of Callous-Unemotional traits, the Self-Report of Delinquency, and the
Peer Conflict Scale. The questionnaires were read aloud to all participants by a researcher, and a
different researcher was available to help answer participant questions and to ensure completion
of every item. The group was then given soft drinks and their respective candy bars as
compensation. After the release of the participant from the Rivarde Detention Center, a letter
expressing gratitude for their participation and debriefing the participant about the deception
used for the CRTT was sent to the participant’s home.
Participants
One hundred twenty-six parents were contacted by the researchers and 117 (93%) gave
consent. Out of those 117, five boys (4%) were released before they could be contacted for
missing data: during the lunch break before questionnaires were to be completed, one participant
was separated from the other residents in “lock down,” so questionnaires could not be completed
with him. The other had data missing due to experimenter error. All youth who had a Peabody
Picture Vocabulary score less than 66 (n=13) were eliminated from analyses due to concerns
about their ability to understand the questionnaires. Two other participants were eliminated from
subsequent analyses because their aggressive responding on the competitive provocation task
was below three standard deviations from the group mean, and it was unclear whether they
understood the task (Miller & Lynam, 2003).
The final sample included 85 boys between the ages of 13 and 18 (M=15.53, SD=1.28),
who were detained at Rivarde Juvenile Detention Center. Typically, after being arrested in
Jefferson Parish, children are either released into their parents’ custody to await trial, or they are
detained at the Rivarde Juvenile Detention Center. The decision to detain rests on the history of
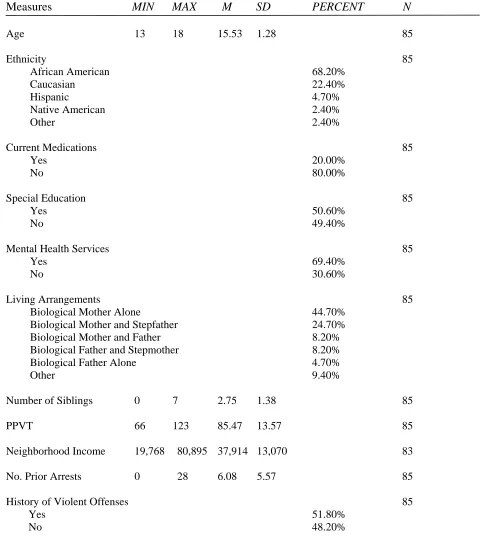
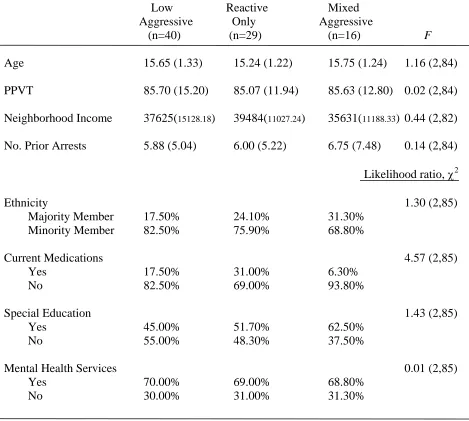
previous arrests and on the severity of the crime. Table 1 notes the characteristics of the sample.
The majority (68.6 %) of the sample self-identified as African American and 22.1 % were
Caucasian. Only 4.7 % of the sample was Hispanic, 2.3 % Native American, and 2.3 % chose
the “other” category. Based on self-report, 17% percent were taking psychotropic medications,
50 % had been in special education classes in school before going to the detention center, and
68.6 % had received mental health services. Also based on self-report, 84% percent of the
sample had parents who were divorced or never married, and 70% lived with just their biological
mother or with their mother and stepfather. According to participants, at least one of each of the
youth’s guardians was employed (82 % of male guardians and 70 % of female guardians). Most
(70 %) of the offenses committed by samples of detained boys at this detention center were
of the institutionalized population of juvenile offenders in Louisiana is incarcerated for
non-violent offenses. However, 51 % had a history of at least one non-violent offense based on chart
review.
Measures
Peabody Picture Vocabulary Test (PPVT; Dunn & Dunn, 1997). The PPVT is a brief
norm-referenced measure of verbal ability for those ages 2.5 to 90years . This test assesses a
child’s receptive language abilities. The standardized scores of the third revision of the PPVT
correlated .90 with the Full-Scale IQ scores from the Wechsler Intelligence Scale for Children,
Third Revision in a sample of 41 children ages 7 year, 11 months through 14 years, 4 months
(Dunn & Dunn, 1997). The correlation with Verbal Scale IQ was slightly higher than the
correlation with Performance Scale IQ (.91 and .82, respectively). The PPVT was also validated
using the Kaufman Adolescent and Adult Intelligence Test with 28 adolescents age 13 years
through 17 years, 8 months (Dunn & Dunn, 1997). The correlation with crystallized IQ was
slightly higher than with fluid IQ (.87 and .76, respectively). It was correlated .85 with the
composite IQ score.
Competitive Reaction Time Task (CRTT; Waschbusch et al., 2002). Each participant
played a computer game that is similar to provocation tasks used in previous studies with
children (Waschbusch et al., 2002; Murphy, Pelham, & Lang, 1992). Each participant was read
a script about the game. The task consisted of a 10 to 15 minute reaction-time game played with
a hypothetical opponent. Participants were seated at a table with a desktop computer, equipped
with audio speakers and a microphone, to play the game. They were told that they would be
playing against a boy of the same age at another facility whose computer was linked to theirs.
hypothetical peer and that, when they won, they would be awarded 50 points and they could take
away 0-100 points from the other boy. They could also send a short verbal message to the other
player. Participants were told that the other boy could take away 0-100 points when he won.
Further, pre-recorded verbal messages by a young adult male from the local area were played
over the computer when a loss occurred. Two losing trials never occurred in succession. Lastly,
participants were told that those youth who scored at least 750 points at the completion of the
game would get their choice of candy bar. In actuality, however, all participants received a
candy bar.
The game was pre-programmed for the same 16 losses out of 48 trials for each
participant. Eight of 16 loss trials were high provocation trials, whereby a highly aversive verbal
message (e.g., “I beat you again, dork! You lose another 80 points”) was broadcast and between
80-100 points were subtracted by the hypothetical opponent. The other eight of the 16 loss trials
were low provocation trials, whereby a less-provoking verbal message (e.g., “I won, but I’ll give
you a break; I’ll just take 10 points”) was broadcast and between 0-20 points were subtracted by
the hypothetical opponent. For each participant, the computer indicated a win on the remaining
32 of the 48 trials, resulting in a net win of 780 points. Immediately after the win signal, the
participant was allowed to record a verbal message via the computer for his “opponent” and was
allowed to take between 0 and 100 points from the other boy. However, only 10 percent
recorded a message for their opponent. Total aggressive responding was measured by the
number of points taken away from the hypothetical peer on the win trials. These separate
aggression measures were also computed based on the level of provocation. A measure of
aggressive responding to no provocation was obtained by examining aggressive responding
aggressive responding to provocation resulted from examining aggressive responding during low
provocation and during high provocation trials. As another measure of reactivity, during each of
the 16 loss trials, the examiner electronically placed a mark on the psychophysiological record,
as the data scrolled across the screen, to indicate the end of each taunt received by the participant
to later calculate their emotional responding offline.
This task was chosen because it has been validated with adults and children alike (Taylor
& Gammon, 1975; Zeichner & Pihl, 1979; Hubbard et al., 2002; Murphy et al., 1992; Pelham et
al., 1991). Differences have been shown in boys with and without disruptive behavior disorders
in their level of aggressive responding to both high and low provocation trials (Waschbusch et
al., 2002). Giancola and Chermack (1998) have argued for the construct validity of competitive
tasks such as this, and Anderson, Lindsay, and Bushman (1999) have found support for
laboratory tasks on aggression by performing meta-analyses and finding that the results are
comparable to results in field studies on aggression . Consistent with the definition of aggression
as intent of harming another person, the intentional removal of points from one’s opponent
ostensibly harms the opponent’s aim to win and gain a prize (Giancola & Chermack, 1998).
Participants were read the following instructions:
“You will be playing a computer game with another boy who is in another
facility. In the game, both of you can win and lose points. The game is set up to
see how fast you can respond to a command from the computer. You place your
hand here and after you see “Ready” “Set” “Go,” a target will appear on the
computer screen. When you see the target, you press the space bar as fast as you
can. When you push the space bar faster than the other boy, you win that time.
that will be played for the other boy. In the message, you can tell him whether
you are taking away any points from him, and if so, how many. You can take
anywhere from 0 to 100 points from the other boy, in steps of 10. So on the
times you win you can decide to take away 0, 10, 20, 30, 40, 50, 60, 70, 80, 90,
100 points from the other boy. After you win a trial, you decide how many points
you want to take away from the other boy, and I will put it into the computer.
Each time the other boy pushes the space bar faster than you do, he wins 50
points, and he will get to take away points from you. How many points he
decides to take away from you each time he wins will show up on the counter in
the top right hand corner of the screen. If you score at least 750 points, you will
get your choice of candy bar that you’ll get this afternoon, where you will also
fill out some questionnaires.”
The ultimate goal of measuring aggressive responding was never mentioned to the
participants. In order to aid deception, the examiner carried a cellular phone, which was
connected to the computer and simulated an Internet connection with the other computer at the
hypothetical other facility to start the game. The simulation included a scripted problem with the
connection with the other facility, which was subsequently resolved in front of the participant.
After completion of the computer game, children completed a questionnaire to determine
whether the deception was successful.
Evaluation of instructional deception. After completion of the session, participants were
given a questionnaire where they were asked 1) to describe the other person with whom they
were paired, 2) to estimate whether they had subtracted more or less money than the other
assess whether the participant maintained a belief in the existence of another person with whom
they played (Pope, Kouri, & Hudson, 2000).
Peer Conflict Scale (PCS; Marsee, Kimonis, & Frick, 2004). The Peer Conflict Scale
(PCS) was developed to overcome the limitations of previous measures of reactive and proactive
aggression (Little, Jones, Henrich, & Hawley, 2003). Specifically, the proactive subscale was
broadened to include not only aggression for gain, but also aggression for dominance (e.g.,
“When I hurt others, I feel like it makes me powerful and respected”), aggression for sadistic
reasons (e.g., “I enjoy hurting others”), and unprovoked and premeditated aggression (e.g., “I
carefully plan out how to hurt others”). The reactive subscale was also expanded to include not
only emotionally provoked, angry aggression, but also impulsive, thoughtless aggression (e.g.,
“Most of the times that I have gotten into arguments or physical fights, I acted without
thinking”).
The PCS was developed through several steps. First, all items assessing reactive,
proactive, overt, and relational aggression from existing scales, including the Aggressive
Behavior Rating Scale (Brown, Atkins, Osborne, & Milnamow, 1996), the Aggressive Subtypes
Scale (Dodge & Coie, 1987), the Direct and Indirect Aggression Scales (Bjorkqvist, Lagerspetz,
& Osterman, 1992), and aggression scales created by Little et al. (2003), Crick and Grotpeter
(1995) and Galen and Underwood (1997), were pooled and items that were not clearly related to
harm were deleted. Second, items were reworded to ensure that there was direct correspondence
between overt and relational items, such that for each reactive overt item there was an analogous
reactive relational item, and for each proactive overt item, there was an analogous proactive
relational item. A team of faculty, graduate, and undergraduate students then reviewed these
led to the creation of the PCS that includes ten items in each of the four categories: proactive
overt (“I carefully plan out how to hurt others”), proactive relational (“I gossip about others to
become popular”), reactive overt (“If others make me mad, I hurt them”), and reactive relational
(“If others make me mad, I tell their secrets”). Only the overt scales were examined in the
present study. One item (“I like to hit kids smaller than me”) was removed from analyses
because its variance was 0. Cronbach’s alpha was examined and both the proactive and reactive
overt scales showed good internal consistency (α’s = .77 and .86, respectively).
Inventory of Callous-Unemotional Traits (ICU; Frick, 2004). The ICU is a 24-item
self-report scale designed to assess callous and unemotional traits in youth. The ICU was derived
from the CU scale of the Antisocial Process Screening Device (APSD; Frick & Hare, 2001). The
CU component of the APSD has emerged as a distinct factor in both clinic and community
samples (Frick, Bodin, & Barry, 2000) and has been shown to identify a distinct subgroup of
children with conduct problems that are more severe than other children with conduct disorder
(Christian, Frick, Hill, Tyler, & Frazer, 1997).
However, the self-report CU scale has demonstrated only moderate internal consistency
in past studies (e.g., Loney et al., 2003), which is likely due to its small number of items (n = 6)
and three-point rating system. Also, 5 out of the 6 items are worded in the same direction,
increasing the possibility of response bias. The ICU was developed to overcome these
limitations. It was constructed based on a factor analysis of parent and teacher ratings on the
APSD, using the four items that loaded significantly on the CU scale in both clinic-referred and
community samples (Frick et al., 2000). These four items (“is concerned about the feelings of
others,” “feels bad or guilty,” “is concerned about schoolwork,” and “does not show emotions”)
four-point scale (0 = “not at all true,” 1 = “somewhat true,” 3 = “very true,” and 4 = “definitely true”).
Two items (“What I think is “right” and “wrong” is different from what other people think,” and
“I do not let my feelings control me”) showed poor relations with the other items on the scale
(corrected item total correlations were -.04 and -.27, respectively), and thus were removed. The
ICU score was the sum of the remaining 22 items (reverse-scoring 12 of the items), which
showed acceptable internal consistency (α = .72).
Self-Report of Delinquency (SRD; Elliott & Ageton, 1980). The SRD was developed from
a list of all offenses reported in the Uniform Crime Report with a juvenile base rate of greater
than 1% (Elliott & Huizinga, 1984) and it lists 36 questions about illegal juvenile acts. The
youth reports whether or not a specific act has ever occurred, the number of times the act has
occurred, and the age at which the act first occurred. The general delinquency scale totals the
number of delinquent acts across all items (Krueger et al., 1994). This scale assesses for the
frequency of specific types of delinquent acts, including drug offenses (9 items), violent offenses
(8 items), property offenses (10 items), status offenses (4 items), and sexual deviance (3 items).
Drug offenses, property offenses, status offenses, and sexual deviance items were combined to
create a non-violent offenses variable. However, the one sexual deviance item (“Have you ever
had sexual intercourse with someone against their will”) relating to the use of violence was
eliminated due to a variance of 0. Thus, summing the respective items created a total general
delinquency scale, a violent delinquency scale, and a non-violent delinquency scale. The violent
delinquency scale showed moderate internal consistency (α = .62), while the total and
non-violent scales showed good internal consistency (α’s = .87 and .84, respectively)
Autonomic Psychophysiology. The electrocardiogram (ECG) was recorded via three
left rib, and lower right rib (ground). Electrodermal activity (EDA) was recorded via two
electrodes placed on two fingers of the non-dominant hand.
The ECG and EDA were recorded using Thought Technology’s ProComp Infinity
encoder connected to a laptop computer (Pentium 4, 256MB RAM) equipped with Biograph
Infinity software (versions 1.0.2 and 2.0.1). Sampling for ECG was set at 2048 Hz for data
processing and EDA was set at 256 Hz. Editing the ECG files consisted of scanning the data
for outlier points with respect to adjacent data and marking the points for exclusion in any
analyses. Heart rate (HR) means were derived from the ensemble-averaged ECG for the
entire task duration. Skin conductance level (SCL) means were derived from EDA for the
entire task duration.
Phasic activity, also referred to as physiological reactivity, is usually measured as a
deviation, either a decrease or an increase, from a control value often derived from a resting
state, and is presumed to reflect an individual’s response to an environmental stimulus (Stern,
Ray, & Quigley, 2001). Reactivity has been regarded as a stable pattern of an individual’s
response tendencies that reflects temperamental characteristics (Porges, 1996; Kagan, Reznick,
& Snidman, 1990; Calkins & Dedmon, 2000). Given that autonomic measures, such as heart
rate and skin conductance, are noninvasive, they have been the most widely studied indices of
physiological reactivity. When in a resting state, the parasympathetic branch of the autonomic
nervous system is more engaged than the sympathetic branch. Since the parasympathetic
nervous system regulates heart rhythm via the 10th cranial nerve (the vagus nerve), this serves to
decrease heart rate. However, when exposed to stress, there is a surge of sympathetic activation,
After a 10-minute stabilization period, autonomic activity (i.e., heart rate and skin
conductance) was measured for 3 minutes prior to the CRTT and during the 9- to 11-minute
CRTT in order to obtain baseline and phasic measures. Heart rate (number of beats during the
3-minute period divided by the number of 3-minutes) and SCL (average level during the 3-3-minute
period) provided baseline HR and baseline (i.e., tonic) SCL. Heart rate and SCL during the
CRTT provided phasic HR and phasic SCL. The changes (0.01 microsiemens or greater) in level
after 1 second but before 4 seconds of the end of low-provocation and high-provocation taunts,
was obtained and averaged as the dependent measures of skin conductance response (SCR) to
low provocation and SCR to high provocation (Stern et al., 2001). Measuring SCR allows for
more discrete responses to specific provocation levels that may provide a better index of
emotional reactivity.
Stern et al. (2001) suggest two ways in which to analyze phasic HR activity, which can
be influenced by initial values (baseline values). Analyses involving change scores, where
baseline values are subtracted from phasic values, assume independence of these measured
values. However, high levels are less likely to increase further and low levels are less likely to
decrease further as a result of homeostatic mechanisms. For example, a change in HR from 50 to
65 may require less metabolic energy than a change from 100 to 105. In order to compare
individuals who may begin with varying initial levels, Stern et al. suggested that baseline levels
be entered as covariates in an Analysis of Covariance instead of using change scores (Stern et al.,
2001). According to Stern et al. (2001), because skin conductance is unaffected by initial values,
baseline levels are independent from task levels. Thus, a change from baseline to the CRTT in
Results
Data Inspection
Only 10 percent of the participants chose to record a message for their “opponent.”
There was some evidence that 8 participants might have suspected that they were playing against
a computer and not a real person. On the deception evaluation questionnaire, one participant
stated that he was playing against a computer when asked to describe his opponent. Two others
expressed that it might be a computer. The other 5 participants characterized their opponent as a
real person, but had made comments during the game that they thought it might be a computer.
Consistent with Pope et al. (2000), participants were judged to have correctly guessed that their
opponent was a computer if they both (1) failed to show any aggressive responding and (2) stated
their suspicion on the post-task evaluation. No participant met both criteria; thus, all eight
participants were included in analyses. Nevertheless, all main analyses were repeated eliminating
these eight participants and the results were similar to those presented (e.g., number of prior
arrests was still positively related to aggressive responding during no provocation trials, r (77) =
.25 from r (85) = .27). Outliers were identified by examining values that were greater than three
standard deviations above or below the sample mean. Using these criteria, a few were identified
with respect to the psychophysiological indices: one phasic HR, two baseline SCL, one SCR to
high provocation, and three SCR to low provocation scores. These scores were not included in
analyses.
Validation of the Provocation Task
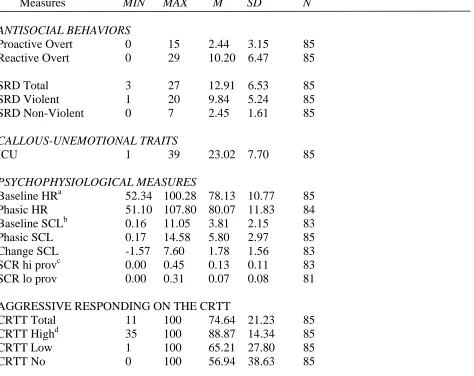
Table 2 provides the distribution of the primary variables used in analyses. As a group,
the participants were expected to increase their psychophysiological activity as well as their
Paired-samples t-tests revealed that physiological activity increased from the baseline period
immediately before the CRTT to the time during the CRTT. Baseline1 and phasic heart rate (HR)
were significantly different (t (83)= 3.79, p < .001) and baseline and phasic skin conductance
level (SCL) also differed significantly (t (82)= 10.43, p < .001). Mean skin conductance response
(SCR) to high provocation (hi prov) were significantly higher than to low provocation (lo prov)
(t (79)= 4.86, p < .001).
Table 2 also lists the results of paired-samples t-tests that served as manipulation checks
for the effects of the level of provocation on aggressive responding. Mean aggressive responding
differed across all pairwise comparisons. Aggressive responding was greater after low
provocation trials as compared to no provocation trials (t (84)= 2.17, p < .05), was greater after
high as compared to low provocation trials (t (84)= 9.20, p < .001), and greater after high as
compared to no provocation trials (t (84)= 8.36, p < .001).
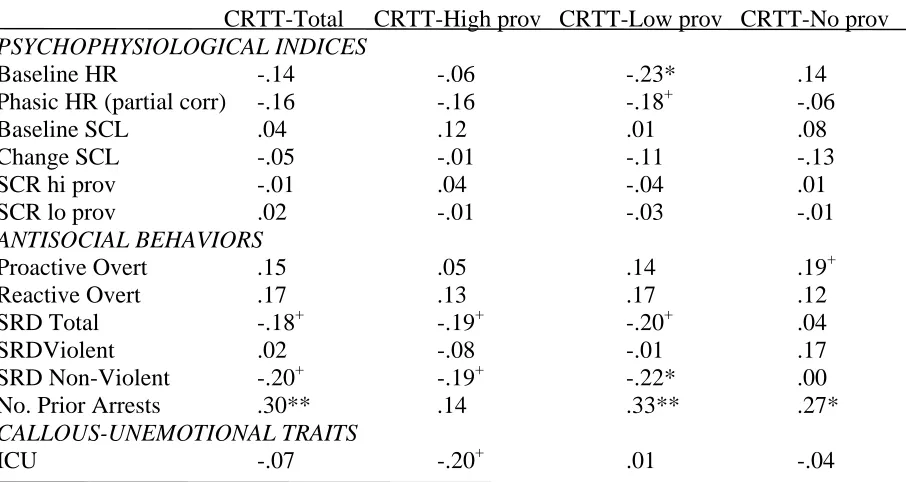
The CRTT’s construct validity was examined by correlating task performance with
physiological indices1, measures of violent and antisocial behavior, and callous-unemotional
traits. All correlational analyses with phasic HR were performed while controlling for baseline
HR. As shown in Table 3, only one of the psychophysiological indices was related to aggressive
responding on the task. Low baseline heart rates characterized those who exhibited high
aggressive responding to low provocation (r (85)= -.23, p<.05). ICU scores were unrelated to
aggressive responding. Non-violent delinquency scores were negatively related to aggressive
responding at low provocation (r (85)= -.22, p<.05). More non-violent delinquent acts were
1
Baseline HR was significantly and negatively correlated with age (r (85)= -.27,
p<.05). All analyses with the psychophysiological indices were repeated controlling for age
associated with less aggressive responding on the CRTT. Number of prior arrests was positively
related to total aggressive responding (r (85)= .30, p<.01), aggressive responding to low
provocation (r (85)= .33, p<.01) and to no provocation (r (85)= .27, p<.05).
Cluster Analysis to Form Aggressive Groups
Prior to conducting a cluster analyses on the two subscales (proactive overt and reactive
overt aggressive subscales) of the PCS, the subscale scores for the 85 participants were first
converted into standard (z) scores. A two-stage approach that is described below was then used
to ascertain whether distinct types of aggressive groups could be identified based on these
standard scores.
First, the results of four K-means cluster analyses were examined. The K-means cluster
analysis is a non-hierarchical iterative-partitioning procedure conducted with the SAS
FASTCLUS procedure (SAS 8.0). In the k-means method, the approximate expected overall R2,
and the cubic clustering criterion were calculated for sets of two, three, four, and five clusters.
The change in R2 and cubic clustering criterion are shown in Figure 1 and Figure 2 for all four
k-means cluster analyses. The cubic clustering criterion is an index that is based on the amount of
variance explained by a cluster relative to the amount of variance that would be expected if the
clusters were drawn from a random, uniform hyper-rectangular distribution. Based on these
indices, the four-cluster solution was chosen because the overall R2 (Figure 1) and the cubic
clustering criterion (Figure 2) increased significantly from the specified three- (.68 and 2.4) to
four- (.77 and 4.2) cluster result. Additionally, in this cluster solution, the cluster centers for the
primarily reactive group failed to show a distinct separation between the means for reactive and
proactive scores. Specifying the four-cluster solution resulted in some of the cases from the
which also resulted in a more distinct primarily reactive group (n=29). Of importance, the
five-cluster solution resulted in a decrease in the cubic five-clustering criterion.
The four-cluster solution revealed a primarily reactive cluster (n=29), a low aggressive
cluster (n=40), and two mixed clusters differing largely in the severity of their aggression: one
lower (n=12) and one greater (n=4) in severity. The four-cluster solution resulted in a pseudo F
statistic and approximate expected overall R2 of 135.02 and .77, indicating that the k-means
procedure had produced distinct PCS types that adequately explained large proportion of the
covariation among the scores of the four subscales. To prevent the possibility that the first few
cases selected influenced the cluster iterations and cluster centers, the cluster analyses were
repeated twice after resorting the data set and identical results were found across these analyses
Based on cluster analyses involving clinical and community samples
(Kochenderfer-Ladd, 2003; Vitiello et al., 1990), three groups were expected to emerge (i.e., reactive
aggressive, mixed aggressive group, and non-aggressive). However, two groups emerged in the
four-cluster solution that had mixed elevations that differed in severity. Thus, the two mixed
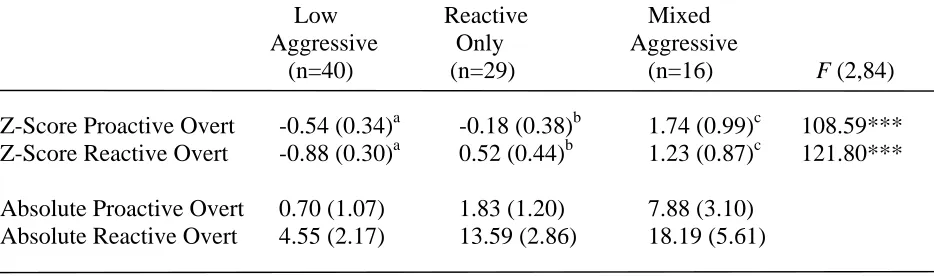
proactive/reactive clusters were combined, resulting in a group labeled mixed aggressive (n=16).
The group with low scores on both was labeled low aggressive (n=40), and the group with
elevated scores on the reactive subscale was labeled reactive only (n=29). Means and standard
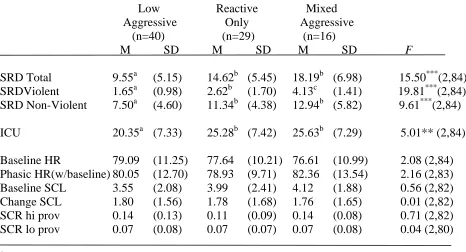
deviations of the three groups are noted in Table 4. A one-way analysis of variance (ANOVA)
revealed that the three groups in fact differed on reactive and proactive overt aggression scores
(F (2,84) = 121.80, p < .001, and F (2,84) = 108.59, p < .001, respectively). Post hoc paired
comparisons were made using Tukey's Honestly Significant Difference (Tukey’s HSD). These