BIBECHANA
A Multidisciplinary Journal of Science, Technology and Mathematics
ISSN 2091-0762 (Print), 2382-5340 (0nline)
Journal homepage: http://nepjol.info/index.php/BIBECHANA
Publisher: Research Council of Science and Technology, Biratnagar, Nepal
Study on the effect of growth-time and seed-layers of Zinc Oxide
nanostructured thin film prepared by the hydrothermal method for
liquefied petroleum gas sensor application
Guna Nidhi Gnawali1, Shankar P Shrestha2, Khem N Poudyal3, Indra B Karki2
, Ishwar Koirala3*
1Advanced College of Engineering and Management, TU 2 Patan Multiple Campus, TU
3 Central Department of Physics, Kirtipur, TU *Email: ikphysicstu @gmail.com
Article history: Received 12 September, 2018; Accepted 1 November, 2018
DOI: http://dx.doi.org/10.3126/bibechana.v16i0.21556
This work is licensed under the Creative Commons CC BY-NC License. https://creativecommons.org/licenses/by-nc/4.0/
Abstract
Gas sensors are devices that can convert the concentration of an analytic gas into an electronic signal. Zinc oxide (ZnO) is an important n-type metal oxide semiconductor which has been utilized as gas sensor for several decades. In this work, ZnO nanostructured films were synthesized by a hydrothermal route from ZnO seeds and used as a liquefied petroleum gas (LPG) sensor. At first ZnO seed layers were deposited on glass substrates by using spin coating method, then ZnO nanostructured were grown on these substrates by using hydrothermal growth method for different time duration. The effect of growth time and seed layers of ZnO nanostructured on its structural, optical, and electrical properties was studied. These nanostructures were characterized by X-ray diffraction, scanning electron microscopy, optical spectroscopy, and four probes sheet resistance measurement unit. The sensing performances of the synthetic ZnO nanostructures were investigated for LPG.XRD showed that all the ZnO nanostructures were hexagonal crystal structure with preferential orientation. SEM reviled that the size of nanostructure increased with increase in growth time. Band gap and sheet resistance for ZnO nanostructured thin film decreased with increase in growth time. ZnO nanostructured thin film showed high sensitivity towards LPG gas. The sensitivity of the film is observed to increase with increase in no of seed layers as well as growth time. The dependence of the LPG sensing properties on the different growth time of ZnO nanostructured was investigated. The sensing performances of the film were investigated by measured change in sheet resistance under expose to LPG gas.
Keywords: Gas sensor; Nanostructure; Hydrothermal growth; Electric nose
1. Introduction
[2]. The history of gas sensors can be traced to the last century. Miners are among the first groups that become aware of the importance of detecting hazardous gases in their working environment. In the early years, small animals, such as birds, were used as poor substitute for quantifiable method to measure this hazard [2]. To detect pollutant gases different kinds of gas sensor have been developed. In the past eighty years, scientists have developed various gas sensors such as electrochemical sensors, catalytic combustion sensors, infrared sensors, and diffusion fuel cell sensors [2]. These sensors have a broad range of application in chemical engineering, medical, agriculture, architecture and other fields. The first are electrolyte-based potentiometric sensors for automobile exhaust monitoring. Another important type of commercial sensor is the metal oxide semiconductor gas sensor, e.g. SnO2, which uses changes in
resistance of the metal oxide to detect the low concentration of gases [2].
In this thesis work, we have synthesized and characterized the ZnO nanostructured thin film on glass substrate by hydrothermal method and used for LPG gas sensor application. For this work, at first we have deposited ZnO thin film on glass substrates and synthesized ZnO nanostructured thin film for different growth time. Then this sample is characterized by using different instruments.
2. Experimental Set UP
Zinc acetate dehydrate was first dissolved in mixture of ethanol and di-ethanolamine (DEA) solution at room temperature. The molar ratio of DEA to Zinc acetate was maintained approximately 1.0 and the concentration of Zinc acetate was 0.6M. The solution was stirred at 600C for 2 hours to yield a clear and homogeneous solution which served as precursor. The precursor solution was filtered through Whatman filter paper [4].The prepared Zinc acetate precursor was dripped on to spin coated substrate. The spinning velocity of the substrate was more than 2000 rpm initially and then 3000 rpm for 30 seconds in order to spread the colloid on to the glass with uniform thin layer. The deposited film is heated at 4200C for 10 min. After that the same coating process is repeated for different 2 layers, 3 layers, 5 layers, and 8 layers to get uniform, transparent and conducting thin film of ZnO. For nanostructure growth solution, Zinc nitrate hexahydrate [Zn(NO3)2]. 6H2O, hexamethylene-tetramine (C6H12N4) (A.R. grade) and DI water were used as starting materials and solvent respectively. Zinc nitrate hexahydrate and hexamethylenetetramine was first dissolved in DI water at room temperature. The concentration of Zinc nitrate hexahydrate and hexamethylenetetramine was 0.3M. The solution was stirred at 600C for 2 hours to yield a clear and homogeneous solution which served as precursor. The precursor solution was filtered through Whatman filter paper [6]. For hydrothermal growth, the prepared ZnO solution was taken into an air tight glass bottle. Then the ZnO seeds layer deposited substrates was immersed in precursor solution, which solution was taken into air tight glass bottle. Then that glass bottle was immersed into a preheated water bath at 70
℃
for different time duration such as 2hrs, 4hrs, 6hrs, 8hrs, and up to10hrs. After cooling, the ZnO film were washed with de-ionized water several times, and then dried in air.The crystallinity of the ZnO films was determined by X- ray diffractometer. Optical transmittance was obtained using USB 2000 photonics spectrometer. The electrical properties were determined from sheet resistance measurement. Morphology and dimension of the ZnO nanostructures thin film was studied by scanning electron microscopy (SEM).The LPG sensing propertieswere studied in a home-made gas sensor assembly comprising a temperature controller, a chromel-alumel thermocouple, an electrical heating plate, a gas chamber, and a LPG volume measurement unit.3. Results and Discussion
Table.1: JCPDS d-values, observed d-values, intensity measured for (hkl) plane (I(hkl)), intensity of (hkl)
plane taken from the JCPDS card (I0(hkl)), and observed 2
value of ZnO seed layers.
Fig.1: Observed XRD pattern of ZnO seed layers and nanostructured thin film (Hydrothermal growth for 10 hours).
Table.2: FWHM value (
β)
, grain size (D), intensity measured for (hkl) plane (I(hkl)), intensity of (hkl)plane taken from the JCPDS card (I0(hkl)), dislocation density
(𝛿)
, d- values and texture coefficient(Tc(hkl)) of ZnO nanostructured thin film.
Texture coefficients of crystalline materials are calculated from the XRD result by using the relation [7],
𝑇
𝑐(ℎ𝑘𝑙)=
𝐼
(ℎ𝑘𝑙)𝐼
0(ℎ𝑘𝑙)⁄
1
𝑛
∑
𝐼
(ℎ𝑘𝑙)𝐼
0(ℎ𝑘𝑙)⁄
𝑛
Where Tc(hkl) is the texture coefficient of (hkl) plane, I(hkl) is the intensity measured for (hkl)plane, I0(hkl) is
pattern material, n is the number of diffraction peak. The calculated texture coefficient values of ZnO nanostructures thin film for different (hkl) planes are shown in Table 2.
Further investigations on the dimension of the nanostructures, grown by hydrothermal synthesis were investigated by scanning electron microscopy (SEM). Fig.2. shows SEM image of ZnO film synthesized by hydrothermal route for 2 hours and Fig. 3. shows the SEM image of ZnO film synthesized for 10 hours. From this figure we find that nano sheet like structures were formed in both cases. The average dimensions of the nanostructures were measured based on the image. From figure the average thickness of plate like nanostructures was about 10 nm, which is slightly lower than the result of Shao et al. [8] and Li et al. [9]. From this image the average length and width of nanostructures is observed to be about 550 nm and 220 nm, respectively, which is also slightly lower than the values observed by different research group [10].
From Fig.3.the average thickness of the plate like nanostructures was observed to be nearly same as the thickness at low growth time but length and width of nanostructures was nearly about 1050 nm and 525nm, respectively. Comparing the SEM image of ZnO for 2 hrs and for 10 hrs we find that with increase in growth time the dimension of area of nano sheet increased but thickness of the plate does not increase markedly. The reason for larger length in this case may be possibly due to longer growth time.
Fig.2: SEM images of (8 coating) ZnOnanosheet synthesized by hydrothermal route for 2hours at different resolution (a) 4µm (b) 1µm resolution.
Fig.3:SEM images of ZnOnanosheet synthesized by hydrothermal route for 10hours at different resolution (a) 20µm and (b) 4µm.
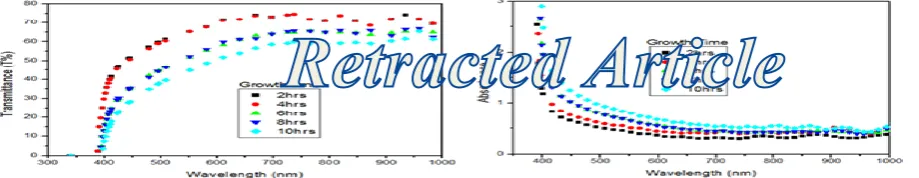
From the graph it is observed that transmittance starts to decrease rapidly at 400 nm wavelength. From this figure we find that the absorption edges shift to high wavelength with increase in growth time. Fig. 4(b). Depicts the absorption spectra of the films obtained in the wavelength range of 300 to 1000 nm. The absorbance edge have been found broad and pronounced around 800 nm for all deposited films. From the graph it is clearly seen that the absorbance decreases sharply at wavelength range about 550 nm to 650 nm and then decreases gradually up to about 800 nm. Beyond 800 nm, the absorbance is very low and nearly constant for all deposited ZnO nanostructured thin films. From the graph it is clearly seen that as growth time increases absorption edge shift to higher wavelength value.
Fig.4: Optical transmittance and absorbance spectra of ZnO nanostructured thin films fabricated at 70
℃
and different growth time.
Depending on a band structure of the material both direct and indirect transitions occur in a case of crystalline or polycrystalline material. As discussed earlier nature of optical transition and the optical band gap of these films are obtained using the relation (αhν) = A(hν-Eg)n where n=1\2, for direct allowed
transition, Egis the energy band gap, α is the absorption coefficient. Direct and indirect optical band gap
of these nanostructured thin films is obtained by extrapolating the linear portion of the plot on to hν-axis. The point where the linear part of (αhν)2versus hν curve intersects the hν axis gives us the band gap value for allowed direct transitions; on the other hand, the point where linear part of (αhν)1/2 versus hν curve
intersects the hν axis gives us the band gap value for allowed indirect transitions[5]. Fig.5. Depicts the variation of (αhν)2 versus photon energy (hν) film prepared at different growth time of ZnO
nanostructures thin film. From the figure we see that the allowed direct band gap decrease from 3.164 eV to 3.107 eV with the increase in growth time. These values are lower than that observed by the reasearch group [48] for the ZnO nanostructures thin film growth by hydrothermal process. Wang et al [48], also observed that the peak position of free excitonic emission redshifted from 3.3 to 3.2 eV with increasing of grain size from 21 to 64 nm. However many factors (enhanced strain, enlarged grain size and more oxygen vacancies between atom and molecule etc) influence the variation of the energy band gap. Since from XRD analysis and SEM analysis we have observed that with increase in growth time grain size of the ZnOnano sheet increases. Thus in our case decreases of energy band gap with increase of growth time may be due to larger size o f nanostructures.
Fig.5: (h)2 as a function of photon energy (h) for the ZnO nanostructured thin film prepared at 70℃ and different growth time.
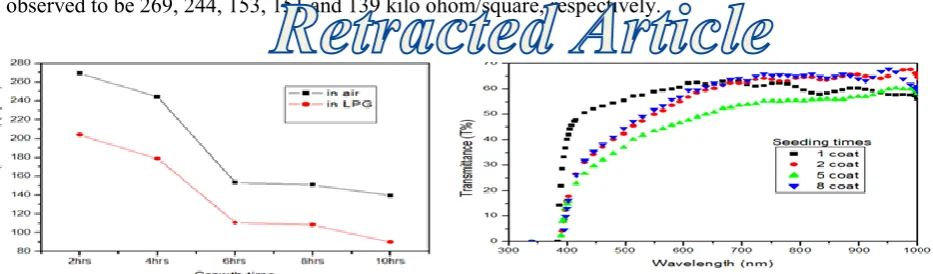
We have measured sheet resistance in air as well as in presence of LPG gas by using four-point probe methods at operating temperature of 300
℃
. Fig. 6. shows the variation of sheet resistance of ZnO nanostructured thin film versus growth time in air and LPG flow condition. The sheet resistance of the film is observed to decreases rapidly with growth time up to 6 hrs. Beyond this time the decreases is rather slow. Although many factors influence the variation of the sheet resistance. In our case decreases of sheet resistance with increase of growth time may be related to the grain size. We have observed that size of nanostructures was increased with increase in growth time. The increase in size of nanostructures led to deposition of more dense and compact film. Also this led to decrease in grain boundaries which result in decrease in sheet resistance. The sheet resistance of the film for 2, 4, 6, 8, and 10 hours is observed to be 269, 244, 153, 151 and 139 kilo ohom/square, respectively.Fig. 7: Sensitivity versus growth time of ZnO nanostructured thin film at temperature 300
℃
with equal volume of LPG gas.Fig. 8: Optical transmittance spectra of ZnO nanostructured films fabricated at 70
℃
for different seed layers.The sheet resistance is observed to decreases with increase in the growth time of ZnO nanostructured thin film in similar way as in absence of LPG gas. The sheet resistance for growth time of 2, 4, 6, 8, and 10 hours is observed to be 204, 179, 111, 108, and 90 kilo ohom/square respectively. The value of sheet resistance in LPG gas is observed to be less than the value of sheet resistance in air. When the LPG gas is introduced in the gas chamber, CH4, C3H8 and C4H10 molecules present in LPG react with pre-adsorbed
oxygen species. As a result the surface oxygen concentration is reduced, and electrons that were initially trapped by oxygen anions are released back in to the ZnO solid, leading to an increase in the conductivity of the ZnO surface. So that sheet resistance decreases in presence of LPG [3].
The Fig.7 reveals that the sensitivity increased from 24% to 35% as the growth time increased from 2 hrs to 10 hrs, for gas flow rate 16.66 ml/sec, with continuous flow of LPG gas. From our observation we conclude that better sensitivity was observed at 10 hours.
Fig. 8 shows the transmittance of the ZnO nanostructured thin film fabricated at 70
℃
for different seed layers. From Fig.4.10 we have calculated the average transmittance of the film, in the wavelength ranging from 300-1000 nm. The average transmittance was observed to be different for different coat. The average transmittance of the film for 1, 2, 5 and 8 coats of seed layer is observed to be nearly about 60%, 65%, 50% and 65% respectively. From the Fig. 8, it is clearly observed that in all case the average transmittance is observed to be less than 65% in the wavelength range 300-1000 nm, regardless the seeding layer. When the deposition condition like substrate temperature and other chemicals are kept fixed the value of transmittance changes according to change in the seeding time. From the graph it is observed that transmittance starts to decrease rapidly at lower range of wavelength.Fig. 9 depicts the variation of (αhν)2 versus photon energy (hν) film prepared at same growth time, but
have different seed layers of ZnO nanostructured thin film. From the figure we see that the allowed direct band gap decrease from 3.175 eV to 3.092 eV with the increase the seed layers.The band gap is observed to be 3.175 eV for one coated sample, but for 2, 5 and 8 coated sample have nearly about 3.092 eV. From the figure the band gap is observed to decreases slightly with increase in seed layers. Although many factors influence the variation of energy band gap, in our case the energy band gap decreased with increase of coating times of seed layers may be due to the increased in thickness of nanostructured film. For higher number of coating times of seed layers the thickness of the film may be increased, due to this band gab may be decreased.
Fig. 9: (h)2 as a function of photon energy
(h) for the ZnO nanostructured thin film at 70
℃
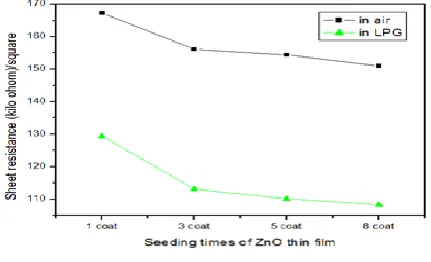
for different layers of coating.Fig.10: The sheet resistance of ZnO nanostructured thin film at different number of coats of seed layers in air and in LPG flow condition.
of coating increases. For small number of coating, the connection between grains may be loose and thus film appears to be porous. With the increased number of coating, the films become denser. So that sheet resistance decreased with increase in seeding times. This decreases value of sheet resistance with increased number of coating is applicable to observed high sensitivity.
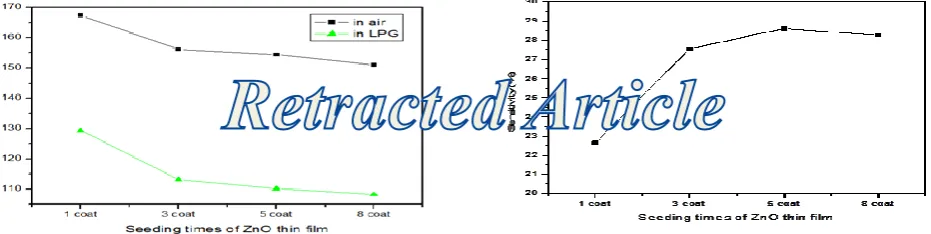
Fig.11: The sheet resistance of ZnO nanostructured thin film at different number of coats of seed layers in air and in LPG flow condition.
Fig. 12: Sensitivity versus different number of coating of ZnO thin film.
Fig. 11 shows the sensitivity versus number of coating of seed layer of ZnO thin film at temperature 300
℃
obtained by hydrothermal growth for 8hrs. From the figure we see that sensitivity of the film increases rapidly with increasing the number of coating of seed layer thin film up to 3 coats, beyond this the sensitivity increases in slow rate. This is because for small number of coating, the connection between grains is poor and thus the resistivity is high. The sensitivity of ZnO nanostructures thin film fabricated at temperature 70℃ for
1, 3, 5, and 8 coats (having same growth times) are found to be 22.63%, 27.54%, 28.61%, and 28.24%, respectively. The Fig.12 reveals that the response range of sensor is from 22.63% to 28.24% for the different coat of ZnOthin film at gas flow rate 16.66 ml/sec, with continuous flow of LPG gas. In our case sensitivity increased with seeding time may be due to larger surface area of nanostructures. For small number of coating, the connection between grains is loose and thus film appears to be porous. With the increased number of coating (up to three coats), number of grains increase thus increasing the surface area of film. So it is obvious that for the greater surface area, the interaction between the adsorbed gases and the sensor surface are stronger. So that sensitivity is increased with increasing number of coating of seed layers. On increasing the coatings further, the grains tend to overlap on others thus not contributing much in increasing the surface area. So we obtain a less steep curve for the 5 coated ZnO seed layer. The decrease in sensitivity for the 8 coated ZnO seed layer can be attributed to the same reason that the overlapping of more grains with increased number of coatings tend to decrease surface area significantly. From our observation we observed maximum sensitivity for 5 coated seed layers of ZnO.4. Conclusion
in air. The sensitivity of ZnO nanostructures was observed to be 24% to35% with increased in growth time and 22% to 28% with different seed layers. From our observation maximum sensitivity was observed at 10 hours growth time.
References
[1] G. M. Camila, S. Joop, L. Martina, S. Marayam, Electrostatic spray deposited zinc oxide film for a gas sensor applications, J. Applied surface science 253 (2007) 7483-7489.
[2] M. Liu, Synthesis of ZnO nanowires and application as gas sensors, Master’s diss., University of Saskatchewan, department of chemistry, 2010.
[3] C. D. lokhande, T. P. Gujar, V. R. Shinde, LPG sensing properties of ZnO films prepared by spray pyrolysis method : Effect of molarity of precusor solution,Sensors and Actuators 120(2007) 551-559.
[4] K. G. Yim, S. M. Jeon, M. S. Kim, S. Kim, G. Nam, D. Y. Lee, J.S. Kim, J. Y. Leem, Hydrothermal synthesis of ZnO nanorods, Applied Physics and Material Science 121(2011) 214-216.
[5] S. M. Sze and K. N. Kwok, Physics of Semiconductor Devices, 3rd edition, Wiley,2006.
[6] T. H. Meen, W. Water, Y. S. Chen, W. R. Chen, L. W. Ji, C. J. Huang, Growth of ZnO nanorods by hydrothermal method under different temperatures,IEEE, 1 (2007) 617-620.
[7] L. O. Lupan, S. Chow, E. Shishiyanu, T. Monaico, V. Shishiyanu, B. Sontea, A. Naitabdi, S. Park, A. Schulte, Matt. Resr.Bulletin 44, (2009) 63-69.
[8] S. Shao, P. Jia, S. Liu, and W. Bai, Stable field emission from roselike zinc oxide nanostructures synthesized through a hydrothermal route, Mater. Lett.62:8-9 (2008) 1200-1203
[9] F. Li, L. Hu, Z. Li, and X. Huang, Influence of temperature on the morphology and luminescene of ZnO micro and nanostructure prepared by CTAB-assisted hydrothermal method, J. Alloys Compd. 465:1-2 (2008) L14-L19.
[10] Z. Wang, X-F. Quin, J. Yim, and Z-K Zhu , Aqueous solution fabrication of large-scale arrayed obelisk-like zinc oxide nanorods with high efficiency J. Solid State Chem. 177:6 (2004) 2144.