Open Access
Research
Enzymatic corn wet milling: engineering process and cost model
Edna C Ramírez
1, David B Johnston*
1, Andrew J McAloon
1and Vijay Singh
2Address: 1United States Department of Agriculture, Agricultural Research Services, Eastern Regional Research Center, 600 East Mermaid Lane,
Wyndmoor, PA 19038, USA and 2Department of Agricultural Engineering, University of Illinois, 360H, AESB, 1304 W. Pennsylvania Ave, Urbana,
IL 61801, USA
Email: Edna C Ramírez - [email protected]; David B Johnston* - [email protected]; Andrew J McAloon - [email protected]; Vijay Singh - [email protected]
* Corresponding author
Abstract
Background: Enzymatic corn wet milling (E-milling) is a process derived from conventional wet milling for the recovery and purification of starch and co-products using proteases to eliminate the need for sulfites and decrease the steeping time. In 2006, the total starch production in USA by conventional wet milling equaled 23 billion kilograms, including modified starches and starches used for sweeteners and ethanol production [1]. Process engineering and cost models for an E-milling process have been developed for a processing plant with a capacity of 2.54 million kg of corn per day (100,000 bu/day). These models are based on the previously published models for a traditional wet milling plant with the same capacity. The E-milling process includes grain cleaning, pretreatment, enzymatic treatment, germ separation and recovery, fiber separation and recovery, gluten separation and recovery and starch separation. Information for the development of the conventional models was obtained from a variety of technical sources including commercial wet milling companies, industry experts and equipment suppliers. Additional information for the present models was obtained from our own experience with the development of the E-milling process and trials in the laboratory and at the pilot plant scale. The models were developed using process and cost simulation software (SuperPro Designer®) and include processing information
such as composition and flow rates of the various process streams, descriptions of the various unit operations and detailed breakdowns of the operating and capital cost of the facility.
Results: Based on the information from the model, we can estimate the cost of production per kilogram of starch using the input prices for corn, enzyme and other wet milling co-products. The work presented here describes the E-milling process and compares the process, the operation and costs with the conventional process.
Conclusion: The E-milling process was found to be cost competitive with the conventional process during periods of high corn feedstock costs since the enzymatic process enhances the yields of the products in a corn wet milling process. This model is available upon request from the authors for educational, research and non-commercial uses.
Published: 21 January 2009
Biotechnology for Biofuels 2009, 2:2 doi:10.1186/1754-6834-2-2
Received: 8 September 2008 Accepted: 21 January 2009
This article is available from: http://www.biotechnologyforbiofuels.com/content/2/1/2
© 2009 Ramírez et al; licensee BioMed Central Ltd.
Background
The conventional process for wet milling of corn involves chemically pretreating the corn in a solution of sulfurous acid (SO2 in water) followed by physical separation of the co-products and starch. This process is very energy and time consuming. Furthermore, it negatively affects the environment due to the high sulfur dioxide requirements during steeping. According to the Environmental Protec-tion Agency, sulfur dioxide is one of the six most common air pollutants in the United States of America [2]. Sulfur dioxide released to the atmosphere is associated with seri-ous respiratory illnesses. At high levels, it particularly affects people with asthma [3]. Also, oxidation of SO2 in the presence of other polluting gases in the atmosphere,
such as nitrogen dioxide (NO2), forms sulfuric acid and
causes the formation of acid rain.
Enzymatic wet milling (E-milling) was developed and proposed as an environmentally friendly alternative for conventional corn wet milling [4]. We reported the opti-mization of conditions for E-milling [5,6] and showed two important advantages to the use of enzymes in a mod-ified two-stage procedure for wet milling; SO2 is reduced to levels sufficient to inhibit microbial activity and the time for soaking the corn kernel (steeping) is reduced six fold, from 36 to 6 hours.
The process was developed and tested in the laboratory using a batch process; however, a number of important questions were generated that could not be answered without being tested in a continuous system that included recycling streams. A continuous system with recycle streams cannot be tested on laboratory scale and commer-cial plant testing is required. Commercommer-cial plants are reluc-tant to evaluate the technology without knowing overall cost benefits of the process. There was a need to investi-gate the amount and cost of energy savings as a result of reducing steeping time to the much shorter pretreatment time. Furthermore, we needed to know if the cost of the enzyme for the pretreatment was going to make the proc-ess uneconomical or if perhaps the savings in energy could balance the cost of the enzyme. Finally, there was the proposed prediction that the recycle of the streams in the continuous process would lower the overall enzyme requirement. All of these questions were answered posi-tively with the help of the process engineering and cost models.
Methods
Process model description
The process model was developed using process simulator
software (SuperPro Designer®) in order to evaluate the
continuous production of starch and co-products using E-milling. The model includes processing information such as composition and flow rates of the various process
streams, descriptions of the various unit operations, mass and energy balances of each unit operation as well as detailed breakdowns of the operating and capital cost of the facility.
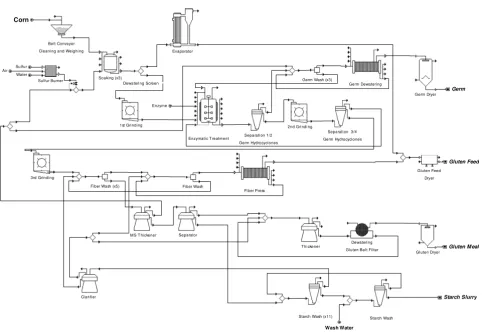
Our E-milling model is based on the conventional wet milling model published previously [7] as well as experi-mental results from the USDA/ARS – Eastern Regional Research Center. The process and model has a capacity of 2.54 million kg of corn per day (100,000 bushels/day) and includes seven main sections: grain handling, pre-treatment, enzymatic pre-treatment, germ separation and recovery, fiber separation and recovery, gluten separation and recovery and starch washing and recovery (Figure 1 and Additional file 1). The unit operations in the model are identified by a number ID based on each one of the seven sections (100's for grain handling, 200's for soak-ing, and so on) and the type of operation (one or two let-ters to identify equipment). Depending upon the final end product (modified starch, glucose, high fructose corn syrup, ethanol or other fermentation products), down-stream differences (after milling) exist in unit operations among wet milling plants. In order for this model to be comparable with most wet milling facilities, it was designed using the universal unit operations found in wet milling plants, up to starch recovery and washing. Accord-ing to individual user requirements, additional down-stream processes could be added if there is a need to model more specific products. Table 1 shows selected unit operations and settings in the process model. Specifics of the process for the conventional wet milling model have been described previously [7]. In the present work, the seven sections of the model are briefly described but only differences between the conventional wet milling and the E-milling process are noted. Table 2 shows the overall material balance for the process. Product yields for the conventional and E-milling models are shown in Table 3. In the E-milling model presented here, we used fairly con-servative values for starch yield improvements over the conventional base case model. In the laboratory we have consistently measured more significant increases in starch recovery.
Cost model description
The cost model for the E-milling process was developed using the cost analysis capabilities of the software
(Super-Pro Designer®). The model includes economic
and relevant publications. Inputs from technology suppli-ers were incorporated into this E-milling study where required. Supplier inputs were obtained from all the major equipment items from suppliers once the process flow diagrams were developed and equipment sizing could be determined. The assembling and analysis of this data was done using the cost estimating program in Super-pro Designer®, using generally accepted methods for con-ducting conceptual economic evaluations for industrial processes [8]. Cost levels in both models were adjusted to reflect economic conditions in the first half of 2007.
Results and discussion
Process model
Grain handling
The corn is received, weighed, cleaned and stored in silos. The silo in our model is sized to hold enough corn for three days of operation.
Pretreatment
The steeping step of the conventional process is substi-tuted for a short soaking pretreatment during the E-mill-ing process, long enough to increase the moisture content to 50% in the corn kernel prior to grinding. This pretreat-ment is very important to preserve the integrity of the germ during grinding. In our model, the corn is soaked in a group of three stainless-steel tanks and held in the soak-ing solution for a total of 6 h at 55°C. The SO2 concentra-tion is 600 ppm for the soaking soluconcentra-tion compared with 2000 ppm for the conventional steeping solution. The SO2 is used mainly for microbial control in the E-milling process, not as a chemical processing agent. The reduction on sulfur consumption annually is equal to 461,926 kg for a processing plant with a capacity of 2.54 million kg of corn per day. The soaking is done in a semi-continuous countercurrent system, in the same way the steeping is done in conventional wet milling. During the soaking process, about 46% of the soluble solids are removed and carried in the soak water. The soak water is concentrated, Simplified flow diagram of the corn E-milling process
Figure 1
Simplified flow diagram of the corn E-milling process. The original model is available upon request from the authors. The model requires the use of SuperPro Designer®, Version 7.0, build 17 or later. A free copy of this program can be used to
view the model and may be downloaded from the Intelligen website http://www.intelligen.com.
Belt Conveyer
Cleaning and Weighing Evaporator Sulfur Burner
Dewatering Screen
Corn
Sulfur Air
Water
1st Grinding
Separation 1/2 Germ Hydrocyclones
2nd Grinding
Separation 3/4 Germ Hydrocyclones Germ Wash (x3)
Germ Dewatering
Germ Dryer
Germ
3rd Grinding
Starch Wash
Starch Slurry
Starch Wash (x11) Clarifier
Fiber Wash (x5) Fiber Wash
Fiber Press
Gluten Feed Dryer
Gluten Feed
M S T hickener Separator
Thickener
Dewatering Gluten Belt Filter
Gluten Dryer
Gluten M eal
Wash Water
Soaking (x3)
mixed with the corn fiber later in the process and dried to produce corn gluten feed. After soaking, the hydrated corn is submitted to a coarse grinding (first degermination) prior to the enzymatic treatment to allow better penetra-tion of the enzyme.
Enzymatic treatment
The ground corn along with the overflows of hydrocy-clones used for germ separation (except from the A cyclone of primary germ separation unit) is incubated in
a reactor tank with a commercial protease (Prosteep™) for 3 h at a controlled temperature of 50°C and pH of 4.5. The amount of enzyme needed for the treatment is based on experimental data and was calculated as 1 mL/kg of corn in the tank (1117–1210 SAPU/kg of corn). The activ-ity of the protease is expressed in Spectophotometric Acid Protease Units (SAPU). One SAPU is the amount of enzyme that liberates one micromole of tyrosine per minute from the casein substrate under the conditions of the assay. Considering the solid content of the 'fresh' corn and the amount of solids being treated (as part of the recy-cle), the concentration of enzyme in the treatment tank is set to 1.392 g of enzyme/kg of solid material. The process model shows a consumption of 12.12 kg of protease/h or 0.117 g of protease/kg of fresh corn.
During this step, the protease hydrolyzes the protein matrix (gluten) that surrounds the starch granules. The enzymatic treatment disrupts starch-gluten interactions so that the starch and gluten can be separated. The proteoly-sis must not be so extensive as to completely degrade the gluten matrix (preventing gluten recovery), which is why not all proteases found to allow starch recovery are accept-able for this process. The proteolysis treatment and the conventional process using sulfites both allow the starch to be isolated by disrupting the starch-gluten interactions; however, the specific chemical mechanism of the two pre-treatments is not identical and there can be some additive benefits of using them together [6].
Germ separation and washing
The enzyme-treated corn continues in the process in order to separate the oil-rich corn germ from the starchy slurry using four sets of hydrocyclones. The separation is based on the lower density of the germ, compared with the den-sity of the slurry. The overflows of all hydrocyclones, with the exception of the first set, are recycled to the enzymatic treatment tank to optimize the purity of the germ recov-ered. The pure germ is washed, dewatered and dried as in the conventional process. The underflow of the last set of hydrocyclones (separation 4) continues the co-product separation process. The dry germ is produced in our model at a rate of 7211 kg/h and it contains a higher pro-tein but lower lipid content than the conventional process (Table 4). The difference in composition is due to the increase of soluble solids in the stream with the conven-tional process.
Fiber separation and recovery
This stage of the process remains as the conventional treat-ment where the degermed corn slurry is passed over the grit screen to separate water, loose starch and gluten (together known as mill starch) from the fiber and bound starch and gluten. The mill starch is sent further in the process, for the separation of gluten and starch. The
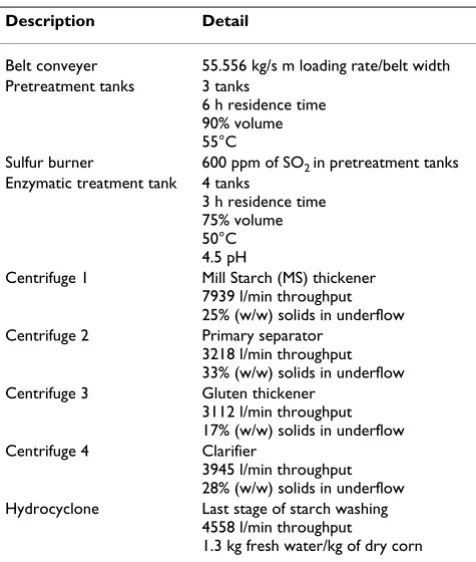
Table 1: Overview of selected E-milling process equipment
Description Detail
Belt conveyer 55.556 kg/s m loading rate/belt width Pretreatment tanks 3 tanks
6 h residence time 90% volume 55°C
Sulfur burner 600 ppm of SO2 in pretreatment tanks Enzymatic treatment tank 4 tanks
3 h residence time 75% volume 50°C 4.5 pH
Centrifuge 1 Mill Starch (MS) thickener 7939 l/min throughput 25% (w/w) solids in underflow Centrifuge 2 Primary separator
3218 l/min throughput 33% (w/w) solids in underflow Centrifuge 3 Gluten thickener
3112 l/min throughput 17% (w/w) solids in underflow Centrifuge 4 Clarifier
3945 l/min throughput 28% (w/w) solids in underflow Hydrocyclone Last stage of starch washing
4558 l/min throughput
1.3 kg fresh water/kg of dry corn
Table 2: Overall material balance for E-milling model
MATERIALS IN (kg/h) OUT (kg/h)
Corn (15% water) 106,000
Air 123,303 123,289
Sulfur 14
Water 134,624 62,182
Enzyme 12
Sulfuric acid 49
Sulfurous Acid 37
Debris 2,539
Dry germ (3% water) 7,211
Gluten feed (10% water) 18,074 Gluten meal (10% water) 6,285 Starch slurry (60% water) 144,385
remaining solids are finely ground to complete the disper-sion of the starch and the ground slurry is washed and sep-arated in countercurrent fashion over a set of screens. The clean fiber is dewatered by a screen and a screw press to a final moisture of 60%. This fiber is combined with the concentrated soak water, dried to 10% moisture and sold as corn gluten feed. The corn gluten feed flow is 18,074 kg/h and has approximately the same protein content compared with traditional wet milling (Table 4).
Gluten separation and recovery
As in the conventional process, the gluten is separated from the starch by density differences in a series of three centrifuges where the underflow of the middle one, known as the primary separator, is sent to the starch wash-ing process. The last centrifuge (gluten thickener), along with a rotary vacuum belt filter and a ring dryer, concen-trates the gluten to a final moisture of 10%. The gluten is sold as corn gluten meal. The final corn gluten meal (6,285 kg/h in our model) has approximately the same protein content on a dry weight basis as the conventional process (Table 4).
Starch washing and recovery
The washing and recovery of the starch is done in 12 stages in a countercurrent fashion, as it is done in the con-ventional wet-milling process. This is the only part of the process where fresh water is used to wash the product. The water usage is essentially the same for E-milling and con-ventional processes (2.3 kg water/kg starch produced). The final starch slurry (144,385 kg/h) contains 60% mois-ture content with less than 1% of impurities.
Cost model
Equipment and capital costs
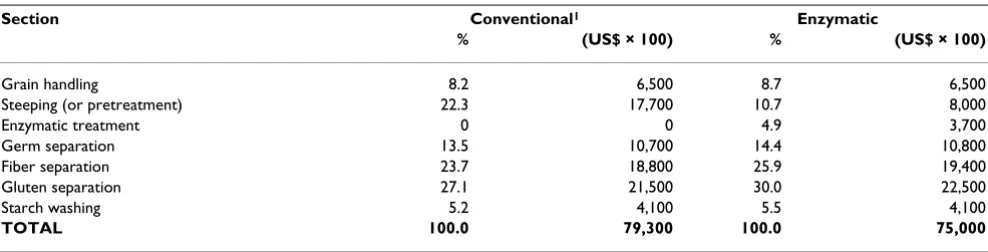
The estimated capital cost for the construction of a wet milling plant area processing 100,000 bushels of corn per day is estimated to be approximately $79,300,000 while the capital cost of constructing an E-milling processing area of the same capacity is estimated to be $74,900,000. These differences in capital costs are attributable to the following reasons; the use of enzymes reduces the amount of sulfur required for steeping as well as the length of soaking time. These differences result in a capital cost reduction in the soaking area of approximately $9,670,000 which is partially offset by the requirements for the pretreatment tanks now required at a cost of $3,670,000. Table 5 shows the capital costs by section of the process.
Furthermore, the use of enzymes in the process has the effect of keeping more of the soluble solids with the glu-ten, fiber and germ and less with the corn soak liquor. The higher soluble loading translates into more material being processed in the gluten, fiber and germ areas and conse-quently larger equipment capacities and costs. Overall, the combination of the above factors results in a lower capital cost for the E-milling facility of about $4,400,000 or about a 5.5% reduction in costs over a conventional wet milling line.
Operating costs
The operating costs for an E-milling facility are similar to the operating costs for a conventional wet milling facility. We have estimated that the cost of producing a clean starch slurry for further processing by both the wet milling
Table 3: Corn wet milling product yields (conventional and enzymatic) derived from the process models
Product Conventional yield (%)1 Enzymatic yield (%)1
Dry germ 7.7 8.0
Gluten feed (Soak water solids plus fiber) 19.4 18.5
Gluten meal 6.2 6.4
Starch 66.7 67.1
1Calculated on a dry weight basis after waste materials (broken corn and foreign matter) are removed.
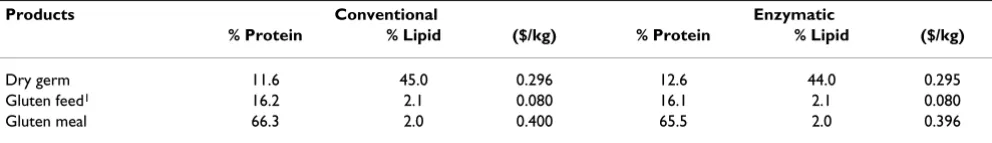
Table 4: Protein content, lipid content and unit price of the co-products derived from the wet-milling process models (conventional and enzymatic)
Products Conventional Enzymatic
% Protein % Lipid ($/kg) % Protein % Lipid ($/kg)
Dry germ 11.6 45.0 0.296 12.6 44.0 0.295
Gluten feed1 16.2 2.1 0.080 16.1 2.1 0.080
Gluten meal 66.3 2.0 0.400 65.5 2.0 0.396
Compositions are on a dry weight basis.
process and the E-milling process would be about $0.193 per kilogram.
The reductions in the capital cost of an E-milling facility are described above. When these savings are spread over a 10-year period the operating cost is reduced by approxi-mately $440,000 per year. Reductions in insurances, taxes and maintenance fees, which are all related to the esti-mated capital cost savings, provide a reduction in costs of approximately $190,000 per year.
The throughput to the evaporator is limited to a concen-tration of 50% solids in the syrup leaving the evaporator. Since the concentration of solids in the steep water to the evaporator is lower in the E-milling case, a higher volume of water can be removed in the evaporator at a lower cost than would be achieved in a dryer which results in an additional cost saving of about $40,000 per year.
The lower concentration of sulfur needed results in cost savings of $15,000 per year while the inclusion of the enzymes required for the process adds $1,440,000 per year to the operating costs. The need for sulfuric acid in the enzymatic process for pH adjustment adds $49,000 per year to the operation costs.
Product values
The starch co-products produced in a wet milling facility include two protein-based animal feeds (corn gluten meal and corn gluten feed) that are valued for their protein con-tent and a third co-product, corn germ, whose price is a function of its protein content and its lipid content [9]. Table 4 shows the protein and lipid content on a dry weight basis in the co-products for both processes. In E-milling, the protein content slightly decreases for corn gluten meal and corn gluten feed and increases for corn germ. The lipid content in the germ decreases by 1%. The difference in composition of the co-products creates a dif-ference in the unit price for co-products. The unit prices
were calculated using the method describe by Johnston et al [9].
The relative quantities of the co-products also vary from a conventional wet milling facility to an E-milling facility. The result is that the net value of the co-products is 0.3% greater for an E-milling facility than a conventional wet milling plant.
Annual and unit production costs
Corn starch, as a water slurry, is the principal product of the wet milling and the E-milling processes. A comparison of the economics of these processes is then achieved by comparing the unit cost of producing the starch in each case.
Unit production costs are calculated by prorating the total annual starch production costs over the annual produc-tion volume. Annual producproduc-tion costs for the producproduc-tion of starch slurry are calculated by adding together all the annual operating costs to produce the starch slurry and its co-products and then reducing this number by the income received from the value of the co-products of the starch production. The annual production costs include a depre-ciation allowance of 10% of the capital cost which is based on a 10-year effective operating life for the facility with no salvage value at the end of its life, and the operat-ing costs described in Table 6.
Cost comparison with conventional wet milling
The E-milling process can be economically competitive with the conventional wet milling process and our models have indicated a slight, but not significant, cost advantage to the E-milling process over the conventional wet milling process under the economic conditions that existed in the first half of 2007.
Using the model, historic values and future estimates for corn prices ($0.09 to $0.32/kg or $2 to $8/bushel) and the estimated range of enzyme cost ($5 to $20/kg), the unit
Table 5: Capital costs by section
Section Conventional1 Enzymatic
% (US$ × 100) % (US$ × 100)
Grain handling 8.2 6,500 8.7 6,500
Steeping (or pretreatment) 22.3 17,700 10.7 8,000
Enzymatic treatment 0 0 4.9 3,700
Germ separation 13.5 10,700 14.4 10,800
Fiber separation 23.7 18,800 25.9 19,400
Gluten separation 27.1 21,500 30.0 22,500
Starch washing 5.2 4,100 5.5 4,100
TOTAL 100.0 79,300 100.0 75,000
production cost of starch for the E-milling and the con-ventional processes was calculated and the differences compared. The differences (E-milling unit production cost minus conventional unit production cost) are sum-marized in Figure 2 and clearly show that under certain corn and enzyme prices the E-milling process can be either more or less economical relative to the conven-tional process. Under the current enzyme price ($15/kg) and corn cost ($0.132/kg or $3.36/bushel), there is only a slight economic advantage of the E-milling process; how-ever, as the cost of corn increases and/or the price of enzyme decreases, the economic advantage of the E-mill-ing process quickly becomes significant over the current conventional process.
Conclusion
A Technical Cost Model was developed for an enzymatic corn wet milling processing plant with a capacity to proc-ess 2.54 million kg of corn per day. This model was used as a tool to understand the differences between the E-mill-ing and conventional wet millE-mill-ing processes, and the cost issues associated with it. We used the model to conduct sensitivity studies using modifications in the price of corn and enzyme. The model allows the user to predict the impact of those modifications in the operating, annual and unit production costs. Our comparison shows that due to the significant recycle of enzyme within the process
(quantified using the process model), a significant reduc-tion in the quantity of enzyme necessary over a batch process is possible even if some unaccounted activity losses due to adsorption or inactivation were to occur. It was also found that under current corn and enzyme costs, the E-milling process is slightly more economic on a unit starch production cost; however, it was also shown that under high corn and/or reduced enzyme costs the process can be significantly more economical than the conven-tional process.
Additionally, the reduction in sulfur consumption was found to be 461,926 kg/year for the model size of 2.54 million kg/year (100,000 bu/day). If adapted industry wide within the United States of America, this would translate into a reduction of 12.6 million kg of sulfur per year.
This model is available upon request from the authors for educational uses and non-commercial research to study the enzymatic wet milling process and to show the impact of changes in the costs of starch, enzyme and co-products. It is not intended to replace a customized process design package. The model requires the use of SuperPro Designer®, Version 7.0, build 17 or later. A free copy of this program can be used to view the model and may be
down-Table 6: Annual operating and production costs
Conventional Enzymatic
Material flow Annual cost Material flow Annual cost Metric ton/year (US$x1000)/year Metric ton/year (US$x1000)/year
Operating costs
Raw materials
Corn – kg 839,520 111,018 839,520 111,018
Enzyme 1,440
Other raw materials 396 418
Depreciation 7,933 7,494
Facility related costs 3,467 3,275
Utilities 12,550 12,508
Operations labor 1,980 1,980
Total operating costs 137,344 138,134
Co-product credits
Corn gluten meal 48,090 19,255 49,788 19,696
Corn gluten feed 150,439 12,071 143,216 11,414
Corn germ 55,684 16,482 57,117 16,855
Total co-product credits 47,808 47,965
Annual starch production1 463,150 89,536 466,632 90,169
Unit starch production cost ($/kg) $0.19332 $0.19323
loaded form the Intelligen website http://www.intelli gen.com.
Competing interests
The authors declare that they have no competing interests.
Authors' contributions
ECR developed the E-milling processing model, evaluated the results and drafted the manuscript. DBJ and VS devel-oped the E-milling process and conducted laboratory, pilot plant and commercial plant trials to obtain the proc-ess data necproc-essary for the model. AJM obtained the mate-rial and equipment cost data and conducted the economical analysis of the model. All authors suggested modifications to the draft, commented on several prelim-inary versions of the text and approved the final manu-script.
Additional material
Acknowledgements
We thank Kevin Hicks for reviewing the process model and manuscript. Mention of trade names or commercial products in this publication is solely for the purpose of providing specific information and does not constitute an endorsement by the U.S. Department of Agriculture.
References
1. Corn Refiners Association Inc: Corn Annual. Washington DC 2007.
Additional file 1
Enzymatic milling. Detailed flow diagram of the SuperPro Designer® process model.
Click here for file
[http://www.biomedcentral.com/content/supplementary/1754-6834-2-2-S1.pdf]
Impact of corn and enzyme price on starch unit production cost
Figure 2
Publish with BioMed Central and every scientist can read your work free of charge
"BioMed Central will be the most significant development for disseminating the results of biomedical researc h in our lifetime."
Sir Paul Nurse, Cancer Research UK
Your research papers will be:
available free of charge to the entire biomedical community
peer reviewed and published immediately upon acceptance
cited in PubMed and archived on PubMed Central
yours — you keep the copyright
Submit your manuscript here:
http://www.biomedcentral.com/info/publishing_adv.asp
BioMedcentral 2. United States Environmental Protection Agency: SO2. How Sulfur
Diox-ide Affects the Way We Live and Breathe Office of Air Quality Planning and Standards; 2000.
3. Boushey H: Asthma, sulfur dioxide and the Clean Air Act.
West J Med 1982, 136:129-135.
4. Johnston DB, Singh V: Use of proteases to reduce steep time and so2 requirements in a corn wet-milling process. Cereal
Chem 2001, 78:405-411.
5. Johnston DB, Singh V: Enzymatic milling of corn: optimization of soaking, grinding, and enzyme incubation steps. Cereal Chem 2004, 81(5):626-632.
6. Johnston DB, Singh V: Enzymatic milling product yield compar-ison with reduced levels of bromelain and varying levels of sulfur dioxide. Cereal Chem 2005, 82:523-527.
7. Ramírez EC, Johnston DB, McAloon AJ, Yee W, Singh V: Engineer-ing process and cost model for a conventional wet millEngineer-ing facility. Ind Crops Prod 2008, 27:91-97.
8. Association for the Advancement of Cost Engineering International:
Conducting Technical and Economic Evaluations in the Process and Utility Industries. In AACE Recommended Practices and Standards Morgantown, WV: AACE Inc; 1990.
9. Johnston DB, McAloon AJ, Moreau RA, Hicks KB, Singh V: Compo-sition and economic comparison of germ fractions from modified corn processing technologies. JAOCS 2005,