689
Copyright © 2011-15. Vandana Publications. All Rights Reserved.
Volume-5, Issue-2, April-2015
International Journal of Engineering and Management Research
Page Number: 689-693
A Study on Organizational Policies Intervening Work Life Balance of
Women Employees in IT Industry
A. Narmadha1, Dr. R Sellappan2 1
Research Scholar, Bharathiyar University, INDIA 2
Principal, Gobi Arts & Science College, Karattaidipalayam, Gobichettipalayam, INDIA
ABSTRACT
Quality of work life is the degree to which members of an organization are able to satisfy their personal needs through their experience in the organization. Its focus is on the problem of creating a human work environment where employees work co-operatively and contributes to organizational objectives. Quality of work life is a subset of the quality of life which contains the relationship between employees and their total working environment with human dimension. Quality of work life is important for job performance, job satisfaction, lab our turnover, lab our management relations and such other factors which play an important part in determining the overall well being of any industrial organization. The study focused on how the organizational policies intervening QWL working women in IT industry.
Keywords--- IT industry, women employees, Quality of work life, factors
I.
INTRODUCTION
Quality of work life is a philosophy or set of principals which holds that people are trustworthy, responsible and capable of making valuable contribution to the organization. However, quality of work life is directly influenced by job satisfaction and external environment and personal life. There should have be a proper level of balance in work life and total life space. In my research, I have identified some major factors that Quality of work life (QWL) is not a single theory or a technique. It refers to the level of satisfaction, motivation, involvement and commitment individuals experience with respect to their lives at work. Companies interested in enhancing employees Quality of Work Life generally try to instill in employees the feelings of security, equity, pride, internal democracy, ownership, autonomy, responsibility and
flexibility. The factors affecting quality of work life experience are work load, working condition and career growth, compensation and benefits, working environment which are directly influence the job satisfaction.
II.
MEANING AND DEFINITION
OF QUALITY OF WORK LIFE
BALANCE
The present era is an era of knowledge workers and the society in which we are living has come , to be known as knowledge society. The intellectual pursuits have taken precedence over the physical efforts. The traditional management ( like scientific management ) gave inadequate attention to human values. In the present scenario, needs and aspirations of the employees are changing. Employers are now redesigning jobs for better QWL. "QWL is a way of thinking about people, work and organizations, its distinctive elements are (i) a concern about the impact of work on people as well as on organizational effectiveness, and (ii) the idea of participation in organizational problem- solving and decision making". -Nadler and Lawler. " QWL is based on a general approach and an organization approach. The general approach includes all those factors affecting the physical, social, economic, psychological and cultural well being of workers, while the organizational approach refers to the redesign and operation of organizations in accordance with the value of democratic society".— Beinum.
The factors that influence and decide the Quality of work life are:
1. Working hours for each day. 2. Flexibility of work schedule. 3. Location of work.
690
Copyright © 2011-15. Vandana Publications. All Rights Reserved.
6. Top management support 7. Personal growth opportunities. 8. Employees control.
9. General happiness 10. Job sharing.
11. Overtime pay given by the organization. 12. Relationship with my co-worker.
13. Opportunity for independence associated with my work roles.
14. Transfer facilities given by the organization. 15. Recognition for work accomplished.
III.
LITERATURE REVIEW
According to Lakhawat P.S, Viswakarma.P, Varma
.N (2011)” The salary was not in consummate with their
work load . This result in job dissatisfaction. Some other factors like leave flexibility, timing flexibility relationship with peers, conflicts with senior affect the QWL of an employee.
Smita R.Chavan(2011) The study shows that majority of the employees have complaints like head ache & digestive disorders, some of them have restless sleep and lack of consideration, lack of apatite and cardiovascular disorders. These problems were found to be in maximum in the age group 22-25 yrs. It is suggested that periodic health risk assessment for employees conducted. Counseling should be given to maintain a good physical & mental rhythm.
Babatundb Akanji (2012) says that the role overload was a main source of WLB for Nigerian women. Women are subjected to serious work stress as well as family imbalances. Some employees tend to think that WLB is the personal problem of the employees. (They have been trained to endure hard ships). Most of the married women in these sectors banking tele- communications & insurance outsource their child care responsibilities to parents and relatives.
Chandranshu Sinha(2012) The study indicated three factors of QWL working experiences in organizations, namely relationship sustenance orientation, futuristic and professional orientation & self deterministic & systematic orientation. The factors have a major role to play in satisfying the needs of the employees.
Freyedon Ahmadi, Adel salavati, Ebrahim Raja bzadeh (2012) The article reveals that participation leads to involvement in the work place, and so they are more committed. Pay and benefits have a significant positive relationship with commitments. Social integration has also
a significant relationship with commitments. Supervision also has a positive relationship with commitments. All these four factors help improve the sense of commitments.
IV.
OBJECTIVE OF THE STUDY
• To assess the interventions of organizational
policies on work life balance.
• To offer suggestions to overcome
impediments regarding organizational policies in achieving work life balance.
V.
RESEARCH METHODOLOGY
The primary research through a survey of 50 respondents was conducted to collect response from IT women employees of chennai. The relevant information was collected though personal interview, on structured questionnaire from selected IT women employees. Random sampling method was applied for collecting primary data from sampling units, which encounters with important factors directly related to work life balance.
VI.
QUESTIONNAIRE SCALING
TECHNIQUES
The questionnaire is used comprises both optional type and statements in likerts 5 point scale. The responses are obtained in the 5 point scale , which ranges as follows 5- strongly disagree, 4-disagree,3 neither agree nor disagree, 2- agree,1- strongly agree.
VII.
DATA COLLECTION
The primary data is obtained from IT women employees in Chennai city . The researcher adopted convenient random sampling method to collect respondents from women employees. The researcher collected 120 samples from different employees working in IT companies.
VIII.
DATA ANALYSIS
The collected 120 responses are systematically tabulated and analyzed using SPSS. The researcher mainly applied factor analysis by using percentage and correlation analysis to describe the sample unit.
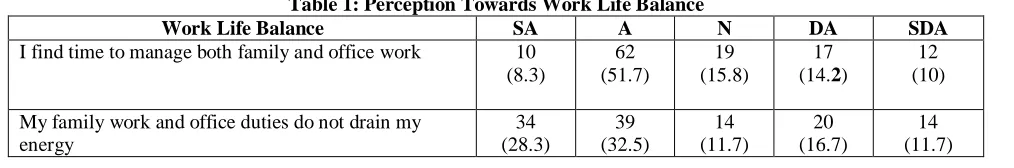
Table 1: Perception Towards Work Life Balance
Work Life Balance SA A N DA SDA
I find time to manage both family and office work 10
(8.3)
62 (51.7)
19 (15.8)
17 (14.2)
12 (10)
My family work and office duties do not drain my energy
34 (28.3)
39 (32.5)
14 (11.7)
20 (16.7)
691
Copyright © 2011-15. Vandana Publications. All Rights Reserved.
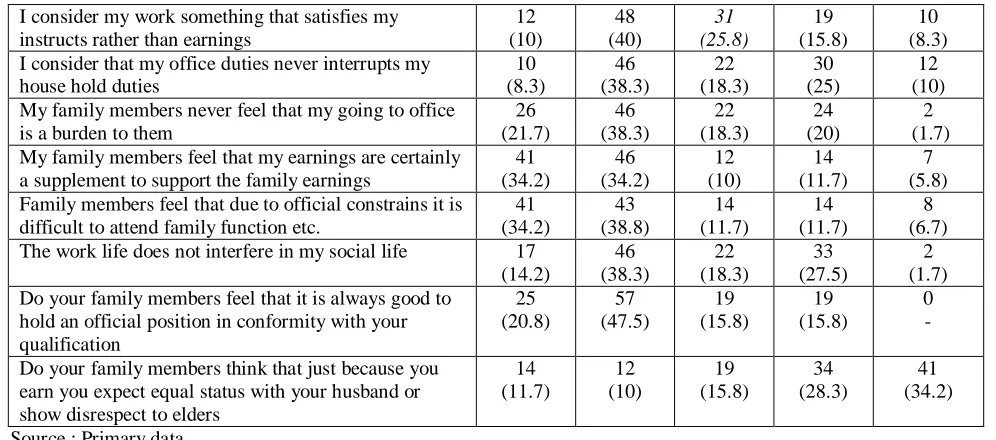
I consider my work something that satisfies my instructs rather than earnings
12 (10) 48 (40) 31 (25.8) 19 (15.8) 10 (8.3) I consider that my office duties never interrupts my
house hold duties
10 (8.3) 46 (38.3) 22 (18.3) 30 (25) 12 (10) My family members never feel that my going to office
is a burden to them
26 (21.7) 46 (38.3) 22 (18.3) 24 (20) 2 (1.7) My family members feel that my earnings are certainly
a supplement to support the family earnings
41 (34.2) 46 (34.2) 12 (10) 14 (11.7) 7 (5.8) Family members feel that due to official constrains it is
difficult to attend family function etc.
41 (34.2) 43 (38.8) 14 (11.7) 14 (11.7) 8 (6.7)
The work life does not interfere in my social life 17
(14.2) 46 (38.3) 22 (18.3) 33 (27.5) 2 (1.7) Do your family members feel that it is always good to
hold an official position in conformity with your qualification 25 (20.8) 57 (47.5) 19 (15.8) 19 (15.8) 0 -
Do your family members think that just because you earn you expect equal status with your husband or show disrespect to elders
14 (11.7) 12 (10) 19 (15.8) 34 (28.3) 41 (34.2)
Source : Primary data
Note : ( Value shows within the bracket represent percentage)
It is observed from the above table that the respondents have expressed as Strongly Disagree towards the statement,' Do your family members think that just because you earn you expect equal status with your husband or show disrespect to elders' as 34.2%. It is followed by the respondents who disagree towards the
statement like 'My family work and office duties do not drain my energy, The work life does not interfere in my social life' 1.7% respectively. It is concluded from the analysis that 51.7% of the respondents agree towards the statement related to work life balance as 'I find time to manage both family and office work'.
Table 2: Perception Towards Organizational Policies Intervention
Factors SA A N DA SDA
Working hours for each day. 31
(25.8) 58 (48.3) 5 (4.2) 19 (15.8) 7 (5.8)
Flexibility of work schedule. 31
(25.8) 48 (40) 17 (14.2) 22 (18.3) 2 (1.7)
Location of work. 38
(31.7) 53 (44.2) 14 (11.7) 12 (10) 3 (2.5)
Amount paid for vacation time / Sick leave offered 26
(21.7) 55 (45.8) 24 (20) 7 (5.8) 8 (6.7)
Salary paid by the organization 26
(21.7) 67 (55.8) 17 (14.2) 10 (8.3) 0 -
Overtime pay given by the organization 31
(25.8) 41 (34.2) 19 (15.8) 17 (14.2) 12 (10)
Relationship with my co-worker. 34
(28.3) 62 (51.7) 17 (14.2) 5 (4.2) 2 (1.7)
Opportunity for independence associated with my work roles. 41
(34.2) 45 (37.5) 22 (18.3) 7 (5.8) 5 (4.2)
Transfer facilities given by the organization. 22
(18.3) 53 (44.2) 21 (17.5) 21 (17.5) 3 (2.5)
Recognition for work accomplished. 31
(25.8) 53 (44.2) 22 (18.3) 12 (10) 2 (1.7)
Source : Primary data
692
Copyright © 2011-15. Vandana Publications. All Rights Reserved.
It is observed from the above table that the respondents opined as "Agree" towards the determinants like Salary paid by the organization, relationship with my co-worker, amount paid for vacation time / Sick leave offered, Location of work place, transfer facilities given by the organization, recognition for work accomplished, Working
hours for each day, Overtime pay given by the organization as 55.8,51.7,48.3,45.8,44.2&40% respectively. It is concluded from the analysis that 55.8% of the respondents "Agree" toward the factors related to their determinants as Salary paid by the organization.
Table 3: One -Sample Statistics Factors N Mean Std.
Deviation
t Sig.(2tailed)
Working hours for each day. 120 3.28 1.195 5.568** .000
Flexibility of work schedule. 120 3.30 1.111 6.273** .000
Location of work. 120 3.26 1.018 5.360** .000
Amount paid for vacation time / Sick leave offered
120
3.29 1.069 5.460** .000
Salary paid by the organization 120 3.38 0.829 6.511** .000
Overtime pay given by the organization 120 3.48 1.297 7.066** .000
Relationship with my co-worker. 120 3.24 0.889 4.030** .000
Opportunity for independence associated with my work roles.
120
3.17 0.979 3.366** .000
Transfer facilities given by the organization. 120 3.42 1.051 6.549** .000
Recognition for work accomplished. 120 3.18 1.003 3.312** .000
Source : Primary data **Significant at 1% level
The parametric 't' test revealed that the mean value ranges from 3.42 to 3.17 with standard deviation is less than one. The ' t' value are statistically significant at 1% level. It is inferred that the mean value is above the
average level . Hence organizational policy interventions helps to overcome work life conflict and women employees are able to balance work & family.
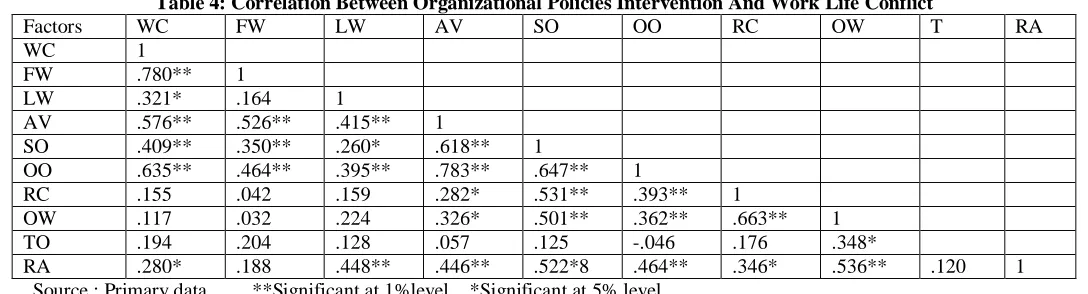
Table 4: Correlation Between Organizational Policies Intervention And Work Life Conflict
Factors WC FW LW AV SO OO RC OW T RA
WC 1
FW .780** 1
LW .321* .164 1
AV .576** .526** .415** 1
SO .409** .350** .260* .618** 1
OO .635** .464** .395** .783** .647** 1
RC .155 .042 .159 .282* .531** .393** 1
OW .117 .032 .224 .326* .501** .362** .663** 1
TO .194 .204 .128 .057 .125 -.046 .176 .348*
RA .280* .188 .448** .446** .522*8 .464** .346* .536** .120 1
Source : Primary data **Significant at 1%level *Significant at 5% level
(Note :WC - Working hours for each day, FW - Flexibility of work schedule, LW - Location of work, AV- Amount paid for vacation time / Sick leave offered, SO - Salary paid by the organization, OO- Overtime pay given by the organization, RC- Relationship with my co-worker, OW- Opportunity for independence associated with my work roles, TO- Transfer facilities given by the organization, RA- Recognition for work accomplished).
Table 3 shows the correlations value among organizational policies intervention. It indicates a
693
Copyright © 2011-15. Vandana Publications. All Rights Reserved.
have a better correlation value with work life balance and helps to overcome quality of work life conflict.
IX.
FINDINGS AND CONCLUSION
Leading a peaceful life in the comfort zone is the highest priority for every women employee. This study provides that 3 imbalances are the major sources of employee dissatisfaction components of quality of work life such as 'Opportunity for independence associated with my work roles', 'Relationship with my co-worker', 'Transfer facilities given by the organization'. They need to improve the 3 determinants influencing women
employees' work life balance. Human resource
development is an important phase on quality of work life. It is concluded that a good percentage of respondents agree with the organizational policies interventions . IT sector is required to take necessary steps to improve whatever they are lacking.
REFERENCES
[1] Lakhawat P.S, Viswakarma.P, Varma .N (2011) ”QWL among sales professionals in Insurance sectors; Allahabad Uttarpradesh”, The journal of Management sciences. (pp 1-8).
[2] Smita R.Chavan(2011) “Acritical study on work life balance of BPO Employees in India”,International conference on Technology & Business management, March 2011 (Pp 966-977).
[3] Babatundb Akanji (2012) “Realities of QWL in Nigeira; perceptions or Role conflict and coping beliefs”, Business Management and education 10.02.2012 (pp 248-263)
[4] Chandranshu Sinha(2012) “Factors affecting Quality of Work life Empirical Evidence from Indian Organization”, Australian Journal of Business and management Research vol.1 no.11 Feb2012, pp (31-40). [5] Freyedon Ahmadi, Adel salavati, Ebrahim Raja bzadeh (2012) “Survey relationship between QWL and organizational commitment in public organizational in Kurdistan province”, interdisciplinary journal of contemporary research in business, May 2012 vol 4, no1.