R E S E A R C H
Valuing New Jersey’s Ecosystem Services and Natural Capital:
A Spatially Explicit Benefit Transfer Approach
Shuang Liu•Robert Costanza•Austin Troy•
John D’Aagostino•Willam Mates
Received: 11 September 2008 / Accepted: 23 March 2010 / Published online: 16 April 2010
Springer Science+Business Media, LLC 2010
Abstract We intend to estimate the value of ecosystem
services in the U.S. State of New Jersey using spatially explicit benefit transfer. The aggregated net rent, a con-servative underestimate for the total economic value of the state’s natural environment, ranged from $11.6 to $19.6 billion/year, conditional on how inclusive we were in selecting the primary studies used to calculate the central tendency values to transfer. In addition to calculating the range, mean, and standard deviation for each of 12 eco-system services for 11 Land Use/Land Cover (LULC) types, we also conduct a gap analysis of how well eco-system service values are represented in the literature. We then map these values by assuming a mean value for each LULC and apply this to spatial data. As to sensitivity analysis, we calculate the net present value of New Jersey’s natural environment utilizing three different methods of discounting. These research results provide a useful, albeit imperfect, basis for assessing the value of ecosystem ser-vices and natural capital, and their comparison with the value of conventional human and built capitals.
Keywords Ecosystem services valuation
Natural capital accountingEnvironmental
decision-makingTrade-offs Central tendency point transferGeneralization errors Measurement errors Uncertainty
Introduction
Natural capital consists of those components of the natural environment that provide a long-term stream of benefits to individual people and to society as a whole. The benefits provided by natural capital include both goods and ser-vices. Goods can derive from both ecosystem sources (e.g., timber) and abiotic sources (e.g., mineral deposits), while services are mainly provided by ecosystems. Examples of ecosystem services include temporary storage of floodwa-ter by wetlands; long-floodwa-term storage of climate-alfloodwa-tering greenhouse gases in forests; and dilution and assimilation of wastes by rivers.
Between 1986 and 1995, New Jersey converted almost 60,000 hectares of its forests, farmland, and wetlands to other uses; this is roughly 4.4 per cent of the total area of these ecosystems, and averages out to some 20 hectares per day in conversion (Hasse and Lathrop2001). It is important to know the economic value of this lost natural capital so that tradeoffs with other market and non-market goods and services can be evaluated. The challenge then is to prompt society to acknowledge the value of ecosystem services and natural capital (Ehrlich and Pringle 2008). Monetary valuation is not the only way to tackle this challenge (e.g., Munda2005; Proctor and Drechsler2006; Spash and Vatn
2006). Yet the identification and measurement of ecosys-tem service values can be an effective way to weigh tradeoffs between development and conservation (Daily Electronic supplementary material The online version of this
article (doi:10.1007/s00267-010-9483-5) contains supplementary
material, which is available to authorized users.
S. Liu (&)
GPO Box 1700, Canberra, ACT 2601, Australia e-mail: [email protected]
S. LiuR. CostanzaA. Troy
Gund Institute for Ecological Economics and Rubenstein School of Environment and Natural Resources, University of Vermont, Burlington, VT, USA
J. D’AagostinoW. Mates
1997; Costanza and others 1997; Millennium Ecosystem Assessment 2003; NRC 2005; Farber and others 2006; Sukhdev2008).
Ecosystem goods and services may be divided into two general categories: market goods and services and non
-market goods and services.While measuring market values simply requires monitoring market data for observable trades, non-market values of goods and services are much more difficult to measure. When there is no explicit market for services, a more indirect means of assessing values must be applied. A spectrum of valuation techniques commonly used to estimate values when market values do not exist has been developed (Freeman2003; Champ and others2003; NRC2005; Farber and others2006).
However, practitioners can rarely afford the luxury of conducting original non-market valuation studies (e.g., Iovanna and Griffiths2006). As the ‘‘bedrock of practical policy analysis (Pearce and others2006, p. 254)’’, benefit transfer has gained popularity in the last several decades as decision-makers have sought timely and cost-effective ways to value ecosystem services and natural capital (Wilson and Hoehn2006).
Benefit transfer involves obtaining an estimate for the value of ecosystem services through the analysis of a single study or group of studies which have been previously carried out to value similar goods or services in similar contexts. The transfer itself refers to the application of derived values and other information from the original study site to a policy site (Brookshire and Neill 1992; Desvousges and others1992).
This study aims to assess the non-market benefits provided by New Jersey’s natural environment by using benefit transfer technology. In addition to our efforts to make the transferred results spatially explicit, we also offer three other contributions to research literature. First, we conduct a gap analysis to understand how well eco-system service values are represented in the literature; this information is valuable if we are going to fill in gaps in ecosystem service valuation literature and thereby identify future directions for original studies. Second, in order to reduce generalization errors, in addition to the LULC filter which is commonly used to ensure the similarities between study and policy sites, we also apply two more filters (socio-economic status filter and uniqueness filter) to the selection process of the original baseline studies on which we estimate the central tendency (mean) value for transfer. Third, we explicitly document the uncertainty associated with our estimates by changing the pool size and the quality of original studies by providing the standard deviation of the transferred mean values, and by applying three different discounting techniques in esti-mating the Net Present Value (NPV) of the natural capital.
Background and Methods
Ecosystem Service Valuation with Benefit Transfer Ecosystem service valuation (ESV) is the process of assessing the contributions of ecosystem services to sus-tainable scale, fair distribution, and efficient allocation (Costanza and Folke 1997). One application of ESV is natural capital accounting, that is, to provide for compar-isons of natural capital to physical and human capital in regard to their contributions to human welfare (Liu and others2010).
In accounting for the value of natural capital, practi-tioners often face the challenge of estimating multiple ecosystem service values brought about by multiple land covers/use. This is a daunting task considering how costly and time-consuming it is to even calculate the value of a single ecosystem service provided by a single land cover/ use. Benefit transfer is, therefore, often applied to meet this challenge as indicated in a recent survey of benefit transfer studies recorded in the Environmental Valuation Reference Inventory (EVRI), the world’s largest online environmental valuation database. The survey reveals that almost 60% of recorded studies valued multiple ecosystem services and over 30% estimated services for multiple land cover/use (Liu and othersin press).
There are two ways to conduct benefit transfer: point transfer and function transfer (Rosenberger and Loomis
2003; Navrud and Ready 2007a). The latter is arguably more accurate because it can capture the heterogeneity across sites by changing the independent variables such as the ecological characteristics of the sites, the socio-eco-nomic and demographic characteristics of relevant popu-lations, and the proposed change in provision between the study and policy sites.
The most ambitious type of function transfer is based on meta-analysis. In the field of environmental economics, it refers specifically to the practice of using a collection of formal and informal statistical methods to synthesize the results found in a well-defined class of empirical studies (Smith and Pattanayak2002). One of the major conceptual advantages over other transfer approaches is that meta-analysis utilizes information from a greater number of studies, thus providing more rigorous measures of central tendency which are sensitive to the underlying distribution of the study site measures (Rosenberger and Loomis2000; Shrestha and Loomis2003; Bergstrom and Taylor2006).
is a mean or a median (Rosenberger and Loomis 2003). Point transfer is the technique we applied in this study. Spatially Explicit Benefit Transfer
A recent trend in conducting benefit transfer is to conduct the transfer using Geographical Information System (GIS) (Eade and Moran 1996; Troy and Wilson 2006). The technique involves combining one land cover layer with another layer representing the geography by which eco-system services are aggregated—i.e. watershed, town or park. ESV is made spatially explicit by dis-aggregating landscapes into their constituent land cover elements and ecosystem service types. Spatial disaggregation increases the potential management applications for ecosystem ser-vice valuation by allowing users to visualize the explicit location of ecologically important landscape elements and overlay those with other relevant themes for analysis.
In order for stakeholders to evaluate the change in ecosystem services, they must be able to examine…eco-system service values for a specific and well-defined area of land which is related to an issue pertinent to them. Therefore, several types of spatially explicit boundary data can be linked to land cover and valuation data within a GIS. The aggregation units used for ecosystem service mapping efforts should be driven by the intended policy or management application, keeping in mind that there are tradeoffs to reducing the resolution too much. For example, a local program targeted at altering land management for individual large property owners might want to use indi-vidual land parcel boundaries as the aggregation unit. However, this mapping level would yield far too much information for a national-level application. A state agency with programs managing all lands (e.g. a water resources agency) might use watersheds as units or a state agency managing state parks might be better off using the park boundaries, or park district boundaries as units.
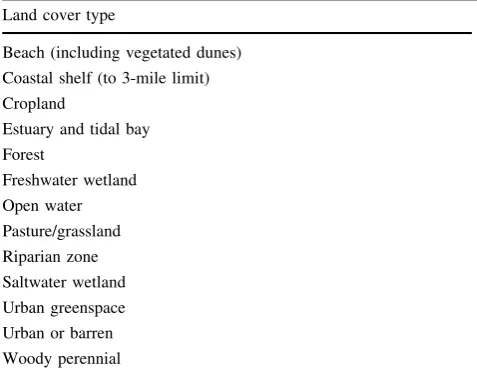
A New Jersey-specific LULC typology was developed for the purposes of calculating and spatially assigning ecosystem service values. At the time of our research this typology was a variant of the most recent New Jersey Department of Environmental Protection (DEP) classifi-cation for the 1995/1997 LULC by watershed management area layer. The new typology condenses a number of DEP classes having similar ecosystem service value and creates several new classes to reflect important differences in ecosystem service values which occur within a given DEP class. The development of land cover typology began with a preliminary survey of available GIS data for New Jersey to determine the basic land cover types present and the level of categorical precision in those characterizations. This process resulted in a typology of 13 mutually exclu-sive LULC classes for the State of New Jersey (Table1).
We then mapped the ecosystem service estimates using the Hydrological Unit Codes (HUC) of 14 sub-watersheds across the state of New Jersey. This was done by com-bining DEP’s watershed management area layer with the modified LULC layer and cross tabulating acreage by land cover type and subwatershed. Graduated color maps were then created to show both per-acre and total value estimates for all New Jersey subwatersheds.
Reduction of Generation Errors with Transfer Filters Point transfer assumes that the economic value for an ecosystem service at the study site is the same as that of the policy site. Similarly, function transfer assumes there is a uniform valuation function between the two sites. Only in very rare circumstances can these assumptions be justified. Generation errors occur when ecosystem service values from a study site are adapted to represent a different policy site and the errors are inversely related to the degree of similarity between the two sites (Rosenberger and Stanley
2006).
Existing efforts that apply central tendency point transfer technique typically use a LULC cover to ensure the correspondence of ecosystem services between study sites and policy sites (e.g., Costanza and others 1997). Yet the application of this filter alone is believed to insufficiently reduce the generalization errors (Plummer2009).
In this study, we apply two more filters: a socio-eco-nomic filter and a uniqueness filter. Studies must satisfy two criteria to be selected: they (1) must refer to a tem-perate region in North America or Europe to ensure simi-larity in socio-economic factors (e.g., income, and attitude towards the environment) between these areas and New Jersey, and (2) must estimate the value of an ecosystem service that is also provided by New Jersey’s natural Table 1 New Jersey LULC typology
Land cover type
Beach (including vegetated dunes) Coastal shelf (to 3-mile limit) Cropland
Estuary and tidal bay Forest
environment. For example, the aesthetic and recreational services provided by species endemic to areas outside New Jersey were not included, even if those areas are in North America or Europe.
Explicit Documentation of Measurement Errors
Over time, the benefit transfer method has become a practical way of making informed decisions when primary data col-lection is not feasible due to budget and time constraints (Moran1999). However, compared to conducting original valuation studies, benefit transfer is always a second-best strategy because of the inevitable inaccuracy associated with transferred results (Navrud and Ready2007b). This is not only because the correspondence between study sites and policy sites is often imperfect, but also because judgment and insights are required in all of the steps in undertaking a benefit transfer exercises, which introduces subjectivity and uncertainty (Pearce and others2006).
Measurement error arises when researchers’ decisions affect the accuracy of the transferred ecosystem service values (Rosenberger and Stanley2006). In reporting ben-efit transfer results, it is important to document measure-ment errors explicitly, which will allow policy makers to evaluate the tradeoffs between limitations of benefit transfer versus its substantially lower cost (Plummer2009). In this study, we engage three methods of documenting the measurement errors. First, we report the range of values obtained by changing the pool size and quality cutoff of the original studies.
We classified valuation studies into three categories according to their quality. Type A studies include peer-reviewed empirical analyses using conventional environ-mental economic techniques (e.g., Travel Cost, Hedonic Pricing and Contingent Valuation) to elicit individual consumer preferences for ecosystem services. Type B studies are commonly referred to as ‘grey literature’, which represent non peer-reviewed analyses such as technical reports, PhD theses, and government documents also using conventional environmental economic techniques. Type C studies are secondary studies summarizing primary valua-tion literature and they can possibly include both conven-tional environmental economic techniques and non-conventional techniques (e.g., energy analyses) to generate synthesis estimates of ecosystem service values.
Initially, only Type-A studies were included because the accuracy of benefit transfer is partially dependent on the measurement errors in the original studies. As Brookshire and Neill mentioned, ‘‘benefit transfers can only be as accurate as the initial benefit estimates (1992).’’ However, this peer-review-only filter might lead to errors due to publication selection bias if the values in published studies are not representative of those in the broader empirical
literature (Rosenberger and Stanley 2006). Therefore, we include six non-peer-reviewed studies to present a more complete picture of the range of ecosystem service values associated with the New Jersey landscape, even though this may potentially result in reduced accuracy.
We identified a total of 94 Type A and 6 Type B and C studies for benefit transfer. Because some studies provided more than one estimated value for a given LULC, the set of 94 Type A studies provided a total of 163 individual value estimates and the full database provided 210 individual value estimates. We translated each estimate into 2004 U.S. dollars per acre per year, computed the central ten-dency of the economic estimate for a given ecosystem service for a given LULC as represented by mean value (Rosenberger and Loomis 2003), and multiplied the mean by the total statewide area for that LULC generated from Geographical Information Systems (GIS). We used the following formula to calculate the total ecosystem service value flow of a given land use type:
VðESiÞ ¼
Xn
k¼1
AðLUiÞ VðESkiÞ ð1Þ
whereA(LUi)=area of land use (i) andV(ESki)=per acre
annual value of ecosystem services (k) for each land use (i). It should be noted that our approach estimates aggregate values based on multiplying aggregate levels of services by the shadow or marginal value of each service. This approach underestimates total economic value (area under the demand cure) because it ignores consumer surplus.
In addition to reporting the range of ecosystem service values by changing the pool size and quality of original studies, we also attempt to explicitly document the uncer-tainty associated with our transfer estimates by providing the standard deviation of the transferred means, and by applying three different discounting techniques in estimating the Net Present Value (NPV) of the natural capital.
NPV Calculation and Sensitivity Analysis
If we think of ecosystem services as a stream of annual ‘income’, then the ecosystems that provide those services can be thought of as part of New Jersey’s total natural capital. To quantify the value of that capital, we must convert the stream of benefits from the future flow of ecosystem services into a Net Present Value (NPV). This conversion requires some form of discounting.
Discounting of the flow of services from natural assets is controversial (Azar and Sterner 1996; Nordhaus 2007; Stern and Taylor 2007). There is debate over whether discounting is appropriate at all (i.e., a zero discount rate) and whether one should assume a non-constant discount rate over time. A constant rate assumes ‘‘exponential’’ discounting, but ‘‘decreasing,’’ ‘‘logistic,’’ ‘‘intergenera-tional,’’ and other forms of discounting have also been proposed (i.e., Azar and Sterner1996; Sumaila and Walt-ers,2005; Weitzman1998; Newell and Pizer2003).
We apply three different types of discounting techniques to calculate the NPV of New Jersey’s natural capital. The general form for calculating the NPV is:
NPV¼X
1
t¼0
VtWt ð2Þ
whereVt=the value of the service at that timet;Wt=the
weight used to discount the service at timet
For standard exponential discounting, Wt is
exponen-tially decreasing into the future at the discount rate, r.
Wt¼
1 1þr
t
ð3Þ
Another general approach to discounting argues that dis-count rates should not be constant, but should decline over time. There are two lines of argument supporting this conclusion. The first, according to Weitzman (1998) and Newell and Pizer (2003), argues that discount rates are uncertain thus their average value should decline over time. As Newell and Pizer put it: ‘‘future rates decline in our model because of dynamic uncertainty about future events, not static disagreement over the correct rate, nor an underlying belief or preference for deterministic declines in the discount rate (2003, p. 55).’’ A second line of reasoning for declining rates is attributed to Azar and Sterner, who first deconstruct the discount rate into a ‘‘pure time pref-erence’’ component and an ‘‘economic growth’’ component (1996). They argue that the pure time preference compo-nent should be set to 0% in terms of social policy. The economic growth component is then set equal to the overall rate of growth of the economy, under the assumption that in more rapidly growing economies there will be more income in the future and its impact on human welfare will be marginally less, due to the assumption of decreasing marginal utility of income. If the economy is assumed to be growing at a constant rate into the indefinite future, this reduces to the standard approach of discounting, using the growth rate for r. If, however, one assumes that there are fundamental limits to economic growth, or if one simply wishes to incorporate uncertainty and be more conservative about this assumption, one can allow the assumed growth rate (and discount rate) to decline in the future.
Finally, we apply a recently developed technique called ‘‘intergenerational discounting (Sumaila and Walters
2005).’’ This approach includes conventional exponential discounting for the current generation, but it also includes conventional exponential discounting for future genera-tions. Future generations can then be assigned separate discount rates that may differ from those assumed for the current generation. For the simplest case whereby the discount rates for current and future generations are the same, the following formula results (Sumaila and Walters
2005, pp. 139):
Wt¼dtþ
ddt1t
G ð4Þ
where d¼ 1
1þr; G=the generation time in years (25 for
this example).
Results
Gap Analysis
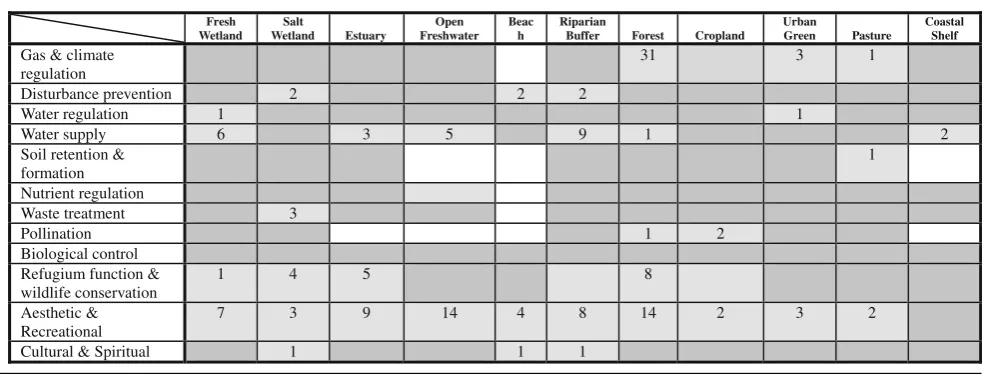
Part of the value of going through an ecosystem services evaluation is to identify the gaps in existing information and thereby reveal where new research is required. The data reported in the light grey boxes in Tables2 and 3
show 163 and 210 individual value estimates, obtained from the Type A and Type A–C valuation papers respec-tively. Areas shaded in white represent situations where we do not expect a particular ecosystem service to be associ-ated with a particular LULC type (i.e., pollination on the coastal shelf). Areas shaded in dark grey represent cells where we do anticipate a service to be provided by a LULC type, but for which there is currently no empirical research available to satisfy our search criteria.
Only 26% of the cells were filled in if we limit the results to Type A studies. More cells were marked when we expanded the analysis to include Type B and Type C studies. Table3 indicates the results of including the six additional studies. This increases the number of marked cells to 42%. The gap analysis indicates that many land-scapes of interest from an environmental management perspective simply have not yet been studied adequately for their non-market ecosystem service values.
for many of the land cover types represented in this study. This is because several ecosystem services which we might reasonably expect to be delivered by functioning forests, wetlands, and riparian buffers simply remain unaccounted for in present-day analysis. As more of these services are better accounted for, the totalestimated value associated with each land cover type would likewise increase. Spatially Explicit Point Transfer
Using the list of land cover classes shown in Table1, we synthesized the available economic valuation data to generate baseline ecosystem service value estimates for
the entire study area in New Jersey. All results were standardized to average 2004 U.S. dollar equivalents per acre per year to provide a consistent basis for compari-son. The aggregated baseline value results based on Type A studies for all land cover types are presented in Table4.
Each cell represents the standardized mean for ecosys-tem services associated with each LULC type. For the purpose of clarity and in line with recent practice (e.g. Costanza and others 1997; Eade and Moran 1999) all results represent the statistical mean for each LULC-eco-system service pairing. Because a mean value can be based on more than one estimate, the actual number of estimates Table 2 Gap analysis of valuation literature using Type A studies only
h s e r F Wetland
Salt
Wetland Estuary Open Freshwater
Beac h
Riparian
Buffer Forest Cropland Urban
Green Pasture Coastal
Shelf
Gas & climate regulation
31 3 1
Disturbance prevention 2 2 2
Water regulation 1 1
Water supply 6 3 5 9 1 2
Soil retention & formation
1
Nutrient regulation
Waste treatment 3
Pollination 1 2
Biological control Refugium function & wildlife conservation
1 4 5 8
Aesthetic & Recreational
7 3 9 14 4 8 14 2 3 2
Cultural & Spiritual 1 1 1
Total $ estimates: 163 Total studies: 94
Table 3 Gap analysis of valuation literature using type A-C studies
Fresh Wetland
Salt
Wetland Estuary Open Freshwater
Beac h
Riparian
Buffer Forest Cropland Urban
Green Pasture Coastal
Shelf
Gas & climate regulation
1 39 3 3
Disturbance prevention 1 3 1 2 2
Water regulation 2 1 1
Water supply 7 3 5 9 2 3
Soil retention & formation
1 2
Nutrient regulation 1 1
Waste treatment 1 4 1 1
Pollination 1 3 1
Biological control 1 1 1 1 1
Refugium function & wildlife conservation
2 5 6 8 2
Aesthetic & Recreational
8 3 10 14 4 8 15 2 3 3
Cultural & Spiritual 1 1 1 1 1 1 1
used to derive each average ecosystem service value is reported separately as online supplementary material.
In addition to a single point estimate, the minimum, maximum, and median dollar values are also presented for further review in the online supplementary material. As these tables reveal, means do tend to be more sensitive to upper bound and lower bound outliers in the literature, and therefore some differences do exist between the mean and median estimates. For example, the mean for beach value is approximately 42,000 dollars per acre per year, while the median is 38,000 thousand, a difference of approximately four thousand dollars per year, or about 10% of the mean. Given that a difference of approximately 10% represents the largest mean-median gap in our analysis, we are con-fident that the results reported here would not dramatically change if means were replaced with medians.
While it might be tempting to narrow the statistical ranges by discarding high and low ‘outliers’ found in the literature, the estimated values we used all derived directly from empirical studies. Therefore, there is no defensible reason for favoring one set of estimates over another. Data trimming, therefore, was not used.
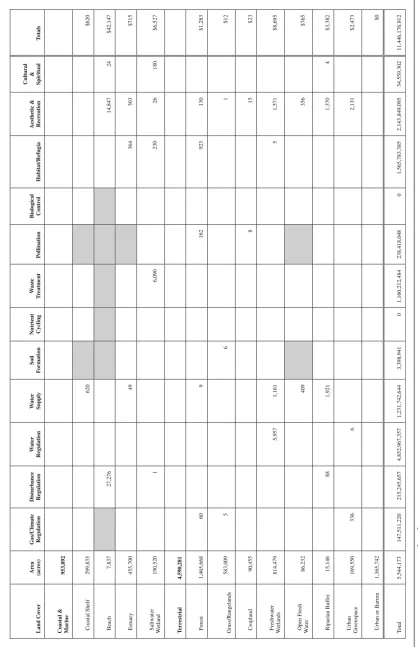
As the summary column at the far right in Table4
shows, there is considerable variability in ecosystem ser-vice values delivered by different LULC types. On a per acre basis, beaches appear to provide the highest annual values ($42,147) with disturbance control ($27,276) and aesthetic and recreation values ($14,847) providing the largest individual values to that aggregated sum. Next, it appears that both freshwater wetlands ($8,695) and salt-water wetlands ($6,527) contribute significantly to the annual value flow throughout the State of New Jersey. At the other end of the value spectrum, cropland ($23) and grassland/rangeland ($12) provide the lowest annual values documented on an annualized basis. While significantly different from the other LULC types, this finding is con-sistent with the focus of the current analysis onnon-market
values, which by definition excludes provisioning services provided by agricultural landscapes.
The column totals at the bottom of Table4also reveal considerable variability between the average values deliv-ered by different ecosystem service types in New Jersey. Once each average value is multiplied by the area of LULC that provides it, and is summed across all possible com-binations, both water regulation and aesthetic/recreational services clearly stand out as the largest ecosystem service contributors in New Jersey, cumulatively representing over $6 billion in estimated annual value. At the other end of the spectrum, due to gaps in peer-reviewed literature, soil formation, biological control, and nutrient cycling con-tribute the least known value to New Jersey.
Table5 presents the standard deviation (SD) of the means for different value estimates within and across
studies for each ecosystem service-LULC pairing based on Type A studies. The first and second numbers in paren-theses indicate the number of studies and observations from which the SDs were calculated, respectively.
Ten of the 35 marked cells are based on a single observation (and therefore have a zero standard deviation). Three estimates are based on a single study which in each case provides more than one observation. Where trans-ferred results were based on more than one study, the standard deviation is larger than the mean in about half the cases.
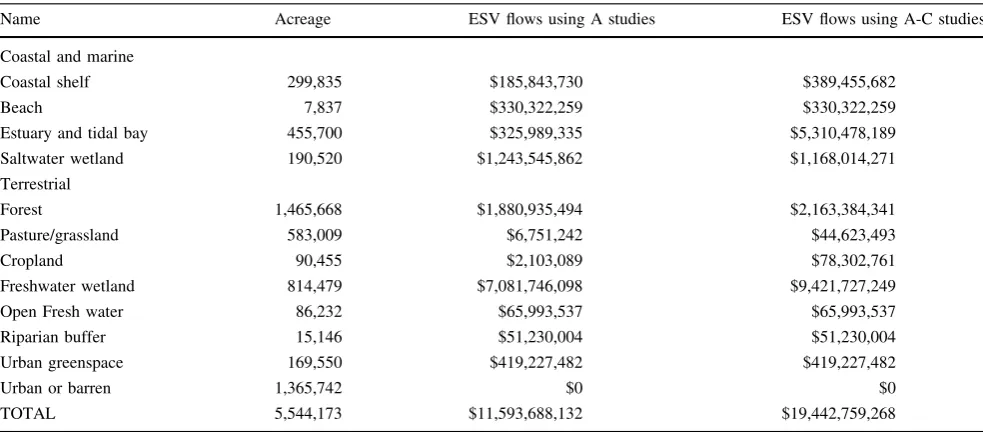
The results in Table6 indicate that substantial non-market value is delivered to New Jersey citizens every year by functioning ecological systems. The total estimated value of ecosystem services using Type A studies alone is approximately $11 billion per year, while including Type B and C studies increases the total to $19 billion per year.
Consistent with the per unit benefit transfer data reported above in Table4, it appears that ecosystem services asso-ciated with both freshwater and saltwater wetland types, as well as forests and estuaries, tend to provide the largest cumulative economic value.
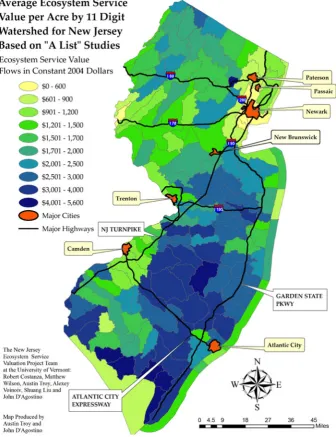
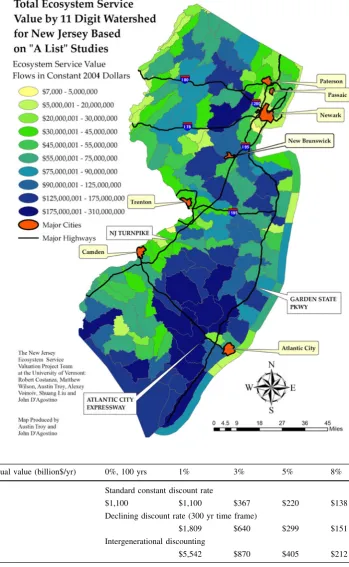
As the following maps of New Jersey show (Figs. 1,2), there is considerable heterogeneity in the delivery of eco-system service values across the New Jersey landscape with notable differences between interior and coastal watersheds across the state. Watersheds associated with an abundance of freshwater wetlands consistently reveal the highest annual values statewide.
Net Present Value of Natural Capital and Sensitivity Analysis
Table7 expresses the NPV results after using a range of constant discount rates, including a decreasing discount rate, intergenerational discounting, and 0% discounting using a limited time frame.
Table 4 Summary of average value of annual ecosystem services (based on type A studies only) Land Co v er Ar ea (acr es ) Gas/Cli m ate Regulation Dist urbanc e Regulation Wa te r Regulation W ater Sup p ly Soil Fo rm a ti o n Nutrien t Cycling W a ste T re a tm en t P o llinat ion Biological Contr o l Habitat/Refugia Aesth etic & Recr eation Cultural & Spiritual T o tals
Coastal & Marine
953,892 Coastal Shelf 299,835 620 $620 B ea ch 7,837 27,276 14,847 24 $42,147 Estuar y 455,700 49 364 303 $715 Sa ltw ater We tl an d 190,520 1 6,090 230 26 180 $6,527 T err est rial 4,590,281 F orest 1,465,668 60 9 162 923 130 $1,283 Grass/Ran g elands 583,009 5 6 1 $12 Cropland 90,455 8 15 $23
Freshwater Wetlands
814,479 5,957 1,161 5 1,571 $8,695
Open Fresh Wa
te r 86,232 409 356 $765 Riparian B u ff er 15,146 88 1,921 1,370 4 $3,382
Urban Greensp
ace 169,550 336 6 2,131 $2,473 Urban or B arren 1,365,742 $0 T otal 5,544,173 147,511,220
215,245,657 4,852,967,357 1,231,742,644
Table 5 The standard deviation of transferred estimates for ecosystem services (based on type A studies only) Land Co v er Gas/ Cl im ate Regulation
Disturbance Regulation
Wa te r Regulation W a ter Supply Soil Fo rm a ti o n
Nutrient Cycling
Wa st e T re a tm en t P o llinat ion Biological Contr o l Habitat/Refugia
Aesthetic & Recr
eation
Cultural & Spir
itual ) 2 , 2( 6 4 1 fl e h S la ts a o
C Bea
ch 9,139 (2, 2) ) 1 , 1( 0 ) 4 , 4( 7 6 0 8 1 ) 3 , 3( 1 4 yr a ut s E
548 (2, 5)
448 (4, 9)
Saltw
ater
W
etland
0 (2, 2)
9098 (
1, 3)
274 (4, 4)
25 (3, 3)
0 (1, 1)
F
o
rest
103 (13, 31)
0 (1, 1)
0 (1, 1)
1211 (5, 8)
204 (9, 14)
) 2 , 2( 1 ) 1 , 1( 0 ) 1 , 1( 0 s d na le g na R/ ss ar G ) 2 , 2( 5 1 ) 2 , 2( 4 d na l p or
C Freshwater
W
etlands
0 (1, 1)
1183 (5, 6)
0 (1, 1)
1600 (5, 8)
Open Fresh
W
ater
234 (5, 5)
Next, following Newell and Pizer (2003), we let the discount rate approach 0 as time approaches a certain number of years into the future by multiplying r by e-kt, where k was set to .00007. Because the rate of approaching zero for r is faster than that of 1
1þr
t
, this function levels out at a discount rate of 0% and Wt eventually starts to
increase again. Wt is therefore forced to level out at its
minimum value. Also, carrying this calculation to infinity would lead to an infinite NPV. To illustrate this, the summation was carried out for 300 years, which is the time frame used by Newell and Pizer (2003). As one can see from an inspection of Table7, in general it can be con-cluded that a decreasing discount rate leads to higher NPV values, assuming a constant discount rate. Newell and Pizer (2003) argue for a 4% discount rate, declining to approx-imately 0% in 300 years, based on historical data. If we use 3%, this would place the NPV of New Jersey’s natural capital assets at around $0.6 trillion.
Finally, the ‘‘intergenerational discounting’’ method leads to significantly larger estimates of NPV than standard constant exponential discounting, especially at lower dis-count rates. At a disdis-count rate of 1% the NPVs are five times as great, while at 3% they are more than twice as large compared to the results calculated with a constant discount rate.
Discussion
Convergent Validity Test of the Benefit Transfer Result Benefit transfer estimates are of great interest to practi-tioners, provided that they can be proven to be adequate
surrogates for on-site estimates achievable only by con-ducting costly original studies. While the practical allure is clear, can benefit transfer provide reasonable estimates of ecosystem service value? The issue can be framed in terms of the concept of theoretical validity, which has been explained by Mitchell and Carson (1989, p. 190):
‘‘Thevalidityof a measure is the degree to which it measures the theoretical construct under investiga-tion. This construct is, in the nature of things, unob-servable; all we can do is to obtain imperfect measures of that entity (Italics added).’’
In the context of benefit transfer, the ‘‘theoretical con-struct under investigation’’ is an estimate that has been derived from an original study site. The true value itself is unobservable (i.e., it cannot be measured directly) so the user has no way of determining its ‘‘real’’ value. All the analyst can do is to try to make the transferred value—an imperfect surrogate of the ‘‘real’’ value—acceptable or
validfor transfer.
So, the question arises: how does the policy-maker know when the transferred value is valid or not if there is no ‘‘real’’ value to compare it with? One answer is to introduce another estimated value as a baseline for comparison—which is in many cases obtained from an original study—and see if it is convergent with the transferred value. The two value estimates are then compared and if they are not statistically different,
convergent validity of value transfer is established (Bishop and others 1997).
To see whether the convergent validity criterion is met, we compared our transferred results with those derived from an original Hedonic Pricing (HP) study. It was Table 6 Total acreage and mean flow of ecosystem services in New Jersey (2004 US$ acre-1yr-1)
Name Acreage ESV flows using A studies ESV flows using A-C studies
Coastal and marine
Coastal shelf 299,835 $185,843,730 $389,455,682
Beach 7,837 $330,322,259 $330,322,259
Estuary and tidal bay 455,700 $325,989,335 $5,310,478,189
Saltwater wetland 190,520 $1,243,545,862 $1,168,014,271
Terrestrial
Forest 1,465,668 $1,880,935,494 $2,163,384,341
Pasture/grassland 583,009 $6,751,242 $44,623,493
Cropland 90,455 $2,103,089 $78,302,761
Freshwater wetland 814,479 $7,081,746,098 $9,421,727,249
Open Fresh water 86,232 $65,993,537 $65,993,537
Riparian buffer 15,146 $51,230,004 $51,230,004
Urban greenspace 169,550 $419,227,482 $419,227,482
Urban or barren 1,365,742 $0 $0
conducted in New Jersey with the study site consisting of seven local housing markets located in Middlesex, Mon-mouth, Mercer and Ocean Counties (Costanza and others
2007). In most respects those markets are demographi-cally similar to the state as a whole. The results demon-strated that homes closer to environmental urban green space and beaches generally sell for more than homes further away, all else being equal. The HP estimates were similar to those derived from the benefit transfer approach, but were considerably higher in some cases. For urban greenspace, the annual value ranged from $10,015 to $11,066 per acre (using a 3% discount rate) compared to the $2,473 estimate derived from the benefit transfer. In the case of beaches, however, the HP value
range is between $31,540 and $43,718 compared to the benefit transfer estimate of $42,147. In this case the estimates converged quite closely.
Possible Sources of Benefit Transfer Error
Generalization Errors
Benefit transfer assumes that there is an underlying meta-valuation function so that variance in ecosystem services value could be explained by biophysical and socio-eco-nomic attributes across time and space. Ideally, value estimates from the original studies are normally distributed random draws and their mean will be a close Fig. 1 Average ecosystem
approximation of the population mean (Rosenberger and Stanley2006).
However, this is not the case for the studies we used and for at least three reasons. First, we selected peer-reviewed papers only; second, most value estimates originated from a small number of original studies as Table6shows; third,
only valuation studies with study areas in North American and European countries are included to ensure a similarity in socio-economic factors to New Jersey.
These socio-economic factors together with land cover type and the ecosystem service which is being valued are the only attributes controlled during the central tendency Fig. 2 Total ecosystem service
value by watershed for New Jersey
Table 7 Net present value (NPV) of annual flows of ecosystem services using various discount rates and discounting techniques
Annual value (billion$/yr) 0%, 100 yrs 1% 3% 5% 8%
Standard constant discount rate
$11 $1,100 $1,100 $367 $220 $138
Declining discount rate (300 yr time frame)
$11 $1,809 $640 $299 $151
Intergenerational discounting
point transfer process. Many factors were not taken into account, such as methodology and the type and degree of marginal change the value estimates were associated with, all of which have been shown to be significant in explaining the variance of value estimates by various meta-analyses (e.g. Liu and Stern 2009). Compared to point transfer, meta-analysis provides a more robust transfer because it attempts to statistically measure systematic relationships between valuation estimates and these con-textual attributes (Loomis 1992). Theoretically, the more variables the researcher can control in the transfer process the more likely the result will be valid. Given the limited control researchers have in point transfer, one should not be surprised to see some large variances in the transferred benefit estimates as shown in Table6.
We chose to preserve these large variances in the present study and no studies were removed from the database as outliners and limited sensitivity analyses were performed. The studies we analyzed encompassed a wide variety of time periods, geographic areas, investigators, and analytic methods.
Measurement Errors
Measurement errors have two potential sources: those inherent in the original studies and those that arise during a transfer process. The quality of original studies used in the benefit transfer exercise affects the overall quality and scope of the final value estimate (Brouwer2000). For the sake of quality control, we divided our studies into three quality categories. No further steps were taken to employ a qualitative comparison of the papers because no quality indicator available to compare studies within each of our categories.
In our study, the value of non-marketed ecosystem services was obtained by multiplying the level of each service by a shadow price representing the marginal value of that service in question. This technique is analogous to that used in calculating gross domestic product (GDP) which measures the total value of market goods and ser-vices (Howarth and Farber2002).
However, this approach has several major limitations (Costanza and others2007). First, a static, partial equilib-rium framework ignores interdependencies and dynamics. Second, it assumes smooth responses to changes in the levels of ecosystem services with no thresholds or dis-continuities. Of note however, is that some research is underway on incorporating interdependencies, dynamics, and thresholds into ecosystem service valuation (e.g., Boumans and others2002; Finnoff and Tschirhart 2008). Third, it assumes spatial homogeneity of services within ecosystems. One might argue that every ecosystem is unique, and per-acre values derived from elsewhere may
not be relevant to the ecosystems being studied. Even within a single ecosystem, the value per acre depends on the size of the ecosystem. The marginal cost per acre is generally expected to increase as the quantity supplied decreases, and a single average value is not the same thing as a range of marginal values.
To solve the problem of spatial homogeneity, one has to first limit valuation to a single ecosystem in a single location and use only data developed expressly for the unique ecosystem being studied, and then repeat the pro-cess for ecosystems in other locations. For a state with the size and landscape complexity of New Jersey, this approach would preclude any valuation at the statewide level. However, methods are evolving to address spatial heterogeneity directly, by building statistical models that incorporate GIS data explicitly (MIMES 2008). This issue was partially addressed by spatial modeling analysis and results do not support an across-the-board claim that the per-acre value depends on the size of the study area. While the claim does appear to hold true for nutrient cycling and probably other services, the opposite position holds up fairly well for what ecologists call ‘‘net primary produc-tivity’’ or NPP (Costanza and others2007). In another case study, Costanza and others (2008) mapped the value of storm protection by coastal wetlands using high resolution maps of storm tracks and intensity, wetland area, GDP, and storm damage to estimate avoided costs. The study showed that while the spatial variability was large, the average and median values were more similar (but somewhat larger) than those we used in this study.
to underestimate ‘‘true’’ values. Fourth, the aggregated net rent is calculated as a conservative underestimate for total economic value of the state’s natural environment in this study. Last, conclusions drawn from our gap analysis reveals that our estimates are conservative.
Conclusion
Using benefit transfer methods we estimate that the total value of ecosystem services in New Jersey is $11.6 (Type A studies only) or $19.6 (Type A-C studies) billion/year. If we use conventional discounting with a constant annual discount rate of 3% (a rate often used in studies of this type), and if we assume that the $11.6 billion/yr of eco-system services continues in perpetuity, the present value of those services, i.e. the value of the natural capital which provides the services, would be $387 billion.
We have tried to display our results in a way which allows an appreciation of the range of values and their distribution and variance (Tables4, 5 and online supple-mentary materials). It is clear from an inspection of these tables that the final estimates are not precise. However, they are much better estimates than the alternative of assuming that ecosystem services have zero value, or, alternatively, of assuming they have infinite value. Prag-matically, in estimating the value of ecosystem services it seems better to be approximately right than precisely wrong.
In addition, the accuracy required for transferred results depends on the intended use of the ESV information (Brookshire and Neill1992; Desvousges and others 1992; Pearce and others2006), and it is important to be aware of the opportunity cost of choosing benefit transfer techniques rather than conducting original research (Allen and Loomis
2008). For instance, using transferred ESV information to assist an environmental policy decision-maker in setting broad priorities for assessment and possible action may require a moderate level of accuracy. In this regard, any detriment resulting from minor inaccuracies is adequately offset by the potential gains. This use of ESV represents an increase of knowledge which costs society relatively little if the ESV results are later found to be inaccurate. How-ever, if the same information is used as a basis for a management decision involving irreversibility, the cost to society of a wrong decision can be quite high. In this case, it can be argued that the accuracy of a value transfer should be very high.
Considering its accuracy level, the results from our transfer exercise are valid in helping to create public awareness of the value of natural capital and in providing an interim assessment of whether a more in-depth analysis is worthwhile. Yet we caution against its application in
providing a basis for environmental decision-making related to critical natural capital and irreversibility (Farley2008). Acknowledgments This work was supported in part by Contract No. SR04-075, ‘‘Valuation of New Jersey’s Natural Capital’’ from the New Jersey Department of Environmental Protection, William Mates, Project Officer. We thank Dr Matthew Wilson for his suggestions in conducting the research and DEP’s Bureau of Geographic Informa-tion services for providing original LULC data.
References
Allen BP, Loomis J (2008) The decision to use benefit transfer or conduct original valuation search valuation research for benefit-cost and policy analysis. Contemporary Economic Policy 26:1– 12
Azar C, Sterner T (1996) Discounting and distributional consider-ations in the context of global warming. Ecological Economics 19:169–184
Bergstrom JC, Taylor LO (2006) Using meta-analysis for benefits transfer: theory and practice. Ecological Economics 60:351–360 Bishop RC, Champ PA, Brown TC, McCollum DW (1997) Measur-ing non-use values: theory and empirical applications. In: Kopp RJ, Pommerehne WW, Schwarz N (eds) Determining the value of non-marketed goods. Kluwer Academic Publishers, Norwell, MA, pp 59–81
Boumans R, Costanza R, Farley J, Wilson MA, Portela R, Rotmans J, Villa F, Grasso M (2002) Modeling the dynamics of the integrated earth system and the value of global ecosystem services using the GUMBO model. Ecological Economics 41:529–560
Brookshire DS, Neill HR (1992) Benefit transfers—conceptual and empirical issues. Water Resources Research 28:651–655 Brouwer R (2000) Environmental value transfer: state of the art and
future prospects. Ecological Economics 32:137–152
Champ PA, Boyle KJ, Brown TC (eds) (2003) A primer on nonmarket
valuation. Kluwer Academic Publishers, Dordrecht, The
Netherlands
Costanza R, Folke C (1997) Valuing ecosystem services with efficiency, fairness and sustainability as goals. In: Daily G (ed) Nature’s services: societal dependence on natural ecosystems. Island Press, Washington, DC, pp 49–68
Costanza R, Farber SC, Maxwell J (1989) Valuation and management of wetland ecosystems. Ecological Economics 1:335–361 Costanza R, dArge R, deGroot R, Farber S, Grasso M, Hannon B,
Limburg K, Naeem S, Oneill RV, Paruelo J, Raskin RG, Sutton P, van den Belt M (1997) The value of the world’s ecosystem services and natural capital. Nature 387:253–260
Costanza R, Wilson M, Troy A, Voinov A, Liu S, D’Agostino J (2007) The value of New Jersey’s ecosystem services and natural capital. Project report to the New Jersey Department of Environmental Protection
Costanza R, Perez-Maqueo O, Martinez ML, Sutton P, Anderson SJ, Mulder K (2008) The value of coastal wetlands for hurricane protection. Ambio 37:241–248
Daily G (1997) Nature’s services: societal dependence on natural ecosystems. Island Press, Washington, DC
Desvousges WH, Naughton MC, Parsons GR (1992) Benefit trans-fer—conceptual problems in estimating water—quality benefits using existing studies. Water Resources Research 28:675–683 Eade JDO, Moran D (1996) Spatial economic valuation: benefits
Ehrlich PR, Pringle RM (2008) Where does biodiversity go from here? A grim business-as-usual forecast and a hopeful portfolio of partial solutions. Proceedings of the National Academy of Sciences of the United States of America 105:11579–11586 Farber S, Costanza R, Childers DL, Erickson J, Gross K, Grove M,
Hopkinson CS, Kahn J, Pincetl S, Troy A, Warren P, Wilson M (2006) Linking ecology and economics for ecosystem manage-ment. BioScience 56:121–133
Farley J (2008) The role of prices in conserving critical natural capital. Conservation Biology 22:1399–1408
Finnoff D, Tschirhart J (2008) Linking dynamic economic and ecological general equilibrium models. Resource and Energy Economics 30:91–114
Freeman AK III (2003) The measurement of environmental and resources values. Resource for the Future, Washington, DC Gund Institute for Ecological Economics, University of Vermont
(2008) Multiscale Integrated Models of Ecosystem Services
(MIMES).http://www.uvm.edu/giee/mimes/
Hasse J, Lathrop R (2001) Measuring urban growth in New Jersey: a report on recent land development patterns utilizing the 1986– 1995 NJ DEP Land Use/Land Cover Dataset. Cook College, Rutgers University, New Brunswick, NJ, 41 pp
Howarth RB, Farber S (2002) Accounting for the value of ecosystem services. Ecological Economics 41:421–429
Iovanna R, Griffiths C (2006) Clean water, ecological benefits, and benefits transfer: a work in progress at the US EPA. Ecological Economics 60:473–482
Limburg KE, O’Neill RV, Costanza R, Farber S (2002) Complex systems and valuation. Ecological Economics 41:409–420 Liu S, Stern DI (2009) A meta-analysis of contingent valuation
studies in coastal and near-shore marine ecosystems. Socio-Economics and the Environment Discussion (SEED) working paper 25, CSIRO
Liu S, Robert C, Stephen F, Austin T (2010) Valuing ecosystem services. Annals of the New York Academy of Sciences 1185:54–78
Liu S, Portela R, Ghermandi A, Rao N, Wang X (in press) Environmental benefit transfers of ecosystem service valuation. In: van den Belt M, Costanza R (eds) Treatise on estuarine and coastal science. Elsevier
Loomis JB (1992) The evolution of a more rigorous approach to benefit transfer - benefit function transfer. Water Resources Research 28:701–705
Millennium Ecosystem Assessment (2003) Ecosystems and human well-being: a framework for assessment. Island Press, Washing-ton, DC
Mitchell RC, Carson RT (1989) Using surveys to value public goods: the contingent valuation method. John Hopkins University Press, Baltimore
Moran D (1999) Benefits transfer and low flow alleviation: what lessons for environmental valuation in the UK? Journal of Environmental Planning and Management 42:425–436 Munda G (2005) Multiple criteria decision analysis and sustainable
development. In: Figueira J, Greco S, Ehrgott M (eds) Multiple criteria decision analysis: state of the art surveys. Springer, New York, NY, pp 954–986
Navrud S, Ready R (2007a) Lessons learned for environmental value transfer. In: Navrud S, Ready R (eds) Environmental value
transfer: issues and methods. Springer, Dordrecht, The Nether-lands, pp 283–290
Navrud S, Ready R (2007b) Preface. In: Navrud S, Ready R (eds) Environmental value transfer: issues and methods. Springer, Dordrecht, The Netherlands, p vii
Newell RG, Pizer WA (2003) Discounting the distant future: how much do uncertain rates increase valuations? Journal of Envi-ronmental Economics and Management 46:52–71
Nordhaus W (2007) Economics: critical assumptions in the Stern review on climate change. Science 317:201–202
Pearce D, Atkinson G, Mourato S (2006) Chapter 17 Benefit transfer. In: Pearce D, Atkinson G, Mourato S (eds) Cost-benefit analysis and the environment: recent developments. OECD Publishing, Paris, France, pp 253–267
Plummer ML (2009) Assessing benefit transfer for the valuation of ecosystem services. Frontier in Ecology and the Environment 7(1):38–45
Proctor W, Drechsler M (2006) Deliberative multicriteria evaluation. Environment and Planning C-Government and Policy 24:169– 190
Rosenberger RS, Loomis JB (2000) Benefit transfer of outdoor recreation use values. USDA Forest Service
Rosenberger RS, Loomis JB (2003) Benefit transfer. In: Champ PA, Boyle KJ, Brown TC (eds) A primer on nonmarket valuation. Kluwer Academic Publishers, Dordrecht, The Netherlands, pp 445–483
Rosenberger RS, Stanley TD (2006) Measurement, generalization, and publication: Sources of error in benefit transfers and their management. Ecological Economics 60:372–378
Shrestha RK, Loomis JB (2003) Meta-analytic benefit transfer of outdoor recreation economic values: testing out-of-sample
convergent validity. Environmental Resource Economics
25:79–100
Smith VK, Pattanayak SK (2002) Is meta-analysis a Noah’s ark for non-market valuation? Environmental Resource Economics 22:271–296
Spash CL, Vatn A (2006) Transferring environmental value esti-mates: issues and alternatives. Ecological Economics 60:379– 388
Stern N, Taylor C (2007) Economics: climate change: risk, ethics, and the Stern review. Science 317:203–204
Sukhdev P (2008) The economics of ecosystems and biodiversity: an interim report. European Communities
Sumaila UR, Walters C (2005) Intergenerational discounting: a new intuitive approach. Ecological Economics 52:135–142 Troy A, Wilson MA (2006) Mapping ecosystem services: practical
challenges and opportunities in linking GIS and value transfer. Ecological Economics 60:435–449
US National Research Council (2005) Valuing ecosystem services: toward better environmental decision-making. The National Academies Press, Washington, DC
Weitzman ML (1998) Why the far-distant future should be discounted at its lowest possible rate. Journal of Environmental Economics and Management 36:201–208