ORIGINAL RESEARCH
Comparison of Echo-Planar Diffusion-Weighted
Imaging and Delayed Postcontrast T1-Weighted
MR Imaging for the Detection of Residual
Cholesteatoma
F. Venail A. Bonafe V. Poirrier M. Mondain A. Uziel
BACKGROUND AND PURPOSE: Echo-planar diffusion-weighted imaging (DWI) and delayed postcontrast T1-weighted MR imaging (DPI) have been proposed in previous studies to detect residual middle ear cholesteatomas, with varying results. We assessed and compared these 2 techniques in patients with canal wall-up tympanoplasty.
MATERIALS AND METHODS: This was a prospective cohort study. Patients who underwent surgery for middle ear cholesteatoma had CT scanning 9 months after the surgery. If opacity was observed (64%) on CT scans, DWI and DPI were performed before second-look surgery. CT, MR imaging, and surgical data were available for 31 patients. Charts were reviewed independently by 3 blinded examiners. Interobserver agreement for MR imaging was calculated (Cohen). Sensitivity, spec-ificity, positive predictive value (PPV), and negative predictive value (NPV) were calculated for these techniques: 1) alone or in association, and 2) according to the residual cholesteatoma size measured during surgery.
RESULTS: Interobserver agreement was better for DWI (⫽0.81) than for DPI (⫽0.51). Sensitivity, specificity, PPV, and NPV values were 60%, 72.73%, 80%, and 50%, respectively, with DWI; and 90%, 54.55%, 78.26%, and 75%, respectively, with DPI. With cholesteatomas⬎5 mm, the sensitivity and specificity of DWI reached 100% and 88%, respectively, with values for DPI reaching 100% and 80%, respectively. The association of both techniques only allowed improvements in the specificity for lesions⬎5 mm.
CONCLUSIONS:Both techniques gave acceptable results for residual cholesteatoma detection. DWI is more specific but less sensitive than DPI. Their concurrent use may benefit patients by avoiding undue surgery.
U
nlike recurrent cholesteatoma, developing from recurring retraction pockets or defects in the tympanic membrane reconstruction, residual cholesteatoma cannot be detected by a simple clinical examination. Several methods, such as eusta-chian tube endoscopy,1-3have been proposed to detect resid-ual cholesteatomas. However, these techniques are not rou-tinely performed and canal wall-up (CWU) tympanoplasties for middle ear cholesteatoma usually require second-look sur-gery to rule out the presence of residual cholesteatoma, ob-served in 6%–57% of patients in large series.4,5Any reliable noninvasive method of detecting residual cholesteatomas could allow the avoidance of second-look surgery in patients with no hearing loss after the first surgery.Imaging may prove useful in this respect. High-resolution CT displays a high negative predictive value (NPV)6because of the lack of opacity in the middle ear cleft or because the mas-toid cavity correlates well with the absence of a residual lesion. Nevertheless, CT does not allow a distinction between residual cholesteatoma and granulation or postoperative inflamma-tory or scar tissue.3,7However, MR imaging has been
pro-posed to discriminate these tissues. T1- and T2-weighted se-quences associated with diffusion-weighted imaging (DWI) or delayed postcontrast T1 sequences (DPI), though not early postcontrast T1 sequences, seem able to detect residual cho-lesteatoma among other types of tissue.8-10Results of sensitiv-ity, specificsensitiv-ity, positive predictive value (PPV), and NPV vary among previous studies.8,11-15One explanation for this dis-crepancy may be the different sizes of residual cholesteatomas studied in these series.
In the present study, we aimed to compare echo-planar imaging (EPI) DWI and DPI for the detection of residual cho-lesteatoma after CWU surgery. Here we describe the results obtained by using both types of sequences in each patient, along with the size of the residual cholesteatoma as surgically verified in all patients.
Materials and Methods
This prospective study was performed after submission and approval from the local ethics committee of our institution. All patients (N⫽
49) who had undergone CWU tympanoplasty were followed for mid-dle ear cholesteatoma between March 2004 and March 2007 in our tertiary referral center. All patients underwent CT at least 9 months after surgery. Among these patients, 31 of 49 displayed 1 or more opacities on CT, suggesting the presence of soft tissue in the middle ear cleft and/or in the mastoid (63.27% of cases). All 31 patients un-derwent MR imaging (T1- and T2-weighted, DWI, early postcontrast T1-weighted, and DPI sequences) before a second-look surgery. The time elapsed between MR imaging and surgery was calculated in months for each patient.
Received December 26, 2007; accepted after revision February 6, 2008.
From the Ear, Nose, and Throat Department (F.V., M.M., A.U.), University Hospital Gui de Chauliac, Montpellier, France; INSERM U583–Institute for Neurosciences in Montpellier (F.V., M.M., A.U.), Montpellier, France; and Neuroradiology Department (A.B., V.P.), Uni-versity Hospital Gui de Chauliac, Montpellier, France.
Please address correspondence to Frederic Venail, MD, Service ORL B, CHU Gui de Chauliac, 80 Avenue Augustin Fliche, 34295 Montpellier, France; e-mail: f-venail@ chu-montpellier.fr
DOI 10.3174/ajnr.A1100
HEAD
&
NECK
ORIGINAL
MR imaging was performed by using a 1.5T scanner with a polar-ized FLEX head coil (Intera; Philips, Koninklijke, the Netherlands) for sensitivity encoding imaging. We used the following protocols:
1) axial spin-echo T2-weighted sequences: TR⫽4500 ms; TE⫽ 100 ms; section thickness⫽2 mm; 128⫻128 matrix; FOV⫽230 mm; NEX, 3; total duration, 2:58.2.
2) axial spin-echo 3D T2-weighted driven equilibrium sequences: TR⫽1500 ms; TE⫽250 ms; section thickness⫽0.5 mm; 128⫻ 128⫻128 matrix; FOV⫽210 mm; NEX, 3; total duration, 6:28.5.
3) axial and coronal spin-echo T1-weighted sequences: TR⫽500 ms; TE⫽15 ms; section thickness⫽2 mm; 128⫻128 matrix; FOV⫽ 230 (axial) and 220 (coronal) mm; NEX, 6 (axial) and 4 (coronal); total duration, 4:05.9 (axial) and 5:27.5 (coronal).
4) axial and coronal spin-echo T1-weighted sequences immedi-ately and 30 –50 minutes after intravenous injection of gadolinium-diethylene-triaminepentaacetic (0.2 mL/kg): TR⫽500 ms; TE⫽15 ms; section thickness⫽2 mm; 128⫻128 matrix; FOV⫽230 (axial) and 240 (coronal) mm; NEX, 6 (axial) and 4 (coronal); total duration, 2:56.5 (axial) and 5:27.5 (coronal).
5) axial and coronal EPI single-shot spin-echo T2-weighted (b⫽0 s/mm2) and EPI single-shot spin-echo DWI (b⫽500 and 1000
s/mm2) sequences: TR⫽3500 ms; TE⫽100 ms; section thickness⫽
2.5 mm; 128⫻128 matrix; FOV⫽250 (axial) and 210 (coronal) mm; NEX, 8; total duration, 3:03.5 (axial) and 3:39.5 (coronal).
Images were independently analyzed by 2 radiologists (A.B. and V.P.) and 1 otologic surgeon (F.V.) blinded to patients’ identities. For
each patient, T2 EPI and DPI sequences were randomly analyzed by the examiners so that the results of 1 of the 2 sequences could not influence the interpretation of the other. For DWI, the diagnosis of residual cholesteatoma was made on increased intensity signals atb⫽
1000 s/mm2compared with the baseline T2 EPI sequence in the axial
and coronal planes. A T2 shinethrough effect, presenting as an intense hypersignal atb⫽0 s/mm2whose intensity did not decrease atb⫽
1000 s/mm2,16was also considered as potentially indicative of
resid-ual cholesteatoma. Axial and coronal sequences were cautiously ob-served together to eliminate susceptibility artifacts. For DPI, the di-agnosis of residual cholesteatoma was made on low-to-intermediate signals unenhanced on DPI axial and coronal images.
Interobserver agreement for DWI and DPI was calculated (Cohen ). In cases of mismatch between observers, the sequences were re-viewed and the final diagnosis was proposed by the 2 senior radiolo-gists. Sensitivity, specificity, PPV, and NPV were calculated for each, of DWI and DPI alone, and of DWI associated with DPI. In this last case, we studied 2 types of association: “DWI or DPI,” in which the evidence of residual cholesteatoma on any 1 of these 2 examinations was sufficient to propose the diagnosis; or “DWI and DPI,” in which the suggestion of residual cholesteatoma on both examinations was required to propose the diagnosis.
In cases of pearl-like residual cholesteatoma, the size was mea-sured in millimeters during the surgery. In cases of infiltrating cho-lesteatoma, the size was estimated in millimeters by the surgeon ac-cording to the surgical extent of the lesion. Other tissues found were reported either as inflammatory tissue or fibrosis (Table 1).
Sensitivity, specificity, PPV, and NPV were also calculated with respect to the size of the residual cholesteatoma measured during surgery (⬎3 or 5 mm).
Results
Description of Patients
Thirty-one patients could be included in this study (M/F ra-tio⫽1:0.93). Mean age at the time of the first surgery was 37.6⫾ 4.05 years (median, 43.5 years; minimum, 4 years; maximum, 80 years). The mean delay between MR imaging and second-look surgery was 3.24⫾1.12 months (median, 2 months; minimum, 0 months; maximum, 37 months). Mean delay between the 2 surgeries was 20.07⫾3.10 months (me-dian, 13 months; minimum, 10 months; maximum, 72 months). During the second-look surgery, residual cholestea-toma was observed in 19 patients (61.3%), whereas scar tissue, granulation tissue, and inflammatory tissue were observed in all other patients. Assuming that all patients without opacity on CT were free from disease (18/49), we could estimate the total rate of residual cholesteatoma at 38.78% (19/49) in this series of CWU tympanoplasties.
Interobserver Agreement
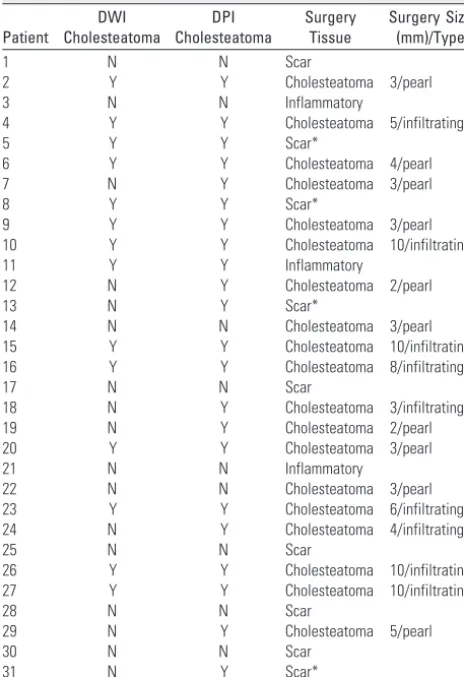
[image:2.594.53.285.57.395.2]Interobserver agreement was good between the 2 radiologists for diffusion imaging (A.B. and V.P.,⫽ 0.81). However agreement between the radiologists and the otologic surgeon was poorer (⫽0.75 and 0.56). Interobserver agreement was lower in cases of DPI (⫽0.51 between the 2 radiologists’ evaluations and⫽0.46 and 0.39 between the radiologists’ and the otologic surgeon’s evaluations).
Table 1: Results of DWI, DPI, and surgical findings in 31 patients
Patient
DWI Cholesteatoma
DPI Cholesteatoma
Surgery Tissue
Surgery Size (mm)/Type
1 N N Scar
2 Y Y Cholesteatoma 3/pearl
3 N N Inflammatory
4 Y Y Cholesteatoma 5/infiltrating
5 Y Y Scar*
6 Y Y Cholesteatoma 4/pearl
7 N Y Cholesteatoma 3/pearl
8 Y Y Scar*
9 Y Y Cholesteatoma 3/pearl
10 Y Y Cholesteatoma 10/infiltrating
11 Y Y Inflammatory
12 N Y Cholesteatoma 2/pearl
13 N Y Scar*
14 N N Cholesteatoma 3/pearl
15 Y Y Cholesteatoma 10/infiltrating 16 Y Y Cholesteatoma 8/infiltrating
17 N N Scar
18 N Y Cholesteatoma 3/infiltrating
19 N Y Cholesteatoma 2/pearl
20 Y Y Cholesteatoma 3/pearl
21 N N Inflammatory
22 N N Cholesteatoma 3/pearl
23 Y Y Cholesteatoma 6/infiltrating 24 N Y Cholesteatoma 4/infiltrating
25 N N Scar
26 Y Y Cholesteatoma 10/infiltrating 27 Y Y Cholesteatoma 10/infiltrating
28 N N Scar
29 N Y Cholesteatoma 5/pearl
30 N N Scar
31 N Y Scar*
Note:—Y indicates yes; N, no; pearl, pearl-like cholesteatoma; infiltrating, infiltrating form
EPI DWI
Of 31 patients (Table 1), we observed 12 true-positive cases (TP, cases with cholesteatoma found during surgery and pre-viously diagnosed by MR imaging), 3 false-positive cases (FP,
cases with no cholesteatoma found during surgery though previously diagnosed by MR imaging), 8 true-negative cases (TN, cases with no cholesteatoma found during surgery and previously diagnosed as having no cholesteatoma by MR im-aging), and 8 false-negative cases (FN, cases with cholestea-toma found during surgery though not previously diagnosed by MR imaging). Sensitivity, specificity, PPV, and NPV were 60%, 72.73%, 80%, and 50%, respectively, in the whole series (Tables 2 and 3). If we considered only the residual cholestea-tomas of⬎3 mm, the sensitivity, specificity, PPV, and NPV were 75%, 84.21%, 75%, and 84.21%, respectively (Tables 2 and 3). Finally, considering only the residual cholesteatomas of⬎5 mm, we found that the sensitivity, specificity, and NPV increased to 100%, 88%, and 100%, respectively, whereas the PPV decreased to 66.67% (Tables 2 and 3).
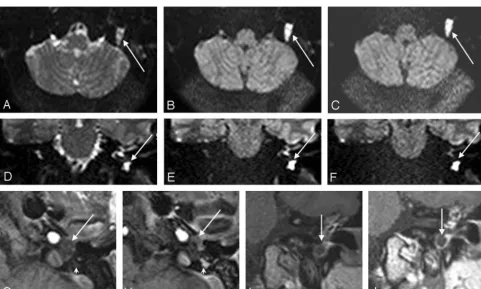
DWI sequences displayed a high sensitivity as soon as the size reached 5 mm, with a poor detection rate for smaller cho-lesteatomas (Figs 1 and 2). Indeed, all FNs corresponded to small-sized residual pearl-like cholesteatomas (from 2 to 5 mm), with no misdiagnosis of large cholesteatomas. The smallest lesion detected was 3 mm. Specificity was lower than sensitivity whatever the size of the lesion. The FPs detected with this sequence comprised 2 patients with silastic sheets and 1 patient with granulation tissue (Fig 3).
DPI
Of 31 patients (Table 1), we observed 18 TP, 5 FP, 6 TN, and 2 FN cases. Sensitivity, specificity, PPV, and NPV were 90%, 54.55%, 78.26%, and 75%, respectively, in the whole series
Fig 1.EPI DWI and DPI for residual cholesteatoma detection. DWI axialb⫽0 (A),b⫽500 (B),b⫽1000 (C) and coronalb⫽0 (D),b⫽500 (E),b⫽1000 (F) EPI sequences. Early
(GandI) and delayed (HandJ) postconstrast T1-weighted axial (GandH) and coronal (IandJ) sequences. With DWI, an increasing signal intensity (arrow) betweenb⫽0 (AandD),
[image:3.594.52.286.68.147.2]b⫽500 (BandE), andb⫽1000 (CandF) sequences was observed in the left hypotympanum. A hypointense space-occupying lesion (arrows) was also observed in the left hypotympanum with early enhanced T1-weighted sequences (GandI). This lesion was more conspicuous on delayed imaging (HandJ,large arrows), whereas scar tissue was intensely enhanced (small arrows). Thus, surgery confirmed a residual cholesteatoma of the left hypotympanum.
Table 2: Summary of the diagnostic values of DWI and DPI sequences according to residual cholesteatoma size
DWI DPI
Total Series
Tumor ⬎3 mm
Tumor ⬎5 mm
Total Series
Tumor ⬎3 mm
Tumor ⬎5 mm Se 60.00 75.00 100.00 90.00 100.00 100.00 Spe 72.73 84.21 88.00 54.55 75.00 80.00 PPV 80.00 75.00 66.67 78.26 68.75 54.55 NPV 50.00 84.21 100.00 75.00 100.00 100.00
Note:—Se indicates sensitivity; Spe, specificity; PPV, positive predictive value; NPV,
[image:3.594.54.287.200.281.2]negative predictive value.
Table 3: Summary of the diagnostic values of DWI and/or DPI sequences according to residual cholesteatoma size*
DWI or DPI DWI and DPI
Total Series
Tumor ⬎3 mm
Tumor ⬎5 mm
Total Series
Tumor ⬎3 mm
Tumor ⬎5 mm Se 90.00 100.00 100.00 60.00 75.00 100.00 Spe 54.55 75.00 80.00 72.73 84.21 88.00 PPV 78.26 68.75 54.55 80.00 75.00 66.67 NPV 75.00 100.00 100.00 50.00 84.21 100.00
Note:—Se indicates sensitivity; Spe, specificity; PPV, positive predictive value; NPV,
negative predictive value.
[image:3.594.55.537.386.675.2](Tables 2 and 3). If we considered only the residual cholestea-tomas of⬎3 mm, then sensitivity, specificity, PPV, and NPV were 100%, 75%, 68.75%, and 100%, respectively (Tables 2 and 3). Finally, if we considered only the residual cholesteato-mas of⬎5 mm, then sensitivity and NPV were unchanged, whereas specificity increased to 80% and PPV decreased to 55% (Tables 2 and 3).
DPI proved a highly sensitive examination with a sensitiv-ity of 100% for lesions of⬎3 mm (Figs 1 and 2). The smallest lesion detected was 2 mm. The specificity was decreased by numerous FP cases. Most interesting, these cases included those observed with DWI: 2 cases of silastic sheet and 1 case of granulation tissue. The last 2 additional cases were scar tissue with silastic sheet (Fig 3).
DWI Sequences in Association with DPI
We calculated the intraclass correlation between the results of these 2 techniques and found an average concordance (⫽ 0.56) between DWI and DPI. On examining the associations DWI or DPI and DWI and DPI, we observed that the results of the former were identical to those of DWI alone and the results of the latter were identical to those of DPI alone for any size of residual cholesteatoma.
Discussion
EPI DWI for Residual Cholesteatoma Detection
Cholesteatoma is characterized by an increasing signal inten-sity along with b-value on EPI DWI. One explanation could be
the decreased mobility of the water molecules in the residual cholesteatoma, so-called diffusion restriction.17,18 Another explanation for the increased intensity of the epidermoid tu-mors could be the T2 shinethrough effect.16
Previous studies on the detection of residual cholesteato-mas, including those with 17– 45 patients, have reported sen-sitivities varying from 12.5% to 100%, depending on the study.11-14Conversely, the specificity has been more compa-rable among these studies, ranging from 91% to 100%. In the present study, the sensitivity, specificity, PPV, and NPV were 60%, 72.73%, 80%, and 50%, respectively.
The discrepancy concerning the sensitivity and the speci-ficity cannot be related to interobserver differences, with a good interobserver agreement in both the present (⫽0.81) and previous studies (⫽0.92).12In our opinion, this differ-ence is mainly due to a large variation in the size of the residual cholesteatomas between studies. Indeed, the lowest size of re-sidual cholesteatoma detected seems to range from 4 to 5 mm according to previous articles.11-14Indeed, in a study by Ver-cruysse et al,14only 29% of residual cholesteatomas were⬎3 mm and the corresponding sensitivity was 12.5%. Conversely, Dubrulle et al12observed no lesion of⬍5 mm, hence perhaps relating to the sensitivity of 100% reported in our study. If we consider only the residual cholesteatomas of⬎5 mm in the studies by Aikele et al,11Vercruysse et al,14and Stasolla et al,13 the sensitivity reached 100%, which is consistent with that in our results.
Another explanation for the differences observed between
Fig 2.Mismatch between DWI and DPI, with a small lesion. EPI DWI axialb⫽0 (A),b⫽500 (B),b⫽1000 (C) and coronalb⫽0 (D),b⫽500 (E),b⫽1000 (F) sequences. Early
[image:4.594.53.537.42.344.2]studies could be the delay between MR imaging and surgery. This hypothesis cannot be confirmed, however, because this delay was shorter in series with lower sensitivities (mean delay of 3.24 months in the present study and 15 days in others14) than in other series (maximal delays of 5 and 11 months in studies performed by Dubrulle et al12 and Aikele et al,11 respectively).
DPI for Residual Cholesteatoma Detection
Although MR imaging with gadolinium injection allows a good discrimination between granulation tissue, inflamma-tory tissue, scar tissue, and cholesteatoma in nonoperated ears,19detection of residual cholesteatoma is more problem-atic after CWU surgery. Granulation tissue, inflammatory tis-sue, and cholesterol granulomas can be easily diagnosed on T1, T2, and early postcontrast T1-weighted sequences. With these sequences however, the difference between scar tissue and cholesteatoma remains unclear. Scar tissue is constantly enhanced by gadolinium injection, though the enhancement achieved may be delayed due to poor vascularization. On the other hand, cholesteatomas are never enhanced following gadolinium injection. Cholesteatomas appear bordered by a ring enhancement attached to the enhancing mucosa. This difference forms the basis of DPI for residual cholesteatoma detection.
In a series including 18 patients, Williams et al15reported diagnostic values by using DPI of 85.2% sensitivity, 92.6%
specificity, 92.6% PPV, and 100% NPV. In a later series of 41 patients (including the 18 patients from the earlier series by Williams et al15), Ayache et al8reported values of 90% sensi-tivity, 100% specificity, 100% PPV, and 92% NPV. Interob-server agreement was good (⫽0.78,15) but less than that with DWI.
In our series, we noticed a lower interobserver agreement with DPI (⫽0.51) compared with diffusion imaging. This reflects the high variability seen in the results, even with expe-rienced neuroradiologists. Sensitivity, specificity, PPV, and NPV were 90%, 54.55%, 78.26%, and 75%, respectively, in the whole series. Our results are in accordance with those reported previously except for the specificity. Indeed, we observed 5 FP cases in our study. The sensitivity and the specificity rose to 100% and 80%, respectively, for cholesteatomas⬎5 mm. In previous studies,8,15the smallest residual cholesteatomas de-tected were 3 mm and the sensitivity for lesions⬎5 mm was 100%. Unfortunately, we have no data concerning the number of cholesteatomas⬎5 mm from either study, making it diffi-cult to compare these results with ours.
EPI DWI versus DPI: Complementary or Competitor Techniques?
Owing to its good sensitivity, EPI DWI is efficient for the screening of large residual cholesteatomas. However, the spec-ificity was low for the entire series in the present study. Only one FP case has been described by Dubrulle et al12(bone pate).
Fig 3.FP examinations with DWI and DPI in 2 different patients. Axial (A) and coronal (B) EPI DWIb⫽1000 and coronal DPI (C) sequences. Hyperintense foci were observed in the right
[image:5.594.55.536.44.345.2]We have described 3 additional cases in the present study in-volving a silastic sheet. The magnetic characteristics and the circular shape of this sheet in the mastoid could lead to misdi-agnosed residual cholesteatomas.
DPI is more sensitive but less specific than DWI. Most in-teresting, the FP cases observed with diffusion imaging were also incorrectly identified with DPI. The problems occurred with the silastic sheet, in which the signal intensity character-istics and rounded shape probably misled the radiologist. The last 2 FP cases were scar tissue with a silastic sheet. In these cases, late enhancement with gadolinium was not observed, though it would be reasonable to assume that the delay be-tween the injection and the last imaging was insufficient to reveal the scar tissue.
Silicone sheets like silastic may interfere with cholestea-toma detection. This could lead to a significant problem be-cause these materials are not easily detected on CT (interme-diate signal intensity similar to that of soft tissue). Radiologists should, therefore, be made aware of the presence of such for-eign material to avoid an incorrect diagnosis of residual cholesteatoma.
The choice between these 2 techniques depends on the goal of the examination. Because the aim of imaging for residual cholesteatoma detection is to avoid undue surgery, we advo-cate the use of the more specific examination (ie, DWI). This technique is convenient, fast, and very robust, with good in-terobserver agreements. The main drawback would be the risk of a residual cholesteatoma lost to the follow-up. However, we agree with the view of other authors8,15that small residual cholesteatomas may be left if a close follow-up is performed. This imaging should be repeated with enough time left in be-tween for a residual lesion to reach 5 mm. In our experience, DPI is more difficult to set up due to the delay between injec-tion and imaging. DPI is a time-consuming examinainjec-tion, sometimes requiring general anesthesia, especially in children. Its interpretation requires more experience with a greater de-pendence on the examiner, as shown by the average interob-server agreements. Associating both techniques is interesting, mainly in cases of residual cholesteatoma of⬎5 mm detected with DPI. While keeping the same sensitivity, the use of a DWI and DPI paradigm could increase the specificity from 80% to 88%. In other words, any suggested large lesion observed with DPI but not with DWI would eliminate a residual cholestea-toma diagnosis. In our opinion, both techniques have equal strengths and weaknesses, and as such, we prefer to perform both techniques in each patient.
Conclusion
DWI and DPI techniques are 2 promising tools for residual cholesteatoma detection. They may allow the avoidance of useless surgery in selected patients with no hearing loss after the first stage of cholesteatoma removal. However, interpreta-tion of such sequences requires good training and experience, not only of the otologic surgeon but also the radiologist. DPI is
a very sensitive examination, though interpretation should be carried out with caution due to a large number of FP cases. This examination is a time consuming and difficult to set up, and some may, therefore, prefer EPI DWI, which is a more robust and rapid though a less sensitive examination. Associ-ation of both techniques improves the diagnosis only by in-creasing the specificity with regard to large lesions. Finally, because the sensitivity of neither examination is 100% for small residual cholesteatomas, further investigations are needed to determine when follow-up should begin and how many times the imaging should be repeated to ensure that no residual lesion has been left inside, with regard to medical and cost-effectiveness aspects.
References
1. McKennan KX.Endoscopic ‘second look’ mastoidoscopy to rule out residual epitympanic/mastoid cholesteatoma.Laryngoscope1993;103:810 –14 2. Thomassin JM, Korchia D, Doris JM.Endoscopic-guided otosurgery in the
prevention of residual cholesteatomas.Laryngoscope1993;103:939 – 43 3. Tierney PA, Pracy P, Blaney SP, et al.An assessment of the value of the
preop-erative computed tomography scans prior to otoendoscopic ‘second look’ in intact canal wall mastoid surgery.Clin Otolaryngol Allied Sci1999;24:274 –76 4. Parisier SC, Hanson MB, Han JC, et al.Pediatric cholesteatoma: an
individu-alized, single-stage approach.Otolaryngol Head Neck Surg1996;115:107–14 5. Jansen C.Posterior tympanotomy: access to the middle ear with preservation
of the external ear canal [in German].Arch Klin Exp Ohren Nasen Kehlkopfhei-lkd1967;188:558 –59
6. Thomassin JM, Braccini F.Role of imaging and endoscopy in the follow up and management of cholesteatomas operated by closed technique[in French].Rev Laryngol Otol Rhinol (Bord) 1999;120:75– 81
7. Blaney SP, Tierney P, Oyarazabal M, et al.CT scanning in “second look” com-bined approach tympanoplasty.Rev Laryngol Otol Rhinol (Bord) 2000;121: 79 – 81
8. Ayache D, Williams MT, Lejeune D, et al.Usefulness of delayed postcontrast magnetic resonance imaging in the detection of residual cholesteatoma after canal wall-up tympanoplasty.Laryngoscope2005;115:607–10
9. Kimitsuki T, Suda Y, Kawano H, et al.Correlation between MRI findings and second-look operation in cholesteatoma surgery.ORL J Otorhinolaryngol Relat Spec2001;63:291–93
10. Kosling S, Bootz F.CT and MR imaging after middle ear surgery.Eur J Radiol
2001;40:113–18
11. Aikele P, Kittner T, Offergeld C, et al.Diffusion-weighted MR imaging of cho-lesteatoma in pediatric and adult patients who have undergone middle ear surgery.AJR Am J Roentgenol2003;181:261– 65
12. Dubrulle F, Souillard R, Chechin D, et al.Diffusion-weighted MR imaging sequence in the detection of postoperative recurrent cholesteatoma.Radiology
2006;238:604 –10
13. Stasolla A, Magliulo G, Parrotto D, et al.Detection of postoperative relapsing/ residual cholesteatomas with diffusion-weighted echo-planar magnetic reso-nance imaging.Otol Neurotol2004;25:879 – 84
14. Vercruysse JP, De Foer B, Pouillon M, et al.The value of diffusion-weighted MR imaging in the diagnosis of primary acquired and residual cholesteatoma: a surgical verified study of 100 patients.Eur Radiol2006;16:1461– 67 15. Williams MT, Ayache D, Alberti C, et al.Detection of postoperative residual
cholesteatoma with delayed contrast-enhanced MR imaging: initial findings.
Eur Radiol2003;13:169 –74
16. Chen S, Ikawa F, Kurisu K, et al.Quantitative MR evaluation of intracranial epidermoid tumors by fast fluid-attenuated inversion recovery imaging and echo-planar diffusion-weighted imaging.AJNR Am J Neuroradiol2001;22: 1089 –96
17. Annet L, Duprez T, Grandin C, et al.Apparent diffusion coefficient measure-ments within intracranial epidermoid cysts in six patients.Neuroradiology
2002;44:326 –28
18. Schaefer PW, Grant PE, Gonzalez RG.Diffusion-weighted MR imaging of the brain.Radiology2000;217:331– 45